Berkshire’s Performance vs. the S&P 500
Year
1965 . . . . . . . . . . . . . . . . . . . . . . . . . . . . . . . . . . . . . . . . . . . . . . . . . . . . . . .
1966 . . . . . . . . . . . . . . . . . . . . . . . . . . . . . . . . . . . . . . . . . . . . . . . . . . . . . . .
1967 . . . . . . . . . . . . . . . . . . . . . . . . . . . . . . . . . . . . . . . . . . . . . . . . . . . . . . .
1968 . . . . . . . . . . . . . . . . . . . . . . . . . . . . . . . . . . . . . . . . . . . . . . . . . . . . . . .
1969 . . . . . . . . . . . . . . . . . . . . . . . . . . . . . . . . . . . . . . . . . . . . . . . . . . . . . . .
1970 . . . . . . . . . . . . . . . . . . . . . . . . . . . . . . . . . . . . . . . . . . . . . . . . . . . . . . .
1971 . . . . . . . . . . . . . . . . . . . . . . . . . . . . . . . . . . . . . . . . . . . . . . . . . . . . . . .
1972 . . . . . . . . . . . . . . . . . . . . . . . . . . . . . . . . . . . . . . . . . . . . . . . . . . . . . . .
1973 . . . . . . . . . . . . . . . . . . . . . . . . . . . . . . . . . . . . . . . . . . . . . . . . . . . . . . .
1974 . . . . . . . . . . . . . . . . . . . . . . . . . . . . . . . . . . . . . . . . . . . . . . . . . . . . . . .
1975 . . . . . . . . . . . . . . . . . . . . . . . . . . . . . . . . . . . . . . . . . . . . . . . . . . . . . . .
1976 . . . . . . . . . . . . . . . . . . . . . . . . . . . . . . . . . . . . . . . . . . . . . . . . . . . . . . .
1977 . . . . . . . . . . . . . . . . . . . . . . . . . . . . . . . . . . . . . . . . . . . . . . . . . . . . . . .
1978 . . . . . . . . . . . . . . . . . . . . . . . . . . . . . . . . . . . . . . . . . . . . . . . . . . . . . . .
1979 . . . . . . . . . . . . . . . . . . . . . . . . . . . . . . . . . . . . . . . . . . . . . . . . . . . . . . .
1980 . . . . . . . . . . . . . . . . . . . . . . . . . . . . . . . . . . . . . . . . . . . . . . . . . . . . . . .
1981 . . . . . . . . . . . . . . . . . . . . . . . . . . . . . . . . . . . . . . . . . . . . . . . . . . . . . . .
1982 . . . . . . . . . . . . . . . . . . . . . . . . . . . . . . . . . . . . . . . . . . . . . . . . . . . . . . .
1983 . . . . . . . . . . . . . . . . . . . . . . . . . . . . . . . . . . . . . . . . . . . . . . . . . . . . . . .
1984 . . . . . . . . . . . . . . . . . . . . . . . . . . . . . . . . . . . . . . . . . . . . . . . . . . . . . . .
1985 . . . . . . . . . . . . . . . . . . . . . . . . . . . . . . . . . . . . . . . . . . . . . . . . . . . . . . .
1986 . . . . . . . . . . . . . . . . . . . . . . . . . . . . . . . . . . . . . . . . . . . . . . . . . . . . . . .
1987 . . . . . . . . . . . . . . . . . . . . . . . . . . . . . . . . . . . . . . . . . . . . . . . . . . . . . . .
1988 . . . . . . . . . . . . . . . . . . . . . . . . . . . . . . . . . . . . . . . . . . . . . . . . . . . . . . .
1989 . . . . . . . . . . . . . . . . . . . . . . . . . . . . . . . . . . . . . . . . . . . . . . . . . . . . . . .
1990 . . . . . . . . . . . . . . . . . . . . . . . . . . . . . . . . . . . . . . . . . . . . . . . . . . . . . . .
1991 . . . . . . . . . . . . . . . . . . . . . . . . . . . . . . . . . . . . . . . . . . . . . . . . . . . . . . .
1992 . . . . . . . . . . . . . . . . . . . . . . . . . . . . . . . . . . . . . . . . . . . . . . . . . . . . . . .
1993 . . . . . . . . . . . . . . . . . . . . . . . . . . . . . . . . . . . . . . . . . . . . . . . . . . . . . . .
1994 . . . . . . . . . . . . . . . . . . . . . . . . . . . . . . . . . . . . . . . . . . . . . . . . . . . . . . .
1995 . . . . . . . . . . . . . . . . . . . . . . . . . . . . . . . . . . . . . . . . . . . . . . . . . . . . . . .
1996 . . . . . . . . . . . . . . . . . . . . . . . . . . . . . . . . . . . . . . . . . . . . . . . . . . . . . . .
1997 . . . . . . . . . . . . . . . . . . . . . . . . . . . . . . . . . . . . . . . . . . . . . . . . . . . . . . .
1998 . . . . . . . . . . . . . . . . . . . . . . . . . . . . . . . . . . . . . . . . . . . . . . . . . . . . . . .
1999 . . . . . . . . . . . . . . . . . . . . . . . . . . . . . . . . . . . . . . . . . . . . . . . . . . . . . . .
2000 . . . . . . . . . . . . . . . . . . . . . . . . . . . . . . . . . . . . . . . . . . . . . . . . . . . . . . .
2001 . . . . . . . . . . . . . . . . . . . . . . . . . . . . . . . . . . . . . . . . . . . . . . . . . . . . . . .
2002 . . . . . . . . . . . . . . . . . . . . . . . . . . . . . . . . . . . . . . . . . . . . . . . . . . . . . . .
2003 . . . . . . . . . . . . . . . . . . . . . . . . . . . . . . . . . . . . . . . . . . . . . . . . . . . . . . .
2004 . . . . . . . . . . . . . . . . . . . . . . . . . . . . . . . . . . . . . . . . . . . . . . . . . . . . . . .
2005 . . . . . . . . . . . . . . . . . . . . . . . . . . . . . . . . . . . . . . . . . . . . . . . . . . . . . . .
2006 . . . . . . . . . . . . . . . . . . . . . . . . . . . . . . . . . . . . . . . . . . . . . . . . . . . . . . .
2007 . . . . . . . . . . . . . . . . . . . . . . . . . . . . . . . . . . . . . . . . . . . . . . . . . . . . . . .
2008 . . . . . . . . . . . . . . . . . . . . . . . . . . . . . . . . . . . . . . . . . . . . . . . . . . . . . . .
2009 . . . . . . . . . . . . . . . . . . . . . . . . . . . . . . . . . . . . . . . . . . . . . . . . . . . . . . .
2010 . . . . . . . . . . . . . . . . . . . . . . . . . . . . . . . . . . . . . . . . . . . . . . . . . . . . . . .
2011 . . . . . . . . . . . . . . . . . . . . . . . . . . . . . . . . . . . . . . . . . . . . . . . . . . . . . . .
2012 . . . . . . . . . . . . . . . . . . . . . . . . . . . . . . . . . . . . . . . . . . . . . . . . . . . . . . .
2013 . . . . . . . . . . . . . . . . . . . . . . . . . . . . . . . . . . . . . . . . . . . . . . . . . . . . . . .
2014 . . . . . . . . . . . . . . . . . . . . . . . . . . . . . . . . . . . . . . . . . . . . . . . . . . . . . . .
2015 . . . . . . . . . . . . . . . . . . . . . . . . . . . . . . . . . . . . . . . . . . . . . . . . . . . . . . .
2016 . . . . . . . . . . . . . . . . . . . . . . . . . . . . . . . . . . . . . . . . . . . . . . . . . . . . . . .
2017 . . . . . . . . . . . . . . . . . . . . . . . . . . . . . . . . . . . . . . . . . . . . . . . . . . . . . . .
Compounded Annual Gain – 1965-2017 . . . . . . . . . . . . . . . . . . . . . . . . . . .
Overall Gain – 1964-2017 . . . . . . . . . . . . . . . . . . . . . . . . . . . . . . . . . . . . . .
in Per-Share
Book Value of
Berkshire
Annual Percentage Change
in Per-Share
Market Value of
Berkshire
in S&P 500
with Dividends
Included
23.8
20.3
11.0
19.0
16.2
12.0
16.4
21.7
4.7
5.5
21.9
59.3
31.9
24.0
35.7
19.3
31.4
40.0
32.3
13.6
48.2
26.1
19.5
20.1
44.4
7.4
39.6
20.3
14.3
13.9
43.1
31.8
34.1
48.3
0.5
6.5
(6.2)
10.0
21.0
10.5
6.4
18.4
11.0
(9.6)
19.8
13.0
4.6
14.4
18.2
8.3
6.4
10.7
23.0
19.1%
1,088,029%
49.5
(3.4)
13.3
77.8
19.4
(4.6)
80.5
8.1
(2.5)
(48.7)
2.5
129.3
46.8
14.5
102.5
32.8
31.8
38.4
69.0
(2.7)
93.7
14.2
4.6
59.3
84.6
(23.1)
35.6
29.8
38.9
25.0
57.4
6.2
34.9
52.2
(19.9)
26.6
6.5
(3.8)
15.8
4.3
0.8
24.1
28.7
(31.8)
2.7
21.4
(4.7)
16.8
32.7
27.0
(12.5)
23.4
21.9
20.9%
2,404,748%
10.0
(11.7)
30.9
11.0
(8.4)
3.9
14.6
18.9
(14.8)
(26.4)
37.2
23.6
(7.4)
6.4
18.2
32.3
(5.0)
21.4
22.4
6.1
31.6
18.6
5.1
16.6
31.7
(3.1)
30.5
7.6
10.1
1.3
37.6
23.0
33.4
28.6
21.0
(9.1)
(11.9)
(22.1)
28.7
10.9
4.9
15.8
5.5
(37.0)
26.5
15.1
2.1
16.0
32.4
13.7
1.4
12.0
21.8
9.9%
15,508%
Note: Data are for calendar years with these exceptions: 1965 and 1966, year ended 9/30; 1967, 15 months ended 12/31. Starting in 1979, accounting
rules required insurance companies to value the equity securities they hold at market rather than at the lower of cost or market, which was previously
the requirement. In this table, Berkshire’s results through 1978 have been restated to conform to the changed rules. In all other respects, the results are
calculated using the numbers originally reported. The S&P 500 numbers are pre-tax whereas the Berkshire numbers are after-tax. If a corporation
such as Berkshire were simply to have owned the S&P 500 and accrued the appropriate taxes, its results would have lagged the S&P 500 in years
when that index showed a positive return, but would have exceeded the S&P 500 in years when the index showed a negative return. Over the years,
the tax costs would have caused the aggregate lag to be substantial.
2
�
BERKSHIRE HATHAWAY INC.
To the Shareholders of Berkshire Hathaway Inc.:
Berkshire’s gain in net worth during 2017 was $65.3 billion, which increased the per-share book value of
both our Class A and Class B stock by 23%. Over the last 53 years (that is, since present management took over), per-
share book value has grown from $19 to $211,750, a rate of 19.1% compounded annually.*
The format of that opening paragraph has been standard for 30 years. But 2017 was far from standard: A
large portion of our gain did not come from anything we accomplished at Berkshire.
The $65 billion gain is nonetheless real – rest assured of that. But only $36 billion came from Berkshire’s
operations. The remaining $29 billion was delivered to us in December when Congress rewrote the U.S. Tax Code.
(Details of Berkshire’s tax-related gain appear on page K-32 and pages K-89 – K-90.)
After stating those fiscal facts, I would prefer to turn immediately to discussing Berkshire’s operations. But,
in still another interruption, I must first tell you about a new accounting rule – a generally accepted accounting
principle (GAAP) – that in future quarterly and annual reports will severely distort Berkshire’s net income figures and
very often mislead commentators and investors.
The new rule says that the net change in unrealized investment gains and losses in stocks we hold must be
included in all net income figures we report to you. That requirement will produce some truly wild and capricious
swings in our GAAP bottom-line. Berkshire owns $170 billion of marketable stocks (not including our shares of Kraft
Heinz), and the value of these holdings can easily swing by $10 billion or more within a quarterly reporting period.
Including gyrations of that magnitude in reported net income will swamp the truly important numbers that describe our
operating performance. For analytical purposes, Berkshire’s “bottom-line” will be useless.
The new rule compounds the communication problems we have long had in dealing with the realized gains
(or losses) that accounting rules compel us to include in our net income. In past quarterly and annual press releases,
we have regularly warned you not to pay attention to these realized gains, because they – just like our unrealized gains
– fluctuate randomly.
That’s largely because we sell securities when that seems the intelligent thing to do, not because we are trying
to influence earnings in any way. As a result, we sometimes have reported substantial realized gains for a period when
our portfolio, overall, performed poorly (or the converse).
*All per-share figures used in this report apply to Berkshire’s A shares. Figures for the B shares are 1/1500th of those
shown for the A shares.
3
�
With the new rule about unrealized gains exacerbating the distortion caused by the existing rules applying to
realized gains, we will take pains every quarter to explain the adjustments you need in order to make sense of our
numbers. But televised commentary on earnings releases is often instantaneous with their receipt, and newspaper
headlines almost always focus on the year-over-year change in GAAP net income. Consequently, media reports
sometimes highlight figures that unnecessarily frighten or encourage many readers or viewers.
We will attempt to alleviate this problem by continuing our practice of publishing financial reports late on
Friday, well after the markets close, or early on Saturday morning. That will allow you maximum time for analysis
and give investment professionals the opportunity to deliver informed commentary before markets open on Monday.
Nevertheless, I expect considerable confusion among shareholders for whom accounting is a foreign language.
At Berkshire what counts most are increases in our normalized per-share earning power. That metric is what
Charlie Munger, my long-time partner, and I focus on – and we hope that you do, too. Our scorecard for 2017 follows.
Acquisitions
There are four building blocks that add value to Berkshire: (1) sizable stand-alone acquisitions; (2) bolt-on
acquisitions that fit with businesses we already own; (3) internal sales growth and margin improvement at our many
and varied businesses; and (4) investment earnings from our huge portfolio of stocks and bonds. In this section, we
will review 2017 acquisition activity.
In our search for new stand-alone businesses, the key qualities we seek are durable competitive strengths;
tangible assets required to operate the business;
able and high-grade management; good returns on the net
opportunities for internal growth at attractive returns; and, finally, a sensible purchase price.
That last requirement proved a barrier to virtually all deals we reviewed in 2017, as prices for decent, but far
from spectacular, businesses hit an all-time high. Indeed, price seemed almost irrelevant to an army of optimistic
purchasers.
Why the purchasing frenzy? In part, it’s because the CEO job self-selects for “can-do” types. If Wall Street
analysts or board members urge that brand of CEO to consider possible acquisitions, it’s a bit like telling your ripening
teenager to be sure to have a normal sex life.
Once a CEO hungers for a deal, he or she will never lack for forecasts that justify the purchase. Subordinates
will be cheering, envisioning enlarged domains and the compensation levels that typically increase with corporate
size. Investment bankers, smelling huge fees, will be applauding as well. (Don’t ask the barber whether you need a
haircut.) If the historical performance of the target falls short of validating its acquisition, large “synergies” will be
forecast. Spreadsheets never disappoint.
The ample availability of extraordinarily cheap debt in 2017 further fueled purchase activity. After all, even
a high-priced deal will usually boost per-share earnings if it is debt-financed. At Berkshire, in contrast, we evaluate
acquisitions on an all-equity basis, knowing that our taste for overall debt is very low and that to assign a large portion
of our debt to any individual business would generally be fallacious (leaving aside certain exceptions, such as debt
dedicated to Clayton’s lending portfolio or to the fixed-asset commitments at our regulated utilities). We also never
factor in, nor do we often find, synergies.
Our aversion to leverage has dampened our returns over the years. But Charlie and I sleep well. Both of us
believe it is insane to risk what you have and need in order to obtain what you don’t need. We held this view 50 years
ago when we each ran an investment partnership, funded by a few friends and relatives who trusted us. We also hold
it today after a million or so “partners” have joined us at Berkshire.
4
�
Despite our recent drought of acquisitions, Charlie and I believe that from time to time Berkshire will have
opportunities to make very large purchases. In the meantime, we will stick with our simple guideline: The less the
prudence with which others conduct their affairs, the greater the prudence with which we must conduct our own.
* * * * * * * * * * * *
We were able to make one sensible stand-alone purchase last year, a 38.6% partnership interest in Pilot Flying
J (“PFJ”). With about $20 billion in annual volume, the company is far and away the nation’s leading travel-center
operator.
PFJ has been run from the get-go by the remarkable Haslam family. “Big Jim” Haslam began with a dream
and a gas station 60 years ago. Now his son, Jimmy, manages 27,000 associates at about 750 locations throughout
North America. Berkshire has a contractual agreement to increase its partnership interest in PFJ to 80% in 2023;
Haslam family members will then own the remaining 20%. Berkshire is delighted to be their partner.
When driving on the Interstate, drop in. PFJ sells gasoline as well as diesel fuel, and the food is good. If it’s
been a long day, remember, too, that our properties have 5,200 showers.
* * * * * * * * * * * *
Let’s move now to bolt-on acquisitions. Some of these were small transactions that I will not detail. Here is
an account, however, of a few larger purchases whose closings stretched between late 2016 and early 2018.
Clayton Homes acquired two builders of conventional homes during 2017, a move that more than doubled
Š
our presence in a field we entered only three years ago. With these additions – Oakwood Homes in Colorado and
Harris Doyle in Birmingham – I expect our 2018 site built volume will exceed $1 billion.
Clayton’s emphasis, nonetheless, remains manufactured homes, both their construction and their financing.
In 2017 Clayton sold 19,168 units through its own retail operation and wholesaled another 26,706 units to independent
retailers. All told, Clayton accounted for 49% of the manufactured-home market last year. That industry-leading share
– about three times what our nearest competitor did – is a far cry from the 13% Clayton achieved in 2003, the year it
joined Berkshire.
Both Clayton Homes and PFJ are based in Knoxville, where the Clayton and Haslam families have long been
friends. Kevin Clayton’s comments to the Haslams about the advantages of a Berkshire affiliation, and his admiring
comments about the Haslam family to me, helped cement the PFJ deal.
Near the end of 2016, Shaw Industries, our floor coverings business, acquired U.S. Floors (“USF”), a rapidly
Š
growing distributor of luxury vinyl tile. USF’s managers, Piet Dossche and Philippe Erramuzpe, came out of the gate
fast, delivering a 40% increase in sales in 2017, during which their operation was integrated with Shaw’s. It’s clear
that we acquired both great human assets and business assets in making the USF purchase.
Vance Bell, Shaw’s CEO, originated, negotiated and completed this acquisition, which increased Shaw’s
sales to $5.7 billion in 2017 and its employment to 22,000. With the purchase of USF, Shaw has substantially
strengthened its position as an important and durable source of earnings for Berkshire.
I have told you several times about HomeServices, our growing real estate brokerage operation. Berkshire
Š
backed into this business in 2000 when we acquired a majority interest in MidAmerican Energy (now named Berkshire
Hathaway Energy). MidAmerican’s activities were then largely in the electric utility field, and I originally paid little
attention to HomeServices.
5
�
But, year-by-year, the company added brokers and, by the end of 2016, HomeServices was the second-largest
brokerage operation in the country – still ranking, though, far behind the leader, Realogy. In 2017, however,
HomeServices’ growth exploded. We acquired the industry’s third-largest operator, Long and Foster; number 12,
Houlihan Lawrence; and Gloria Nilson.
With those purchases we added 12,300 agents, raising our total to 40,950. HomeServices is now close to
leading the country in home sales, having participated (including our three acquisitions pro-forma) in $127 billion of
“sides” during 2017. To explain that term, there are two “sides” to every transaction; if we represent both buyer and
seller, the dollar value of the transaction is counted twice.
Despite its recent acquisitions, HomeServices is on track to do only about 3% of the country’s home-
brokerage business in 2018. That leaves 97% to go. Given sensible prices, we will keep adding brokers in this most
fundamental of businesses.
Finally, Precision Castparts, a company built
through acquisitions, bought Wilhelm Schulz GmbH, a
Š
German maker of corrosion resistant fittings, piping systems and components. Please allow me to skip a further
explanation. I don’t understand manufacturing operations as well as I do the activities of real estate brokers, home
builders or truck stops.
Fortunately, I don’t need in this instance to bring knowledge to the table: Mark Donegan, CEO of Precision,
is an extraordinary manufacturing executive, and any business in his domain is slated to do well. Betting on people
can sometimes be more certain than betting on physical assets.
Let’s now move on to operations, beginning with property-casualty (“p/c”) insurance, a business I do
understand and the engine that for 51 years has powered Berkshire’s growth.
Insurance
Before I discuss our 2017 insurance results, let me remind you of how and why we entered the field. We
began by purchasing National Indemnity and a smaller sister company for $8.6 million in early 1967. With our
purchase we received $6.7 million of tangible net worth that, by the nature of the insurance business, we were able to
deploy in marketable securities. It was easy to rearrange the portfolio into securities we would otherwise have owned at
Berkshire itself. In effect, we were “trading dollars” for the net worth portion of the cost.
The $1.9 million premium over net worth that Berkshire paid brought us an insurance business that usually
delivered an underwriting profit. Even more important, the insurance operation carried with it $19.4 million of “float”
– money that belonged to others but was held by our two insurers.
Ever since, float has been of great importance to Berkshire. When we invest these funds, all dividends,
interest and gains from their deployment belong to Berkshire. (If we experience investment losses, those, of course,
are on our tab as well.)
Float materializes at p/c insurers in several ways: (1) Premiums are generally paid to the company upfront
whereas losses occur over the life of the policy, usually a six-month or one-year period; (2) Though some losses, such
as car repairs, are quickly paid, others – such as the harm caused by exposure to asbestos – may take many years to
surface and even longer to evaluate and settle; (3) Loss payments are sometimes spread over decades in cases, say, of
a person employed by one of our workers’ compensation policyholders being permanently injured and thereafter
requiring expensive lifetime care.
6
�
Float generally grows as premium volume increases. Additionally, certain p/c insurers specialize in lines of
business such as medical malpractice or product liability – business labeled “long-tail” in industry jargon – that
generate far more float than, say, auto collision and homeowner policies, which require insurers to almost immediately
make payments to claimants for needed repairs.
Berkshire has been a leader in long-tail business for many years. In particular, we have specialized in jumbo
reinsurance policies that leave us assuming long-tail losses already incurred by other p/c insurers. As a result of our
emphasizing that sort of business, Berkshire’s growth in float has been extraordinary. We are now the country’s second
largest p/c company measured by premium volume and its leader, by far, in float.
Here’s the record:
Year
1970
1980
1990
2000
2010
2017
(in $ millions)
Premium Volume
$
39
185
582
19,343
30,749
60,597
Float
$
39
237
1,632
27,871
65,832
114,500
Our 2017 volume was boosted by a huge deal in which we reinsured up to $20 billion of long-tail losses that
AIG had incurred. Our premium for this policy was $10.2 billion, a world’s record and one we won’t come close to
repeating. Premium volume will therefore fall somewhat in 2018.
Float will probably increase slowly for at least a few years. When we eventually experience a decline, it will
be modest – at most 3% or so in any single year. Unlike bank deposits or life insurance policies containing surrender
options, p/c float can’t be withdrawn. This means that p/c companies can’t experience massive “runs” in times of
widespread financial stress, a characteristic of prime importance to Berkshire that we factor into our investment
decisions.
Charlie and I never will operate Berkshire in a manner that depends on the kindness of strangers – or even
that of friends who may be facing liquidity problems of their own. During the 2008-2009 crisis, we liked having
Treasury Bills – loads of Treasury Bills – that protected us from having to rely on funding sources such as bank lines
or commercial paper. We have intentionally constructed Berkshire in a manner that will allow it to comfortably
withstand economic discontinuities, including such extremes as extended market closures.
* * * * * * * * * * * *
The downside of float is that it comes with risk, sometimes oceans of risk. What looks predictable in insurance
can be anything but. Take the famous Lloyds insurance market, which produced decent results for three centuries. In
the 1980’s, though, huge latent problems from a few long-tail lines of insurance surfaced at Lloyds and, for a time,
threatened to destroy its storied operation. (It has, I should add, fully recovered.)
Berkshire’s insurance managers are conservative and careful underwriters, who operate in a culture that has
long prioritized those qualities. That disciplined behavior has produced underwriting profits in most years, and in such
instances, our cost of float was less than zero. In effect, we got paid then for holding the huge sums tallied in the
earlier table.
I have warned you, however, that we have been fortunate in recent years and that the catastrophe-light period
the industry was experiencing was not a new norm. Last September drove home that point, as three significant
hurricanes hit Texas, Florida and Puerto Rico.
7
�
My guess at this time is that the insured losses arising from the hurricanes are $100 billion or so. That figure,
however, could be far off the mark. The pattern with most mega-catastrophes has been that initial loss estimates ran
low. As well-known analyst V.J. Dowling has pointed out, the loss reserves of an insurer are similar to a self-graded
exam. Ignorance, wishful thinking or, occasionally, downright fraud can deliver inaccurate figures about an insurer’s
financial condition for a very long time.
We currently estimate Berkshire’s losses from the three hurricanes to be $3 billion (or about $2 billion after
tax). If both that estimate and my industry estimate of $100 billion are close to accurate, our share of the industry loss
was about 3%. I believe that percentage is also what we may reasonably expect to be our share of losses in future
American mega-cats.
It’s worth noting that the $2 billion net cost from the three hurricanes reduced Berkshire’s GAAP net worth
by less than 1%. Elsewhere in the reinsurance industry there were many companies that suffered losses in net worth
ranging from 7% to more than 15%. The damage to them could have been far worse: Had Hurricane Irma followed a
path through Florida only a bit to the east, insured losses might well have been an additional $100 billion.
We believe that the annual probability of a U.S. mega-catastrophe causing $400 billion or more of insured
losses is about 2%. No one, of course, knows the correct probability. We do know, however, that the risk increases
over time because of growth in both the number and value of structures located in catastrophe-vulnerable areas.
No company comes close to Berkshire in being financially prepared for a $400 billion mega-cat. Our share
of such a loss might be $12 billion or so, an amount far below the annual earnings we expect from our non-insurance
activities. Concurrently, much – indeed, perhaps most – of the p/c world would be out of business. Our unparalleled
financial strength explains why other p/c insurers come to Berkshire – and only Berkshire – when they, themselves,
need to purchase huge reinsurance coverages for large payments they may have to make in the far future.
Prior to 2017, Berkshire had recorded 14 consecutive years of underwriting profits, which totaled $28.3
billion pre-tax. I have regularly told you that I expect Berkshire to attain an underwriting profit in a majority of years,
but also to experience losses from time to time. My warning became fact in 2017, as we lost $3.2 billion pre-tax from
underwriting.
A large amount of additional information about our various insurance operations is included in the 10-K at
the back of this report. The only point I will add here is that you have some extraordinary managers working for you
at our various p/c operations. This is a business in which there are no trade secrets, patents, or locational advantages.
What counts are brains and capital. The managers of our various insurance companies supply the brains and Berkshire
provides the capital.
* * * * * * * * * * * *
For many years, this letter has described the activities of Berkshire’s many other businesses. That discussion
has become both repetitious and partially duplicative of information regularly included in the 10-K that follows the
letter. Consequently, this year I will give you a simple summary of our dozens of non-insurance businesses. Additional
details can be found on pages K-5 – K-22 and pages K-40 – K-50.
Viewed as a group – and excluding investment income – our operations other than insurance delivered pre-
tax income of $20 billion in 2017, an increase of $950 million over 2016. About 44% of the 2017 profit came from two
subsidiaries. BNSF, our railroad, and Berkshire Hathaway Energy (of which we own 90.2%). You can read more
about these businesses on pages K-5 – K-10 and pages K-40 – K-44.
Proceeding down Berkshire’s long list of subsidiaries, our next five non-insurance businesses, as ranked by
earnings (but presented here alphabetically) Clayton Homes, International Metalworking Companies, Lubrizol,
Marmon and Precision Castparts had aggregate pre-tax income in 2017 of $5.5 billion, little changed from the $5.4
billion these companies earned in 2016.
The next five, similarly ranked and listed (Forest River, Johns Manville, MiTek, Shaw and TTI) earned $2.1
billion last year, up from $1.7 billion in 2016.
8
�
The remaining businesses that Berkshire owns – and there are many – recorded little change in pre-tax
income, which was $3.7 billion in 2017 versus $3.5 billion in 2016.
Depreciation charges for all of these non-insurance operations totaled $7.6 billion; capital expenditures were
$11.5 billion. Berkshire is always looking for ways to expand its businesses and regularly incurs capital expenditures
that far exceed its depreciation charge. Almost 90% of our investments are made in the United States. America’s
economic soil remains fertile.
Amortization charges were an additional $1.3 billion. I believe that in large part this item is not a true
economic cost. Partially offsetting this good news is the fact that BNSF (like all other railroads) records depreciation
charges that fall well short of the sums regularly needed to keep the railroad in first-class shape.
Berkshire’s goal is to substantially increase the earnings of its non-insurance group. For that to happen, we
will need to make one or more huge acquisitions. We certainly have the resources to do so. At yearend Berkshire held
$116.0 billion in cash and U.S. Treasury Bills (whose average maturity was 88 days), up from $86.4 billion at yearend
2016. This extraordinary liquidity earns only a pittance and is far beyond the level Charlie and I wish Berkshire to
have. Our smiles will broaden when we have redeployed Berkshire’s excess funds into more productive assets.
Investments
Below we list our fifteen common stock investments that at yearend had the largest market value. We exclude
our Kraft Heinz holding – 325,442,152 shares – because Berkshire is part of a control group and therefore must
account for this investment on the “equity” method. On its balance sheet, Berkshire carries its Kraft Heinz holding at
a GAAP figure of $17.6 billion. The shares had a yearend market value of $25.3 billion, and a cost basis of $9.8 billion.
Shares*
Company
Percentage of
Company
Owned
12/31/17
Cost**
Market
(in millions)
6,789,054 Charter Communications, Inc.
151,610,700 American Express Company . . . . . . . . . . . . . . . . . .
166,713,209 Apple Inc. . . . . . . . . . . . . . . . . . . . . . . . . . . . . . . . . .
700,000,000 Bank of America Corporation . . . . . . . . . . . . . . . . .
53,307,534 The Bank of New York Mellon Corporation . . . . . .
225,000,000 BYD Company Ltd.
. . . . . . . . . . . . . . . . . . . . . . . . .
. . . . . . . . . . . . . . . . .
400,000,000 The Coca-Cola Company . . . . . . . . . . . . . . . . . . . . .
53,110,395 Delta Airlines Inc.
. . . . . . . . . . . . . . . . . . . . . . . . . .
44,527,147 General Motors Company . . . . . . . . . . . . . . . . . . . .
11,390,582 The Goldman Sachs Group, Inc.
. . . . . . . . . . . . . . .
24,669,778 Moody’s Corporation . . . . . . . . . . . . . . . . . . . . . . . .
74,587,892 Phillips 66 . . . . . . . . . . . . . . . . . . . . . . . . . . . . . . . . .
47,659,456 Southwest Airlines Co. . . . . . . . . . . . . . . . . . . . . . . .
103,855,045 U.S. Bancorp . . . . . . . . . . . . . . . . . . . . . . . . . . . . . .
482,544,468 Wells Fargo & Company . . . . . . . . . . . . . . . . . . . . .
Others . . . . . . . . . . . . . . . . . . . . . . . . . . . . . . . . . . . .
Total Common Stocks Carried at Market . . . . . . . . .
17.6
3.3
6.8
5.3
8.2
2.8
9.4
7.4
3.2
3.0
12.9
14.9
8.1
6.3
9.9
$
1,287
20,961
5,007
2,230
232
1,210
1,299
2,219
1,343
654
248
5,841
1,997
3,343
11,837
14,968
$ 74,676
$
15,056
28,213
20,664
2,871
1,961
2,281
18,352
2,974
1,825
2,902
3,642
7,545
3,119
5,565
29,276
24,294
$ 170,540
*
**
Excludes shares held by pension funds of Berkshire subsidiaries.
This is our actual purchase price and also our tax basis; GAAP “cost” differs in a few cases because of
write-downs that have been required under GAAP rules.
9
�


 2025年软考高级信息系统项目管理师金色考点
 软考高项三色笔记
 镇安县双鑫矿业月河年处理15万吨尾渣综合加工利用项目水土保持报告表
  红杉资本:生成式AI最新市场格局.pdf
 wireshark 使用教程.pdf
 【2021年-贝佐斯致股东的信】.pdf
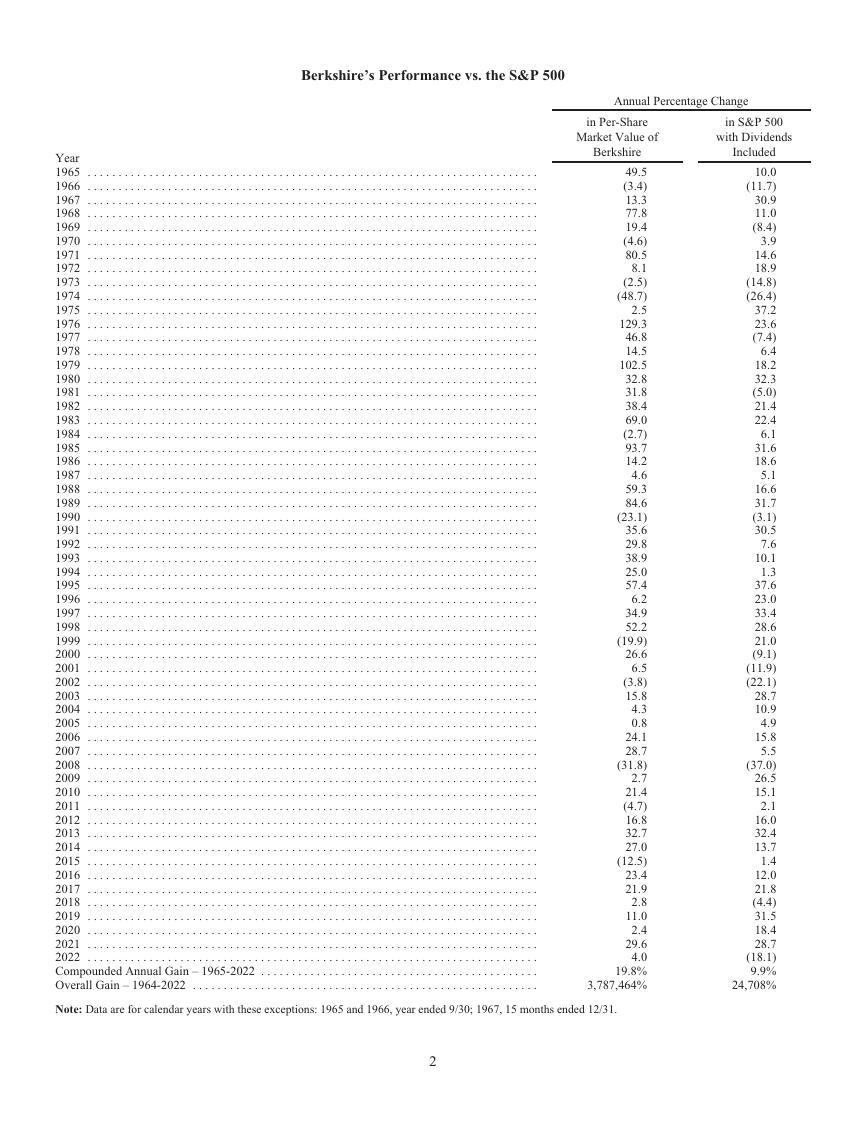 巴菲特致股东的公开信 - 2022.pdf
 MySQL 8.1 参考手册.pdf
 世界银行报告下载:激进政策缩紧浪潮不足遏制通胀 全球经济衰退迫在眉睫(Is a Global Recession Imminent?).pdf
 红杉资本报告:适应与忍耐(Adapting to Endure).pdf
 高保真音响系统设计制作-毕业论文.doc
 一种自适应互补滤波姿态估计算法.pdf