To the Shareholders of Berkshire Hathaway Inc.:
Operating earnings improved to $41.9 million in 1980 from
$36.0 million in 1979, but return on beginning equity capital
(with securities valued at cost) fell to 17.8% from 18.6%. We
believe the latter yardstick to be the most appropriate measure
of single-year managerial economic performance. Informed use of
that yardstick, however, requires an understanding of many
factors, including accounting policies, historical carrying
values of assets, financial leverage, and industry conditions.
In your evaluation of our economic performance, we suggest
that two factors should receive your special attention - one of a
positive nature peculiar, to a large extent, to our own
operation, and one of a negative nature applicable to corporate
performance generally. Let’s look at the bright side first.
Non-Controlled Ownership Earnings
When one company owns part of another company, appropriate
accounting procedures pertaining to that ownership interest must
be selected from one of three major categories. The percentage
of voting stock that is owned, in large part, determines which
category of accounting principles should be utilized.
Generally accepted accounting principles require (subject to
exceptions, naturally, as with our former bank subsidiary) full
consolidation of sales, expenses, taxes, and earnings of business
holdings more than 50% owned. Blue Chip Stamps, 60% owned by
Berkshire Hathaway Inc., falls into this category. Therefore,
all Blue Chip income and expense items are included in full in
Berkshire’s Consolidated Statement of Earnings, with the 40%
ownership interest of others in Blue Chip’s net earnings
reflected in the Statement as a deduction for “minority
interest”.
Full inclusion of underlying earnings from another class of
holdings, companies owned 20% to 50% (usually called
“investees”), also normally occurs. Earnings from such companies
- for example, Wesco Financial, controlled by Berkshire but only
48% owned - are included via a one-line entry in the owner’s
Statement of Earnings. Unlike the over-50% category, all items
of revenue and expense are omitted; just the proportional share
of net income is included. Thus, if Corporation A owns one-third
of Corporation B, one-third of B’s earnings, whether or not
distributed by B, will end up in A’s earnings. There are some
modifications, both in this and the over-50% category, for
intercorporate taxes and purchase price adjustments, the
explanation of which we will save for a later day. (We know you
can hardly wait.)
Finally come holdings representing less than 20% ownership
of another corporation’s voting securities. In these cases,
accounting rules dictate that the owning companies include in
their earnings only dividends received from such holdings.
Undistributed earnings are ignored. Thus, should we own 10% of
Corporation X with earnings of $10 million in 1980, we would
report in our earnings (ignoring relatively minor taxes on
intercorporate dividends) either (a) $1 million if X declared the
full $10 million in dividends; (b) $500,000 if X paid out 50%, or
$5 million, in dividends; or (c) zero if X reinvested all
earnings.
We impose this short - and over-simplified - course in
accounting upon you because Berkshire’s concentration of
B
E
R
K
S
H
I
R
E
H
A
T
H
A
W
A
Y
I
N
C
.
�
resources in the insurance field produces a corresponding
concentration of its assets in companies in that third (less than
20% owned) category. Many of these companies pay out relatively
small proportions of their earnings in dividends. This means
that only a small proportion of their current earning power is
recorded in our own current operating earnings. But, while our
reported operating earnings reflect only the dividends received
from such companies, our economic well-being is determined by
their earnings, not their dividends.
Our holdings in this third category of companies have
increased dramatically in recent years as our insurance business
has prospered and as securities markets have presented
particularly attractive opportunities in the common stock area.
The large increase in such holdings, plus the growth of earnings
experienced by those partially-owned companies, has produced an
unusual result; the part of “our” earnings that these companies
retained last year (the part not paid to us in dividends)
exceeded the total reported annual operating earnings of
Berkshire Hathaway. Thus, conventional accounting only allows
less than half of our earnings “iceberg” to appear above the
surface, in plain view. Within the corporate world such a result
is quite rare; in our case it is likely to be recurring.
Our own analysis of earnings reality differs somewhat from
generally accepted accounting principles, particularly when those
principles must be applied in a world of high and uncertain rates
of inflation. (But it’s much easier to criticize than to improve
such accounting rules. The inherent problems are monumental.) We
have owned 100% of businesses whose reported earnings were not
worth close to 100 cents on the dollar to us even though, in an
accounting sense, we totally controlled their disposition. (The
“control” was theoretical. Unless we reinvested all earnings,
massive deterioration in the value of assets already in place
would occur. But those reinvested earnings had no prospect of
earning anything close to a market return on capital.) We have
also owned small fractions of businesses with extraordinary
reinvestment possibilities whose retained earnings had an
economic value to us far in excess of 100 cents on the dollar.
The value to Berkshire Hathaway of retained earnings is not
determined by whether we own 100%, 50%, 20% or 1% of the
businesses in which they reside. Rather, the value of those
retained earnings is determined by the use to which they are put
and the subsequent level of earnings produced by that usage.
This is true whether we determine the usage, or whether managers
we did not hire - but did elect to join - determine that usage.
(It’s the act that counts, not the actors.) And the value is in
no way affected by the inclusion or non-inclusion of those
retained earnings in our own reported operating earnings. If a
tree grows in a forest partially owned by us, but we don’t record
the growth in our financial statements, we still own part of the
tree.
Our view, we warn you, is non-conventional. But we would
rather have earnings for which we did not get accounting credit
put to good use in a 10%-owned company by a management we did not
personally hire, than have earnings for which we did get credit
put into projects of more dubious potential by another management
- even if we are that management.
(We can’t resist pausing here for a short commercial. One
usage of retained earnings we often greet with special enthusiasm
when practiced by companies in which we have an investment
interest is repurchase of their own shares. The reasoning is
simple: if a fine business is selling in the market place for far
less than intrinsic value, what more certain or more profitable
utilization of capital can there be than significant enlargement
of the interests of all owners at that bargain price? The
�
competitive nature of corporate acquisition activity almost
guarantees the payment of a full - frequently more than full
price when a company buys the entire ownership of another
enterprise. But the auction nature of security markets often
allows finely-run companies the opportunity to purchase portions
of their own businesses at a price under 50% of that needed to
acquire the same earning power through the negotiated acquisition
of another enterprise.)
Long-Term Corporate Results
As we have noted, we evaluate single-year corporate
performance by comparing operating earnings to shareholders’
equity with securities valued at cost. Our long-term yardstick
of performance, however, includes all capital gains or losses,
realized or unrealized. We continue to achieve a long-term
return on equity that considerably exceeds the average of our
yearly returns. The major factor causing this pleasant result is
a simple one: the retained earnings of those non-controlled
holdings we discussed earlier have been translated into gains in
market value.
Of course, this translation of retained earnings into market
price appreciation is highly uneven (it goes in reverse some
years), unpredictable as to timing, and unlikely to materialize
on a precise dollar-for-dollar basis. And a silly purchase price
for a block of stock in a corporation can negate the effects of a
decade of earnings retention by that corporation. But when
purchase prices are sensible, some long-term market recognition
of the accumulation of retained earnings almost certainly will
occur. Periodically you even will receive some frosting on the
cake, with market appreciation far exceeding post-purchase
retained earnings.
In the sixteen years since present management assumed
responsibility for Berkshire, book value per share with
insurance-held equities valued at market has increased from
$19.46 to $400.80, or 20.5% compounded annually. (You’ve done
better: the value of the mineral content in the human body
compounded at 22% annually during the past decade.) It is
encouraging, moreover, to realize that our record was achieved
despite many mistakes. The list is too painful and lengthy to
detail here. But it clearly shows that a reasonably competitive
corporate batting average can be achieved in spite of a lot of
managerial strikeouts.
Our insurance companies will continue to make large
investments in well-run, favorably-situated, non-controlled
companies that very often will pay out in dividends only small
proportions of their earnings. Following this policy, we would
expect our long-term returns to continue to exceed the returns
derived annually from reported operating earnings. Our
confidence in this belief can easily be quantified: if we were to
sell the equities that we hold and replace them with long-term
tax-free bonds, our reported operating earnings would rise
immediately by over $30 million annually. Such a shift tempts us
not at all.
So much for the good news.
Results for Owners
Unfortunately, earnings reported in corporate financial
statements are no longer the dominant variable that determines
whether there are any real earnings for you, the owner. For only
gains in purchasing power represent real earnings on investment.
If you (a) forego ten hamburgers to purchase an investment; (b)
receive dividends which, after tax, buy two hamburgers; and (c)
receive, upon sale of your holdings, after-tax proceeds that will
�
buy eight hamburgers, then (d) you have had no real income from
your investment, no matter how much it appreciated in dollars.
You may feel richer, but you won’t eat richer.
High rates of inflation create a tax on capital that makes
much corporate investment unwise - at least if measured by the
criterion of a positive real investment return to owners. This
“hurdle rate” the return on equity that must be achieved by a
corporation in order to produce any real return for its
individual owners - has increased dramatically in recent years.
The average tax-paying investor is now running up a down
escalator whose pace has accelerated to the point where his
upward progress is nil.
For example, in a world of 12% inflation a business earning
20% on equity (which very few manage consistently to do) and
distributing it all to individuals in the 50% bracket is chewing
up their real capital, not enhancing it. (Half of the 20% will go
for income tax; the remaining 10% leaves the owners of the
business with only 98% of the purchasing power they possessed at
the start of the year - even though they have not spent a penny
of their “earnings”). The investors in this bracket would
actually be better off with a combination of stable prices and
corporate earnings on equity capital of only a few per cent.
Explicit income taxes alone, unaccompanied by any implicit
inflation tax, never can turn a positive corporate return into a
negative owner return. (Even if there were 90% personal income
tax rates on both dividends and capital gains, some real income
would be left for the owner at a zero inflation rate.) But the
inflation tax is not limited by reported income. Inflation rates
not far from those recently experienced can turn the level of
positive returns achieved by a majority of corporations into
negative returns for all owners, including those not required to
pay explicit taxes. (For example, if inflation reached 16%,
owners of the 60% plus of corporate America earning less than
this rate of return would be realizing a negative real return -
even if income taxes on dividends and capital gains were
eliminated.)
Of course, the two forms of taxation co-exist and interact
since explicit taxes are levied on nominal, not real, income.
Thus you pay income taxes on what would be deficits if returns to
stockholders were measured in constant dollars.
At present inflation rates, we believe individual owners in
medium or high tax brackets (as distinguished from tax-free
entities such as pension funds, eleemosynary institutions, etc.)
should expect no real long-term return from the average American
corporation, even though these individuals reinvest the entire
after-tax proceeds from all dividends they receive. The average
return on equity of corporations is fully offset by the
combination of the implicit tax on capital levied by inflation
and the explicit taxes levied both on dividends and gains in
value produced by retained earnings.
As we said last year, Berkshire has no corporate solution to
the problem. (We’ll say it again next year, too.) Inflation does
not improve our return on equity.
Indexing is the insulation that all seek against inflation.
But the great bulk (although there are important exceptions) of
corporate capital is not even partially indexed. Of course,
earnings and dividends per share usually will rise if significant
earnings are “saved” by a corporation; i.e., reinvested instead
of paid as dividends. But that would be true without inflation.
A thrifty wage earner, likewise, could achieve regular annual
increases in his total income without ever getting a pay increase
- if he were willing to take only half of his paycheck in cash
�
(his wage “dividend”) and consistently add the other half (his
“retained earnings”) to a savings account. Neither this high-
saving wage earner nor the stockholder in a high-saving
corporation whose annual dividend rate increases while its rate
of return on equity remains flat is truly indexed.
For capital to be truly indexed, return on equity must rise,
i.e., business earnings consistently must increase in proportion
to the increase in the price level without any need for the
business to add to capital - including working capital -
employed. (Increased earnings produced by increased investment
don’t count.) Only a few businesses come close to exhibiting this
ability. And Berkshire Hathaway isn’t one of them.
We, of course, have a corporate policy of reinvesting
earnings for growth, diversity and strength, which has the
incidental effect of minimizing the current imposition of
explicit taxes on our owners. However, on a day-by-day basis,
you will be subjected to the implicit inflation tax, and when you
wish to transfer your investment in Berkshire into another form
of investment, or into consumption, you also will face explicit
taxes.
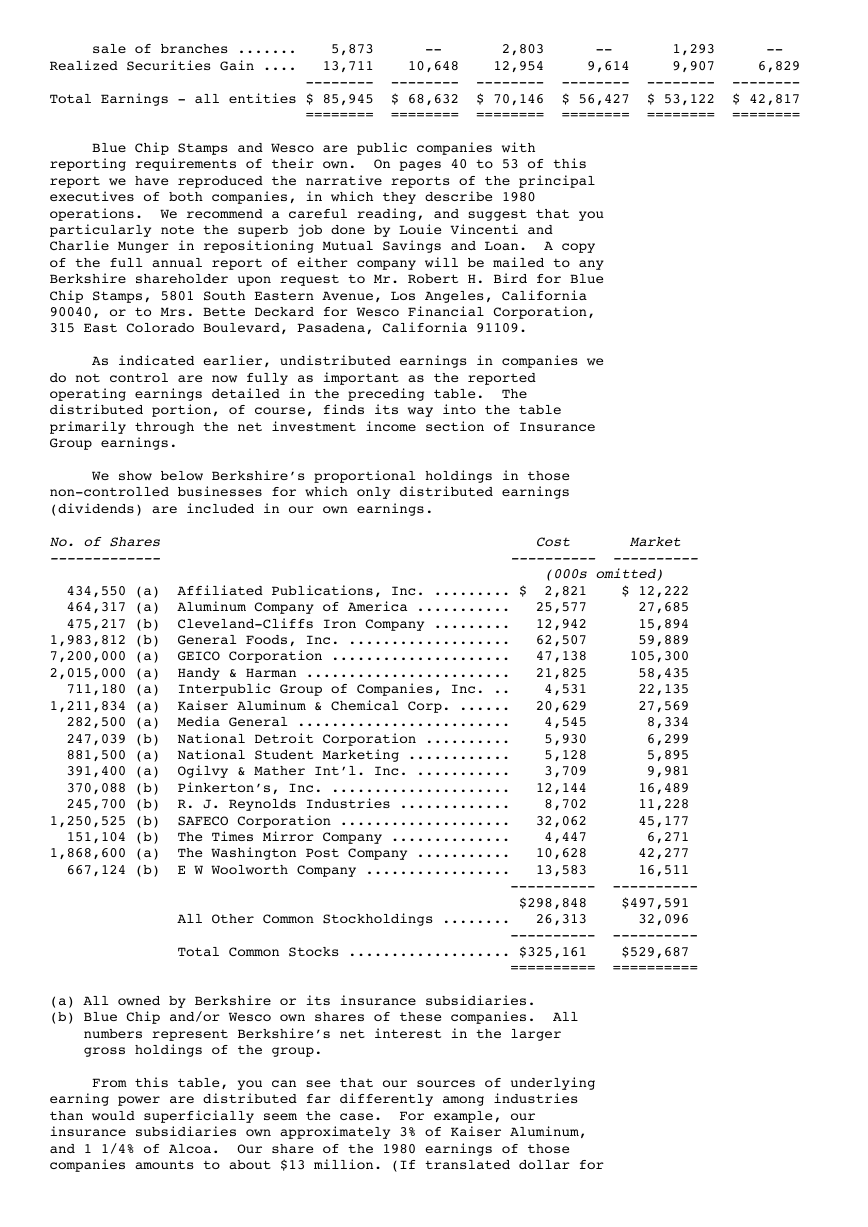
Sources of Earnings
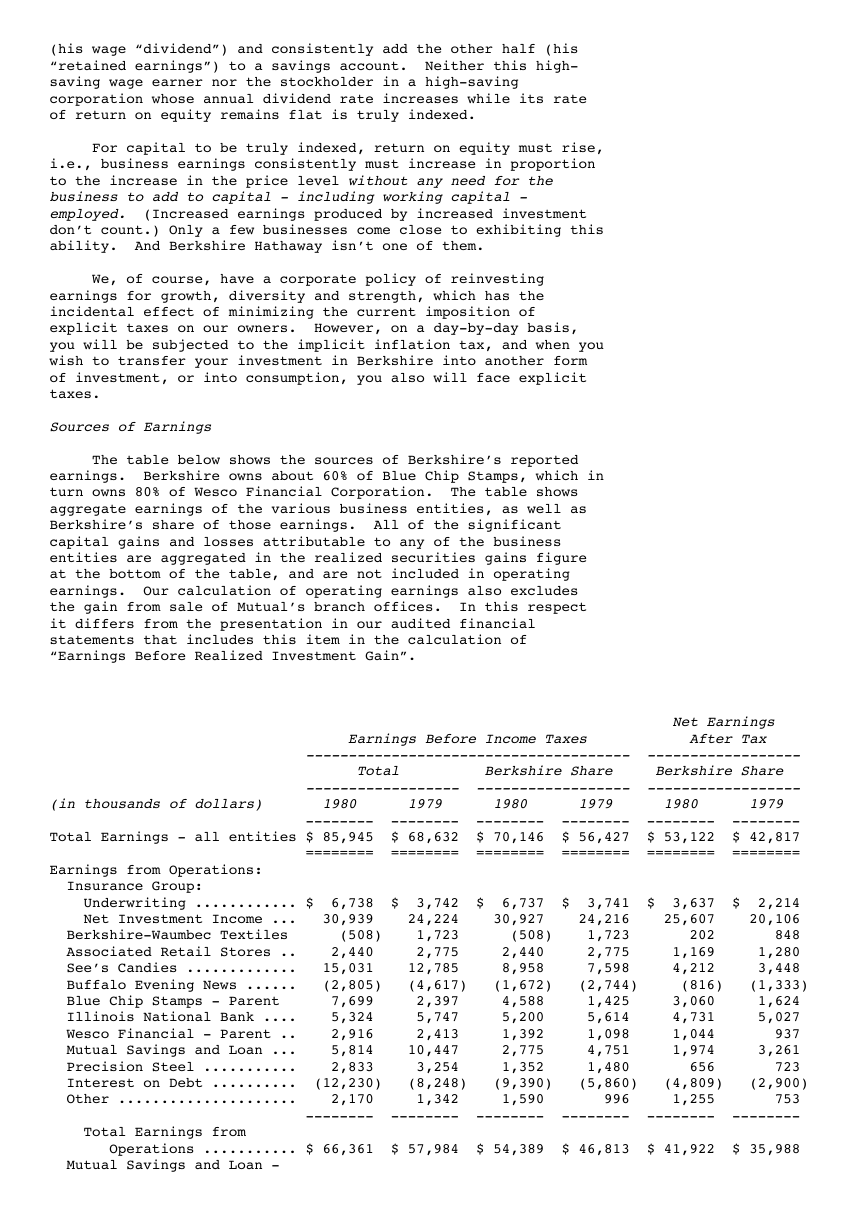
The table below shows the sources of Berkshire’s reported
earnings. Berkshire owns about 60% of Blue Chip Stamps, which in
turn owns 80% of Wesco Financial Corporation. The table shows
aggregate earnings of the various business entities, as well as
Berkshire’s share of those earnings. All of the significant
capital gains and losses attributable to any of the business
entities are aggregated in the realized securities gains figure
at the bottom of the table, and are not included in operating
earnings. Our calculation of operating earnings also excludes
the gain from sale of Mutual’s branch offices. In this respect
it differs from the presentation in our audited financial
statements that includes this item in the calculation of
“Earnings Before Realized Investment Gain”.
Net Earnings
Earnings Before Income Taxes After Tax
-------------------------------------- ------------------
Total Berkshire Share Berkshire Share
------------------ ------------------ ------------------
(in thousands of dollars) 1980 1979 1980 1979 1980 1979
-------- -------- -------- -------- -------- --------
Total Earnings - all entities $ 85,945 $ 68,632 $ 70,146 $ 56,427 $ 53,122 $ 42,817
======== ======== ======== ======== ======== ========
Earnings from Operations:
Insurance Group:
Underwriting ............ $ 6,738 $ 3,742 $ 6,737 $ 3,741 $ 3,637 $ 2,214
Net Investment Income ... 30,939 24,224 30,927 24,216 25,607 20,106
Berkshire-Waumbec Textiles (508) 1,723 (508) 1,723 202 848
Associated Retail Stores .. 2,440 2,775 2,440 2,775 1,169 1,280
See’s Candies ............. 15,031 12,785 8,958 7,598 4,212 3,448
Buffalo Evening News ...... (2,805) (4,617) (1,672) (2,744) (816) (1,333)
Blue Chip Stamps - Parent 7,699 2,397 4,588 1,425 3,060 1,624
Illinois National Bank .... 5,324 5,747 5,200 5,614 4,731 5,027
Wesco Financial - Parent .. 2,916 2,413 1,392 1,098 1,044 937
Mutual Savings and Loan ... 5,814 10,447 2,775 4,751 1,974 3,261
Precision Steel ........... 2,833 3,254 1,352 1,480 656 723
Interest on Debt .......... (12,230) (8,248) (9,390) (5,860) (4,809) (2,900)
Other ..................... 2,170 1,342 1,590 996 1,255 753
-------- -------- -------- -------- -------- --------
Total Earnings from
Operations ........... $ 66,361 $ 57,984 $ 54,389 $ 46,813 $ 41,922 $ 35,988
Mutual Savings and Loan -
�
sale of branches ....... 5,873 -- 2,803 -- 1,293 --
Realized Securities Gain .... 13,711 10,648 12,954 9,614 9,907 6,829
-------- -------- -------- -------- -------- --------
Total Earnings - all entities $ 85,945 $ 68,632 $ 70,146 $ 56,427 $ 53,122 $ 42,817
======== ======== ======== ======== ======== ========
Blue Chip Stamps and Wesco are public companies with
reporting requirements of their own. On pages 40 to 53 of this
report we have reproduced the narrative reports of the principal
executives of both companies, in which they describe 1980
operations. We recommend a careful reading, and suggest that you
particularly note the superb job done by Louie Vincenti and
Charlie Munger in repositioning Mutual Savings and Loan. A copy
of the full annual report of either company will be mailed to any
Berkshire shareholder upon request to Mr. Robert H. Bird for Blue
Chip Stamps, 5801 South Eastern Avenue, Los Angeles, California
90040, or to Mrs. Bette Deckard for Wesco Financial Corporation,
315 East Colorado Boulevard, Pasadena, California 91109.
As indicated earlier, undistributed earnings in companies we
do not control are now fully as important as the reported
operating earnings detailed in the preceding table. The
distributed portion, of course, finds its way into the table
primarily through the net investment income section of Insurance
Group earnings.
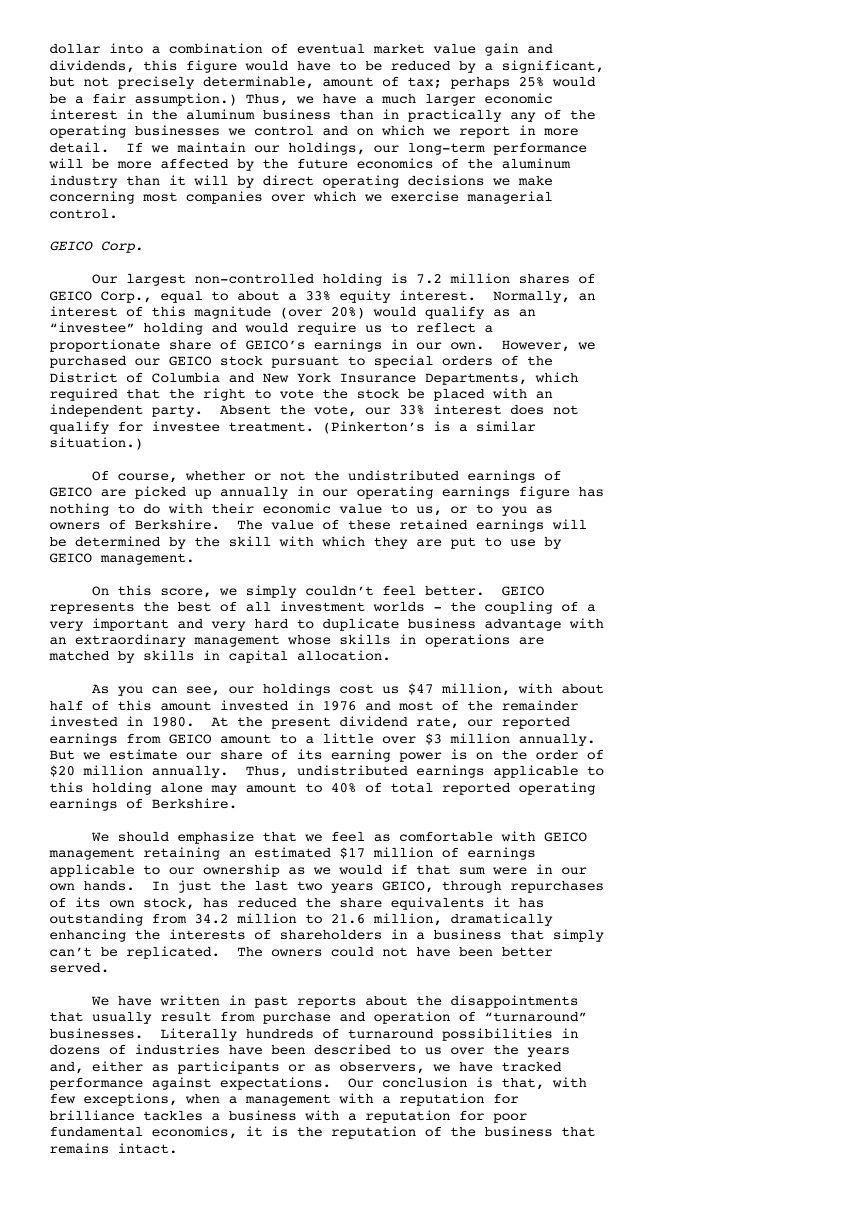
We show below Berkshire’s proportional holdings in those
non-controlled businesses for which only distributed earnings
(dividends) are included in our own earnings.
No. of Shares Cost Market
------------- ---------- ----------
(000s omitted)
434,550 (a) Affiliated Publications, Inc. ......... $ 2,821 $ 12,222
464,317 (a) Aluminum Company of America ........... 25,577 27,685
475,217 (b) Cleveland-Cliffs Iron Company ......... 12,942 15,894
1,983,812 (b) General Foods, Inc. ................... 62,507 59,889
7,200,000 (a) GEICO Corporation ..................... 47,138 105,300
2,015,000 (a) Handy & Harman ........................ 21,825 58,435
711,180 (a) Interpublic Group of Companies, Inc. .. 4,531 22,135
1,211,834 (a) Kaiser Aluminum & Chemical Corp. ...... 20,629 27,569
282,500 (a) Media General ......................... 4,545 8,334
247,039 (b) National Detroit Corporation .......... 5,930 6,299
881,500 (a) National Student Marketing ............ 5,128 5,895
391,400 (a) Ogilvy & Mather Int’l. Inc. ........... 3,709 9,981
370,088 (b) Pinkerton’s, Inc. ..................... 12,144 16,489
245,700 (b) R. J. Reynolds Industries ............. 8,702 11,228
1,250,525 (b) SAFECO Corporation .................... 32,062 45,177
151,104 (b) The Times Mirror Company .............. 4,447 6,271
1,868,600 (a) The Washington Post Company ........... 10,628 42,277
667,124 (b) E W Woolworth Company ................. 13,583 16,511
---------- ----------
$298,848 $497,591
All Other Common Stockholdings ........ 26,313 32,096
---------- ----------
Total Common Stocks ................... $325,161 $529,687
========== ==========
(a) All owned by Berkshire or its insurance subsidiaries.
(b) Blue Chip and/or Wesco own shares of these companies. All
numbers represent Berkshire’s net interest in the larger
gross holdings of the group.
From this table, you can see that our sources of underlying
earning power are distributed far differently among industries
than would superficially seem the case. For example, our
insurance subsidiaries own approximately 3% of Kaiser Aluminum,
and 1 1/4% of Alcoa. Our share of the 1980 earnings of those
companies amounts to about $13 million. (If translated dollar for
�
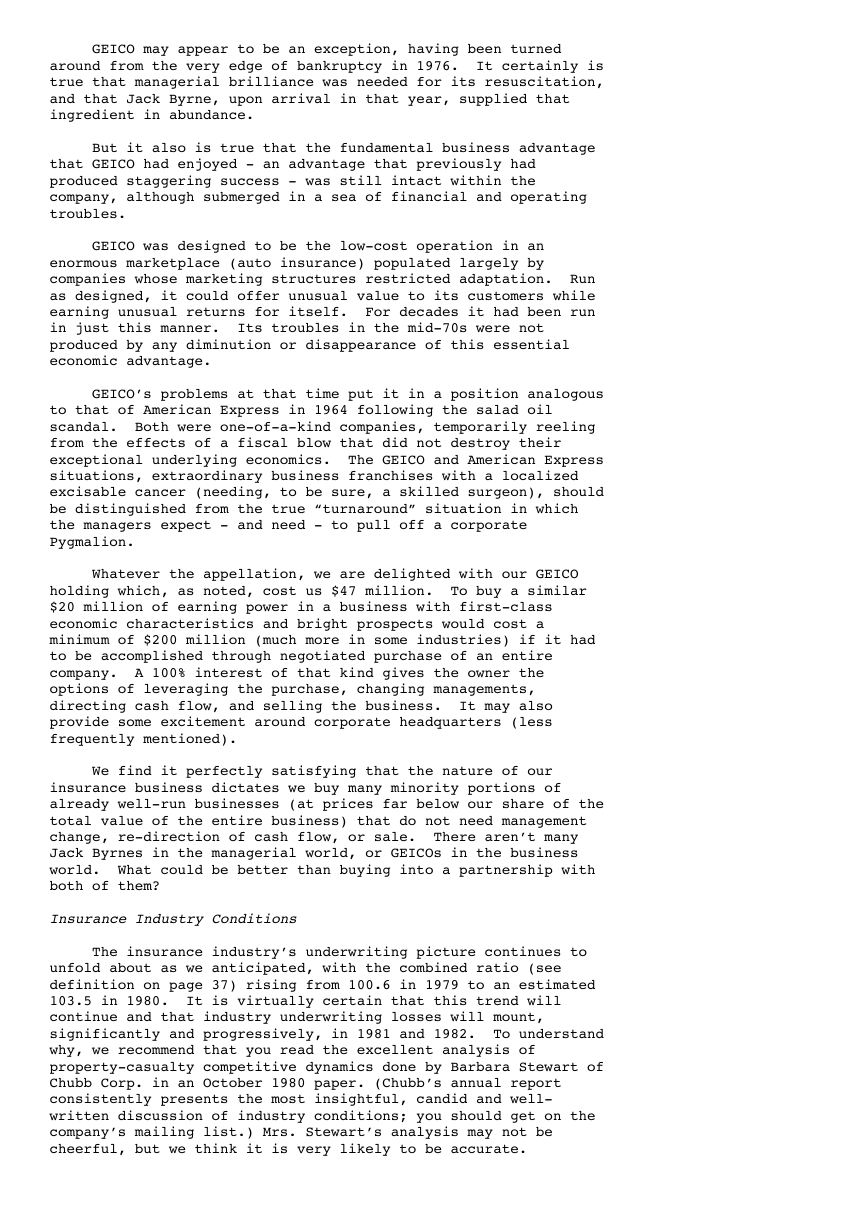
dollar into a combination of eventual market value gain and
dividends, this figure would have to be reduced by a significant,
but not precisely determinable, amount of tax; perhaps 25% would
be a fair assumption.) Thus, we have a much larger economic
interest in the aluminum business than in practically any of the
operating businesses we control and on which we report in more
detail. If we maintain our holdings, our long-term performance
will be more affected by the future economics of the aluminum
industry than it will by direct operating decisions we make
concerning most companies over which we exercise managerial
control.
GEICO Corp.
Our largest non-controlled holding is 7.2 million shares of
GEICO Corp., equal to about a 33% equity interest. Normally, an
interest of this magnitude (over 20%) would qualify as an
“investee” holding and would require us to reflect a
proportionate share of GEICO’s earnings in our own. However, we
purchased our GEICO stock pursuant to special orders of the
District of Columbia and New York Insurance Departments, which
required that the right to vote the stock be placed with an
independent party. Absent the vote, our 33% interest does not
qualify for investee treatment. (Pinkerton’s is a similar
situation.)
Of course, whether or not the undistributed earnings of
GEICO are picked up annually in our operating earnings figure has
nothing to do with their economic value to us, or to you as
owners of Berkshire. The value of these retained earnings will
be determined by the skill with which they are put to use by
GEICO management.
On this score, we simply couldn’t feel better. GEICO
represents the best of all investment worlds - the coupling of a
very important and very hard to duplicate business advantage with
an extraordinary management whose skills in operations are
matched by skills in capital allocation.
As you can see, our holdings cost us $47 million, with about
half of this amount invested in 1976 and most of the remainder
invested in 1980. At the present dividend rate, our reported
earnings from GEICO amount to a little over $3 million annually.
But we estimate our share of its earning power is on the order of
$20 million annually. Thus, undistributed earnings applicable to
this holding alone may amount to 40% of total reported operating
earnings of Berkshire.
We should emphasize that we feel as comfortable with GEICO
management retaining an estimated $17 million of earnings
applicable to our ownership as we would if that sum were in our
own hands. In just the last two years GEICO, through repurchases
of its own stock, has reduced the share equivalents it has
outstanding from 34.2 million to 21.6 million, dramatically
enhancing the interests of shareholders in a business that simply
can’t be replicated. The owners could not have been better
served.
We have written in past reports about the disappointments
that usually result from purchase and operation of “turnaround”
businesses. Literally hundreds of turnaround possibilities in
dozens of industries have been described to us over the years
and, either as participants or as observers, we have tracked
performance against expectations. Our conclusion is that, with
few exceptions, when a management with a reputation for
brilliance tackles a business with a reputation for poor
fundamental economics, it is the reputation of the business that
remains intact.
�
GEICO may appear to be an exception, having been turned
around from the very edge of bankruptcy in 1976. It certainly is
true that managerial brilliance was needed for its resuscitation,
and that Jack Byrne, upon arrival in that year, supplied that
ingredient in abundance.
But it also is true that the fundamental business advantage
that GEICO had enjoyed - an advantage that previously had
produced staggering success - was still intact within the
company, although submerged in a sea of financial and operating
troubles.
GEICO was designed to be the low-cost operation in an
enormous marketplace (auto insurance) populated largely by
companies whose marketing structures restricted adaptation. Run
as designed, it could offer unusual value to its customers while
earning unusual returns for itself. For decades it had been run
in just this manner. Its troubles in the mid-70s were not
produced by any diminution or disappearance of this essential
economic advantage.
GEICO’s problems at that time put it in a position analogous
to that of American Express in 1964 following the salad oil
scandal. Both were one-of-a-kind companies, temporarily reeling
from the effects of a fiscal blow that did not destroy their
exceptional underlying economics. The GEICO and American Express
situations, extraordinary business franchises with a localized
excisable cancer (needing, to be sure, a skilled surgeon), should
be distinguished from the true “turnaround” situation in which
the managers expect - and need - to pull off a corporate
Pygmalion.
Whatever the appellation, we are delighted with our GEICO
holding which, as noted, cost us $47 million. To buy a similar
$20 million of earning power in a business with first-class
economic characteristics and bright prospects would cost a
minimum of $200 million (much more in some industries) if it had
to be accomplished through negotiated purchase of an entire
company. A 100% interest of that kind gives the owner the
options of leveraging the purchase, changing managements,
directing cash flow, and selling the business. It may also
provide some excitement around corporate headquarters (less
frequently mentioned).
We find it perfectly satisfying that the nature of our
insurance business dictates we buy many minority portions of
already well-run businesses (at prices far below our share of the
total value of the entire business) that do not need management
change, re-direction of cash flow, or sale. There aren’t many
Jack Byrnes in the managerial world, or GEICOs in the business
world. What could be better than buying into a partnership with
both of them?
Insurance Industry Conditions
The insurance industry’s underwriting picture continues to
unfold about as we anticipated, with the combined ratio (see
definition on page 37) rising from 100.6 in 1979 to an estimated
103.5 in 1980. It is virtually certain that this trend will
continue and that industry underwriting losses will mount,
significantly and progressively, in 1981 and 1982. To understand
why, we recommend that you read the excellent analysis of
property-casualty competitive dynamics done by Barbara Stewart of
Chubb Corp. in an October 1980 paper. (Chubb’s annual report
consistently presents the most insightful, candid and well-
written discussion of industry conditions; you should get on the
company’s mailing list.) Mrs. Stewart’s analysis may not be
cheerful, but we think it is very likely to be accurate.
�

