To the Shareholders of Berkshire Hathaway Inc.:
Again, we must lead off with a few words about accounting.
Since our last annual report, the accounting profession has
decided that equity securities owned by insurance companies must
be carried on the balance sheet at market value. We previously
have carried such equity securities at the lower of aggregate
cost or aggregate market value. Because we have large unrealized
gains in our insurance equity holdings, the result of this new
policy is to increase substantially both the 1978 and 1979
yearend net worth, even after the appropriate liability is
established for taxes on capital gains that would be payable
should equities be sold at such market valuations.
As you know, Blue Chip Stamps, our 60% owned subsidiary, is
fully consolidated in Berkshire Hathaway’s financial statements.
However, Blue Chip still is required to carry its equity
investments at the lower of aggregate cost or aggregate market
value, just as Berkshire Hathaway’s insurance subsidiaries did
prior to this year. Should the same equities be purchased at an
identical price by an insurance subsidiary of Berkshire Hathaway
and by Blue Chip Stamps, present accounting principles often
would require that they end up carried on our consolidated
balance sheet at two different values. (That should keep you on
your toes.) Market values of Blue Chip Stamps’ equity holdings
are given in footnote 3 on page 18.
1979 Operating Results
We continue to feel that the ratio of operating earnings
(before securities gains or losses) to shareholders’ equity with
all securities valued at cost is the most appropriate way to
measure any single year’s operating performance.
Measuring such results against shareholders’ equity with
securities valued at market could significantly distort the
operating performance percentage because of wide year-to-year
market value changes in the net worth figure that serves as the
denominator. For example, a large decline in securities values
could result in a very low “market value” net worth that, in
turn, could cause mediocre operating earnings to look
unrealistically good. Alternatively, the more successful that
equity investments have been, the larger the net worth base
becomes and the poorer the operating performance figure appears.
Therefore, we will continue to report operating performance
measured against beginning net worth, with securities valued at
cost.
On this basis, we had a reasonably good operating
performance in 1979 - but not quite as good as that of 1978 -
with operating earnings amounting to 18.6% of beginning net
worth. Earnings per share, of course, increased somewhat (about
20%) but we regard this as an improper figure upon which to
focus. We had substantially more capital to work with in 1979
than in 1978, and our performance in utilizing that capital fell
short of the earlier year, even though per-share earnings rose.
“Earnings per share” will rise constantly on a dormant savings
account or on a U.S. Savings Bond bearing a fixed rate of return
simply because “earnings” (the stated interest rate) are
continuously plowed back and added to the capital base. Thus,
even a “stopped clock” can look like a growth stock if the
dividend payout ratio is low.
The primary test of managerial economic performance is the
achievement of a high earnings rate on equity capital employed
B
E
R
K
S
H
I
R
E
H
A
T
H
A
W
A
Y
I
N
C
.
�
(without undue leverage, accounting gimmickry, etc.) and not the
achievement of consistent gains in earnings per share. In our
view, many businesses would be better understood by their
shareholder owners, as well as the general public, if managements
and financial analysts modified the primary emphasis they place
upon earnings per share, and upon yearly changes in that figure.
Long Term Results
In measuring long term economic performance - in contrast to
yearly performance - we believe it is appropriate to recognize
fully any realized capital gains or losses as well as
extraordinary items, and also to utilize financial statements
presenting equity securities at market value. Such capital gains
or losses, either realized or unrealized, are fully as important
to shareholders over a period of years as earnings realized in a
more routine manner through operations; it is just that their
impact is often extremely capricious in the short run, a
characteristic that makes them inappropriate as an indicator of
single year managerial performance.
The book value per share of Berkshire Hathaway on September
30, 1964 (the fiscal yearend prior to the time that your present
management assumed responsibility) was $19.46 per share. At
yearend 1979, book value with equity holdings carried at market
value was $335.85 per share. The gain in book value comes to
20.5% compounded annually. This figure, of course, is far higher
than any average of our yearly operating earnings calculations,
and reflects the importance of capital appreciation of insurance
equity investments in determining the overall results for our
shareholders. It probably also is fair to say that the quoted
book value in 1964 somewhat overstated the intrinsic value of the
enterprise, since the assets owned at that time on either a going
concern basis or a liquidating value basis were not worth 100
cents on the dollar. (The liabilities were solid, however.)
We have achieved this result while utilizing a low amount of
leverage (both financial leverage measured by debt to equity, and
operating leverage measured by premium volume to capital funds of
our insurance business), and also without significant issuance or
repurchase of shares. Basically, we have worked with the capital
with which we started. From our textile base we, or our Blue
Chip and Wesco subsidiaries, have acquired total ownership of
thirteen businesses through negotiated purchases from private
owners for cash, and have started six others. (It’s worth a
mention that those who have sold to us have, almost without
exception, treated us with exceptional honor and fairness, both
at the time of sale and subsequently.)
But before we drown in a sea of self-congratulation, a
further - and crucial - observation must be made. A few years
ago, a business whose per-share net worth compounded at 20%
annually would have guaranteed its owners a highly successful
real investment return. Now such an outcome seems less certain.
For the inflation rate, coupled with individual tax rates, will
be the ultimate determinant as to whether our internal operating
performance produces successful investment results - i.e., a
reasonable gain in purchasing power from funds committed - for
you as shareholders.
Just as the original 3% savings bond, a 5% passbook savings
account or an 8% U.S. Treasury Note have, in turn, been
transformed by inflation into financial instruments that chew up,
rather than enhance, purchasing power over their investment
lives, a business earning 20% on capital can produce a negative
real return for its owners under inflationary conditions not much
more severe than presently prevail.
If we should continue to achieve a 20% compounded gain - not
�
an easy or certain result by any means - and this gain is
translated into a corresponding increase in the market value of
Berkshire Hathaway stock as it has been over the last fifteen
years, your after-tax purchasing power gain is likely to be very
close to zero at a 14% inflation rate. Most of the remaining six
percentage points will go for income tax any time you wish to
convert your twenty percentage points of nominal annual gain into
cash.
That combination - the inflation rate plus the percentage of
capital that must be paid by the owner to transfer into his own
pocket the annual earnings achieved by the business (i.e.,
ordinary income tax on dividends and capital gains tax on
retained earnings) - can be thought of as an “investor’s misery
index”. When this index exceeds the rate of return earned on
equity by the business, the investor’s purchasing power (real
capital) shrinks even though he consumes nothing at all. We have
no corporate solution to this problem; high inflation rates will
not help us earn higher rates of return on equity.
One friendly but sharp-eyed commentator on Berkshire has
pointed out that our book value at the end of 1964 would have
bought about one-half ounce of gold and, fifteen years later,
after we have plowed back all earnings along with much blood,
sweat and tears, the book value produced will buy about the same
half ounce. A similar comparison could be drawn with Middle
Eastern oil. The rub has been that government has been
exceptionally able in printing money and creating promises, but
is unable to print gold or create oil.
We intend to continue to do as well as we can in managing
the internal affairs of the business. But you should understand
that external conditions affecting the stability of currency may
very well be the most important factor in determining whether
there are any real rewards from your investment in Berkshire
Hathaway.
Sources of Earnings
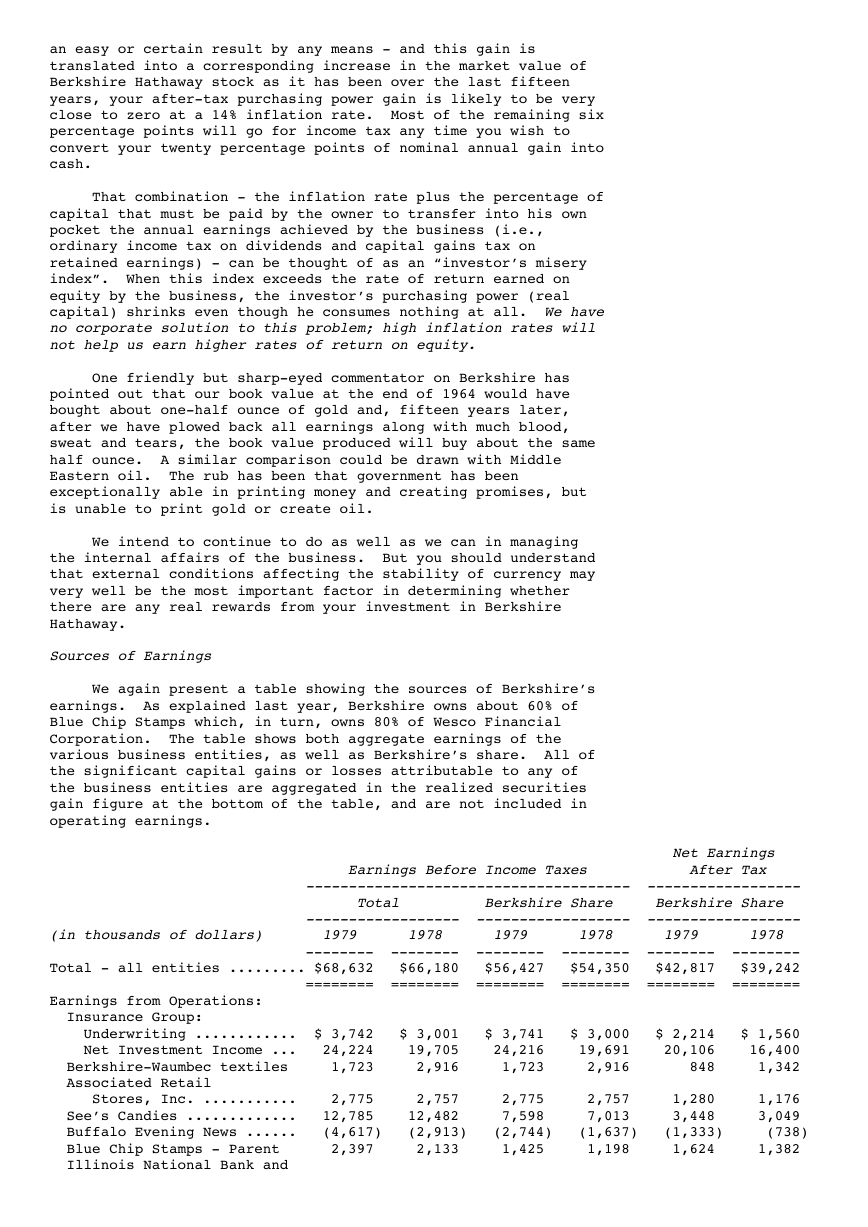
We again present a table showing the sources of Berkshire’s
earnings. As explained last year, Berkshire owns about 60% of
Blue Chip Stamps which, in turn, owns 80% of Wesco Financial
Corporation. The table shows both aggregate earnings of the
various business entities, as well as Berkshire’s share. All of
the significant capital gains or losses attributable to any of
the business entities are aggregated in the realized securities
gain figure at the bottom of the table, and are not included in
operating earnings.
Net Earnings
Earnings Before Income Taxes After Tax
-------------------------------------- ------------------
Total Berkshire Share Berkshire Share
------------------ ------------------ ------------------
(in thousands of dollars) 1979 1978 1979 1978 1979 1978
-------- -------- -------- -------- -------- --------
Total - all entities ......... $68,632 $66,180 $56,427 $54,350 $42,817 $39,242
======== ======== ======== ======== ======== ========
Earnings from Operations:
Insurance Group:
Underwriting ............ $ 3,742 $ 3,001 $ 3,741 $ 3,000 $ 2,214 $ 1,560
Net Investment Income ... 24,224 19,705 24,216 19,691 20,106 16,400
Berkshire-Waumbec textiles 1,723 2,916 1,723 2,916 848 1,342
Associated Retail
Stores, Inc. ........... 2,775 2,757 2,775 2,757 1,280 1,176
See’s Candies ............. 12,785 12,482 7,598 7,013 3,448 3,049
Buffalo Evening News ...... (4,617) (2,913) (2,744) (1,637) (1,333) (738)
Blue Chip Stamps - Parent 2,397 2,133 1,425 1,198 1,624 1,382
Illinois National Bank and
�
Trust Company .......... 5,747 4,822 5,614 4,710 5,027 4,262
Wesco Financial
Corporation - Parent ... 2,413 1,771 1,098 777 937 665
Mutual Savings and Loan
Association ............ 10,447 10,556 4,751 4,638 3,261 3,042
Precision Steel ........... 3,254 -- 1,480 -- 723 --
Interest on Debt .......... (8,248) (5,566) (5,860) (4,546) (2,900) (2,349)
Other ..................... 1,342 720 996 438 753 261
-------- -------- -------- -------- -------- --------
Total Earnings from
Operations .......... $57,984 $52,384 $46,813 $40,955 $35,988 $30,052
Realized Securities Gain 10,648 13,796 9,614 13,395 6,829 9,190
-------- -------- -------- -------- -------- --------
Total Earnings ......... $68,632 $66,180 $56,427 $54,350 $42,817 $39,242
======== ======== ======== ======== ======== ========
Blue Chip and Wesco are public companies with reporting
requirements of their own. On pages 37-43 of this report, we
have reproduced the narrative reports of the principal executives
of both companies, in which they describe 1979 operations. Some
of the numbers they mention in their reports are not precisely
identical to those in the above table because of accounting and
tax complexities. (The Yanomamo Indians employ only three
numbers: one, two, and more than two. Maybe their time will
come.) However, the commentary in those reports should be helpful
to you in understanding the underlying economic characteristics
and future prospects of the important businesses that they
manage.
A copy of the full annual report of either company will be
mailed to any shareholder of Berkshire upon request to Mr.
Robert H. Bird for Blue Chip Stamps, 5801 South Eastern Avenue,
Los Angeles, California 90040, or to Mrs. Bette Deckard for Wesco
Financial Corporation, 315 East Colorado Boulevard, Pasadena,
California 91109.
Textiles and Retailing
The relative significance of these two areas has diminished
somewhat over the years as our insurance business has grown
dramatically in size and earnings. Ben Rosner, at Associated
Retail Stores, continues to pull rabbits out of the hat - big
rabbits from a small hat. Year after year, he produces very
large earnings relative to capital employed - realized in cash
and not in increased receivables and inventories as in many other
retail businesses - in a segment of the market with little growth
and unexciting demographics. Ben is now 76 and, like our other
“up-and-comers”, Gene Abegg, 82, at Illinois National and Louis
Vincenti, 74, at Wesco, regularly achieves more each year.
Our textile business also continues to produce some cash,
but at a low rate compared to capital employed. This is not a
reflection on the managers, but rather on the industry in which
they operate. In some businesses - a network TV station, for
example - it is virtually impossible to avoid earning
extraordinary returns on tangible capital employed in the
business. And assets in such businesses sell at equally
extraordinary prices, one thousand cents or more on the dollar, a
valuation reflecting the splendid, almost unavoidable, economic
results obtainable. Despite a fancy price tag, the “easy”
business may be the better route to go.
We can speak from experience, having tried the other route.
Your Chairman made the decision a few years ago to purchase
Waumbec Mills in Manchester, New Hampshire, thereby expanding our
textile commitment. By any statistical test, the purchase price
was an extraordinary bargain; we bought well below the working
capital of the business and, in effect, got very substantial
amounts of machinery and real estate for less than nothing. But
�
the purchase was a mistake. While we labored mightily, new
problems arose as fast as old problems were tamed.
Both our operating and investment experience cause us to
conclude that “turnarounds” seldom turn, and that the same
energies and talent are much better employed in a good business
purchased at a fair price than in a poor business purchased at a
bargain price. Although a mistake, the Waumbec acquisition has
not been a disaster. Certain portions of the operation are
proving to be valuable additions to our decorator line (our
strongest franchise) at New Bedford, and it’s possible that we
may be able to run profitably on a considerably reduced scale at
Manchester. However, our original rationale did not prove out.
Insurance Underwriting
We predicted last year that the combined underwriting ratio
(see definition on page 36) for the insurance industry would
“move up at least a few points, perhaps enough to throw the
industry as a whole into an underwriting loss position”. That is
just about the way it worked out. The industry underwriting
ratio rose in 1979 over three points, from roughly 97.4% to
100.7%. We also said that we thought our underwriting performance
relative to the industry would improve somewhat in 1979 and,
again, things worked out as expected. Our own underwriting ratio
actually decreased from 98.2% to 97.1%. Our forecast for 1980 is
similar in one respect; again we feel that the industry’s
performance will worsen by at least another few points. However,
this year we have no reason to think that our performance
relative to the industry will further improve. (Don’t worry - we
won’t hold back to try to validate that forecast.)
Really extraordinary results were turned in by the portion
of National Indemnity Company’s insurance operation run by Phil
Liesche. Aided by Roland Miller in Underwriting and Bill Lyons
in Claims, this section of the business produced an underwriting
profit of $8.4 million on about $82 million of earned premiums.
Only a very few companies in the entire industry produced a
result comparable to this.
You will notice that earned premiums in this segment were
down somewhat from those of 1978. We hear a great many insurance
managers talk about being willing to reduce volume in order to
underwrite profitably, but we find that very few actually do so.
Phil Liesche is an exception: if business makes sense, he writes
it; if it doesn’t, he rejects it. It is our policy not to lay
off people because of the large fluctuations in work load
produced by such voluntary volume changes. We would rather have
some slack in the organization from time to time than keep
everyone terribly busy writing business on which we are going to
lose money. Jack Ringwalt, the founder of National Indemnity
Company, instilled this underwriting discipline at the inception
of the company, and Phil Liesche never has wavered in maintaining
it. We believe such strong-mindedness is as rare as it is sound
- and absolutely essential to the running of a first-class
casualty insurance operation.
John Seward continues to make solid progress at Home and
Automobile Insurance Company, in large part by significantly
expanding the marketing scope of that company in general
liability lines. These lines can be dynamite, but the record to
date is excellent and, in John McGowan and Paul Springman, we
have two cautious liability managers extending our capabilities.
Our reinsurance division, led by George Young, continues to
give us reasonably satisfactory overall results after allowing
for investment income, but underwriting performance remains
unsatisfactory. We think the reinsurance business is a very
tough business that is likely to get much tougher. In fact, the
�
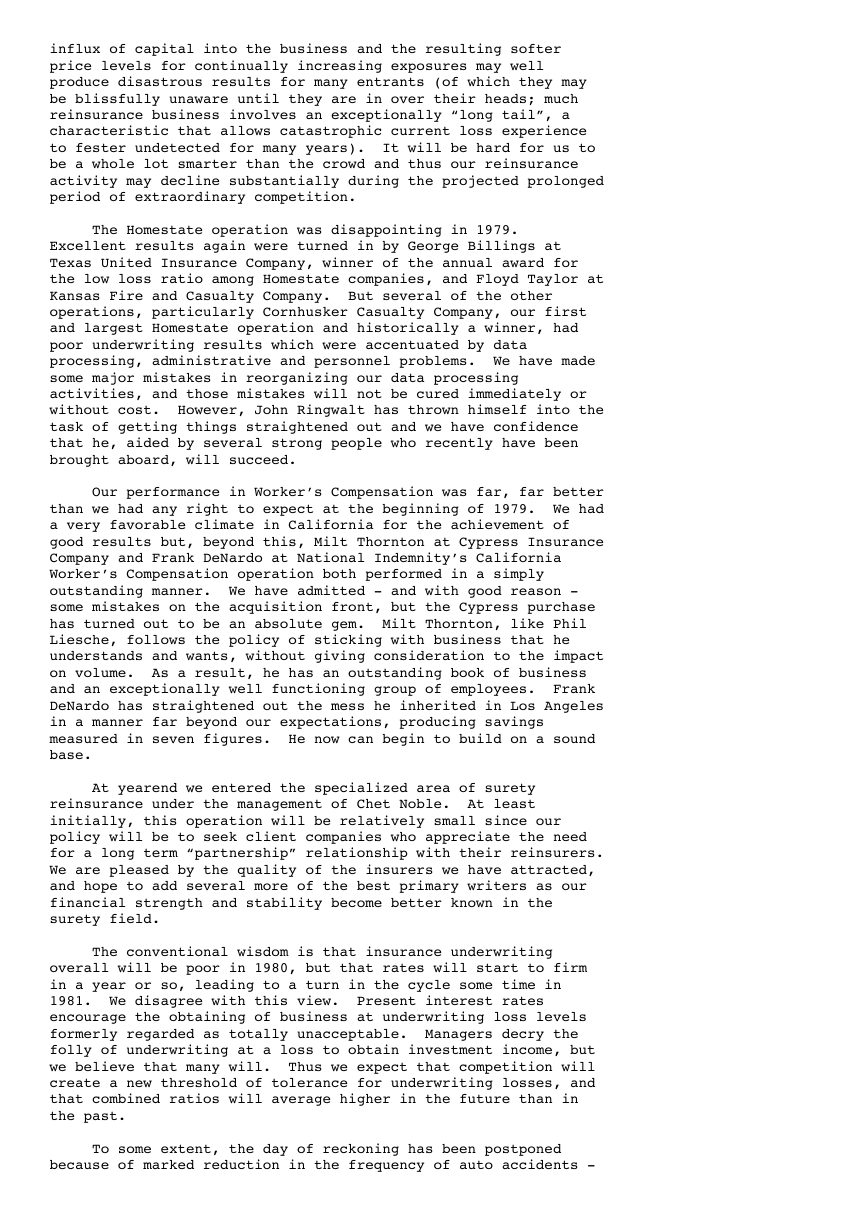
influx of capital into the business and the resulting softer
price levels for continually increasing exposures may well
produce disastrous results for many entrants (of which they may
be blissfully unaware until they are in over their heads; much
reinsurance business involves an exceptionally “long tail”, a
characteristic that allows catastrophic current loss experience
to fester undetected for many years). It will be hard for us to
be a whole lot smarter than the crowd and thus our reinsurance
activity may decline substantially during the projected prolonged
period of extraordinary competition.
The Homestate operation was disappointing in 1979.
Excellent results again were turned in by George Billings at
Texas United Insurance Company, winner of the annual award for
the low loss ratio among Homestate companies, and Floyd Taylor at
Kansas Fire and Casualty Company. But several of the other
operations, particularly Cornhusker Casualty Company, our first
and largest Homestate operation and historically a winner, had
poor underwriting results which were accentuated by data
processing, administrative and personnel problems. We have made
some major mistakes in reorganizing our data processing
activities, and those mistakes will not be cured immediately or
without cost. However, John Ringwalt has thrown himself into the
task of getting things straightened out and we have confidence
that he, aided by several strong people who recently have been
brought aboard, will succeed.
Our performance in Worker’s Compensation was far, far better
than we had any right to expect at the beginning of 1979. We had
a very favorable climate in California for the achievement of
good results but, beyond this, Milt Thornton at Cypress Insurance
Company and Frank DeNardo at National Indemnity’s California
Worker’s Compensation operation both performed in a simply
outstanding manner. We have admitted - and with good reason -
some mistakes on the acquisition front, but the Cypress purchase
has turned out to be an absolute gem. Milt Thornton, like Phil
Liesche, follows the policy of sticking with business that he
understands and wants, without giving consideration to the impact
on volume. As a result, he has an outstanding book of business
and an exceptionally well functioning group of employees. Frank
DeNardo has straightened out the mess he inherited in Los Angeles
in a manner far beyond our expectations, producing savings
measured in seven figures. He now can begin to build on a sound
base.
At yearend we entered the specialized area of surety
reinsurance under the management of Chet Noble. At least
initially, this operation will be relatively small since our
policy will be to seek client companies who appreciate the need
for a long term “partnership” relationship with their reinsurers.
We are pleased by the quality of the insurers we have attracted,
and hope to add several more of the best primary writers as our
financial strength and stability become better known in the
surety field.
The conventional wisdom is that insurance underwriting
overall will be poor in 1980, but that rates will start to firm
in a year or so, leading to a turn in the cycle some time in
1981. We disagree with this view. Present interest rates
encourage the obtaining of business at underwriting loss levels
formerly regarded as totally unacceptable. Managers decry the
folly of underwriting at a loss to obtain investment income, but
we believe that many will. Thus we expect that competition will
create a new threshold of tolerance for underwriting losses, and
that combined ratios will average higher in the future than in
the past.
To some extent, the day of reckoning has been postponed
because of marked reduction in the frequency of auto accidents -
�
probably brought on in major part by changes in driving habits
induced by higher gas prices. In our opinion, if the habits
hadn’t changed, auto insurance rates would have been very little
higher and underwriting results would have been much worse. This
dosage of serendipity won’t last indefinitely.
Our forecast is for an average combined ratio for the
industry in the 105 area over the next five years. While we have
a high degree of confidence that certain of our operations will
do considerably better than average, it will be a challenge to us
to operate below the industry figure. You can get a lot of
surprises in insurance.
Nevertheless, we believe that insurance can be a very good
business. It tends to magnify, to an unusual degree, human
managerial talent - or the lack of it. We have a number of
managers whose talent is both proven and growing. (And, in
addition, we have a very large indirect interest in two truly
outstanding management groups through our investments in SAFECO
and GEICO.) Thus we expect to do well in insurance over a period
of years. However, the business has the potential for really
terrible results in a single specific year. If accident
frequency should turn around quickly in the auto field, we, along
with others, are likely to experience such a year.
Insurance Investments
In recent years we have written at length in this section
about our insurance equity investments. In 1979 they continued
to perform well, largely because the underlying companies in
which we have invested, in practically all cases, turned in
outstanding performances. Retained earnings applicable to our
insurance equity investments, not reported in our financial
statements, continue to mount annually and, in aggregate, now
come to a very substantial number. We have faith that the
managements of these companies will utilize those retained
earnings effectively and will translate a dollar retained by them
into a dollar or more of subsequent market value for us. In
part, our unrealized gains reflect this process.
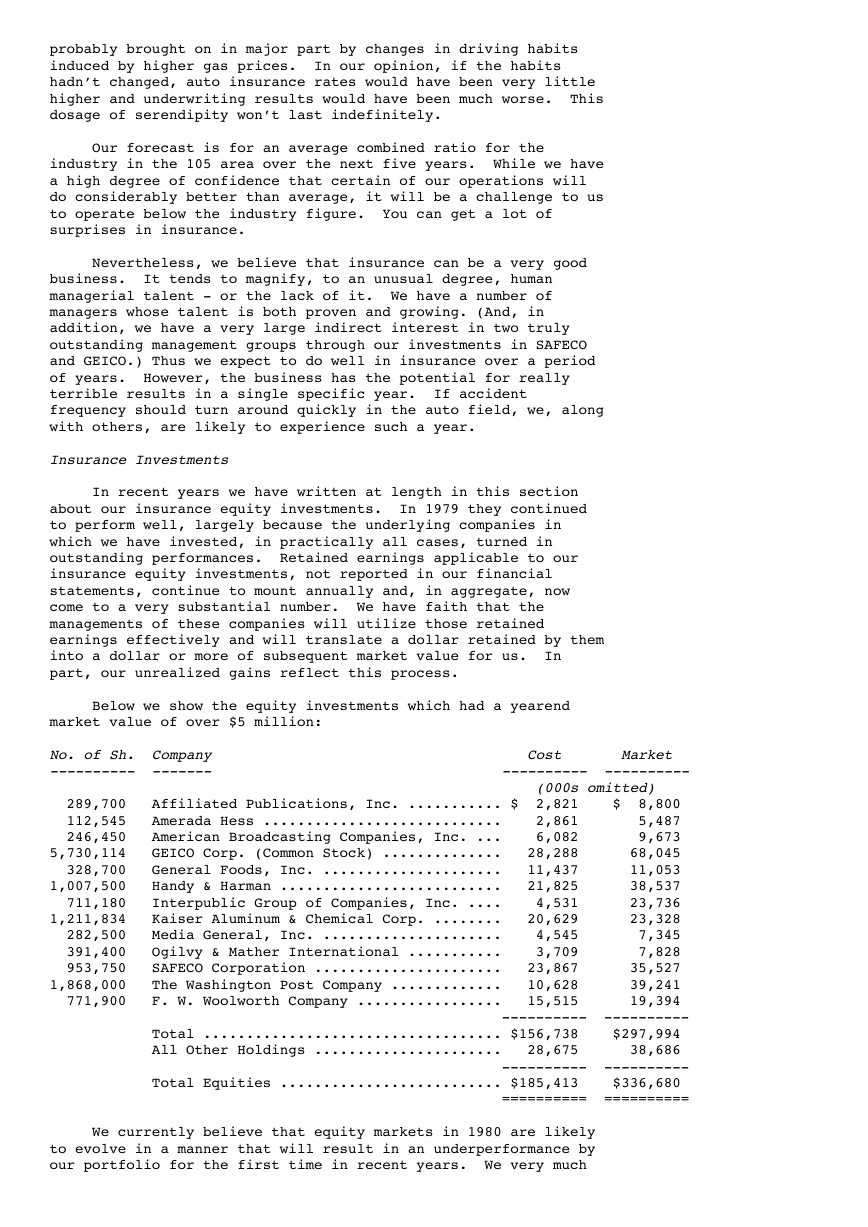
Below we show the equity investments which had a yearend
market value of over $5 million:
No. of Sh. Company Cost Market
---------- ------- ---------- ----------
(000s omitted)
289,700 Affiliated Publications, Inc. ........... $ 2,821 $ 8,800
112,545 Amerada Hess ............................ 2,861 5,487
246,450 American Broadcasting Companies, Inc. ... 6,082 9,673
5,730,114 GEICO Corp. (Common Stock) .............. 28,288 68,045
328,700 General Foods, Inc. ..................... 11,437 11,053
1,007,500 Handy & Harman .......................... 21,825 38,537
711,180 Interpublic Group of Companies, Inc. .... 4,531 23,736
1,211,834 Kaiser Aluminum & Chemical Corp. ........ 20,629 23,328
282,500 Media General, Inc. ..................... 4,545 7,345
391,400 Ogilvy & Mather International ........... 3,709 7,828
953,750 SAFECO Corporation ...................... 23,867 35,527
1,868,000 The Washington Post Company ............. 10,628 39,241
771,900 F. W. Woolworth Company ................. 15,515 19,394
---------- ----------
Total ................................... $156,738 $297,994
All Other Holdings ...................... 28,675 38,686
---------- ----------
Total Equities .......................... $185,413 $336,680
========== ==========
We currently believe that equity markets in 1980 are likely
to evolve in a manner that will result in an underperformance by
our portfolio for the first time in recent years. We very much
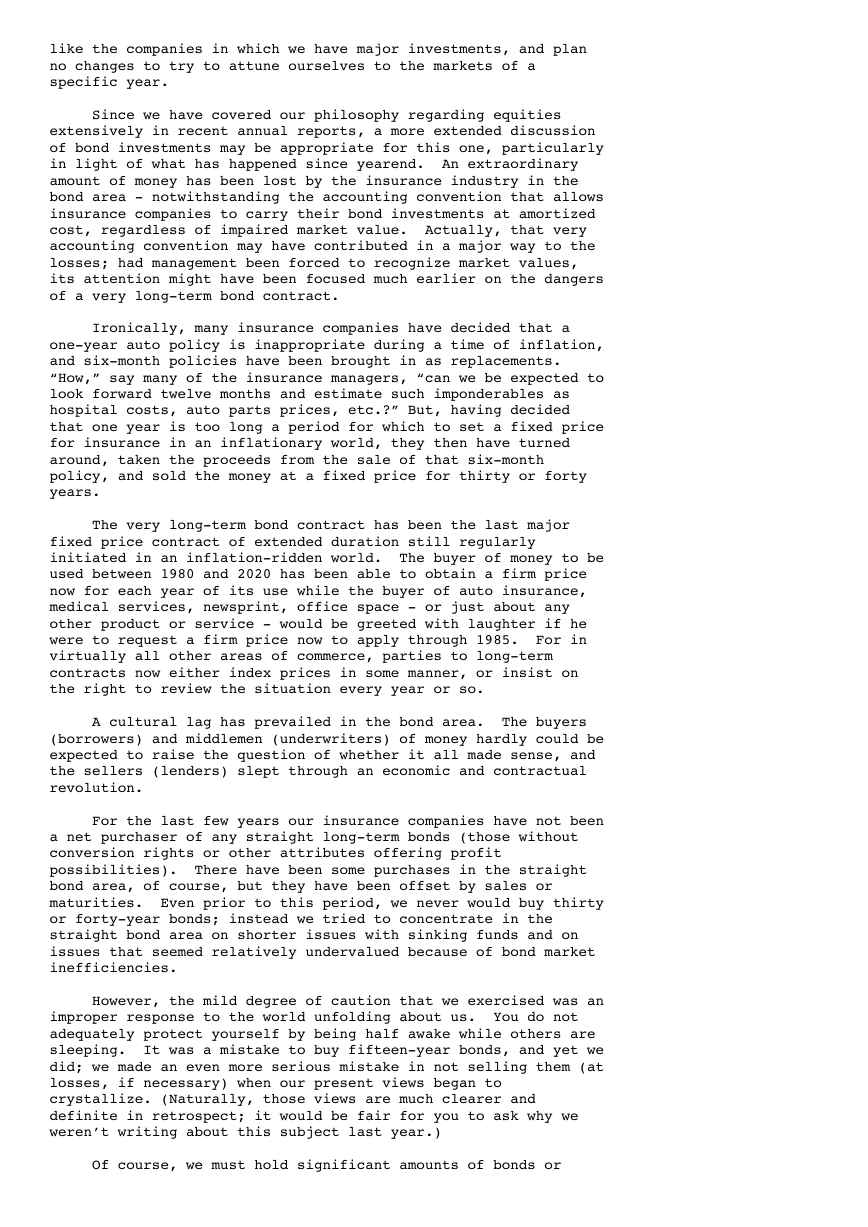
�
like the companies in which we have major investments, and plan
no changes to try to attune ourselves to the markets of a
specific year.
Since we have covered our philosophy regarding equities
extensively in recent annual reports, a more extended discussion
of bond investments may be appropriate for this one, particularly
in light of what has happened since yearend. An extraordinary
amount of money has been lost by the insurance industry in the
bond area - notwithstanding the accounting convention that allows
insurance companies to carry their bond investments at amortized
cost, regardless of impaired market value. Actually, that very
accounting convention may have contributed in a major way to the
losses; had management been forced to recognize market values,
its attention might have been focused much earlier on the dangers
of a very long-term bond contract.
Ironically, many insurance companies have decided that a
one-year auto policy is inappropriate during a time of inflation,
and six-month policies have been brought in as replacements.
“How,” say many of the insurance managers, “can we be expected to
look forward twelve months and estimate such imponderables as
hospital costs, auto parts prices, etc.?” But, having decided
that one year is too long a period for which to set a fixed price
for insurance in an inflationary world, they then have turned
around, taken the proceeds from the sale of that six-month
policy, and sold the money at a fixed price for thirty or forty
years.
The very long-term bond contract has been the last major
fixed price contract of extended duration still regularly
initiated in an inflation-ridden world. The buyer of money to be
used between 1980 and 2020 has been able to obtain a firm price
now for each year of its use while the buyer of auto insurance,
medical services, newsprint, office space - or just about any
other product or service - would be greeted with laughter if he
were to request a firm price now to apply through 1985. For in
virtually all other areas of commerce, parties to long-term
contracts now either index prices in some manner, or insist on
the right to review the situation every year or so.
A cultural lag has prevailed in the bond area. The buyers
(borrowers) and middlemen (underwriters) of money hardly could be
expected to raise the question of whether it all made sense, and
the sellers (lenders) slept through an economic and contractual
revolution.
For the last few years our insurance companies have not been
a net purchaser of any straight long-term bonds (those without
conversion rights or other attributes offering profit
possibilities). There have been some purchases in the straight
bond area, of course, but they have been offset by sales or
maturities. Even prior to this period, we never would buy thirty
or forty-year bonds; instead we tried to concentrate in the
straight bond area on shorter issues with sinking funds and on
issues that seemed relatively undervalued because of bond market
inefficiencies.
However, the mild degree of caution that we exercised was an
improper response to the world unfolding about us. You do not
adequately protect yourself by being half awake while others are
sleeping. It was a mistake to buy fifteen-year bonds, and yet we
did; we made an even more serious mistake in not selling them (at
losses, if necessary) when our present views began to
crystallize. (Naturally, those views are much clearer and
definite in retrospect; it would be fair for you to ask why we
weren’t writing about this subject last year.)
Of course, we must hold significant amounts of bonds or
�
