Cisco Visual Networking
Index: Forecast and Trends,
2017–2022
This forecast is part of the Cisco® Visual Networking Index™ (Cisco VNI™), an ongoing initiative to
track and forecast the impact of visual networking applications. This document presents the details
of the Cisco VNI global IP traffic forecast, key trends and the underlying methodology. For more
global, regional and select country-level projections, refer to the VNI Forecast Highlights tool.
Executive summary
Global traffic projections
Annual global IP traffic will reach 4.8 ZB per year by 2022, or 396 Exabytes (EB) per month. In 2017, the
annual run rate for global IP traffic was 1.5 ZB per year, or 122 EB per month.
Global IP traffic will increase threefold over the next 5 years. Overall, IP traffic will grow at a Compound
Annual Growth Rate (CAGR) of 26 percent from 2017 to 2022. Monthly IP traffic will reach 50 GB per capita by
2022, up from 16 GB per capita in 2017.
Busy hour Internet traffic is growing more rapidly than average Internet traffic. Busy hour (or the busiest
60minute period in a day) Internet traffic will increase by a factor of 4.8 between 2017 and 2022, and average
Internet traffic will increase by a factor of 3.7.
Global internet users and devices/Connections
The number of devices connected to IP networks will be more than three times the global population by
2022. There will be 3.6 networked devices per capita by 2022, up from 2.4 networked devices per capita in
2017. There will be 28.5 billion networked devices by 2022, up from 18 billion in 2017.
M2M connections will be more than half of the global connected devices and connections by 2022. The
share of M2M connections will grow from 34 percent in 2017 to 51 percent by 2022. There will be 14.6 billion
M2M connections by 2022.
Smartphone traffic will exceed PC traffic. In 2018, PCs accounted for 41 percent of total IP traffic, but by
2022 PCs will account for only 19 percent of IP traffic. Smartphones will account for 44 percent of total IP traffic
by 2022, up from 18 percent in 2017.
© 2019 Cisco and/or its affiliates. All rights reserved.
White paperCisco public© 2019 Cisco and/or its affiliates. All rights reserved.�
Contents
Executive summary
Forecast overview
Trends
Trend 1: Continued shifts in mix of
devices and connections
Trend (loT) 2: IPv6 adoption enables
Internet of Things (loT) connectivity
Trend 3: M2M applications
across many industries
accelerate IoT growth
Trend 4: Applications traffic growth
Trend 5: “Cord-Cutting” analysis
Trend 6: Security analysis
Trend 7: Effects of accelerating
speeds on traffic growth
Trend 8: Mobility (Wi-Fi) continues
to gain momentum
Trend 9: Traffic-pattern analysis
(peak compared to average, CDN
uptake and SD-WAN)
Appendices
Appendix A:
Overview of VNI methodology
Appendix B:
Global IP traffic growth,
2017–2022
Appendix C:
Consumer IP traffic,
2017–2022
Appendix D:
Consumer internet traffic,
2017–2022
Appendix E:
Content delivery network traffic,
2017–2022
Appendix F:
Consumer-managed IP traffic,
2017–2022
Appendix G: Business IP traffic
Appendix H: Mobile data traffic
For more information
© 2019 Cisco and/or its affiliates. All rights reserved.
Global network access/Connectivity trends (Fixed/Mobile/Wi-Fi)
Traffic from wireless and mobile devices will account for 71 percent of
total IP traffic by 2022. By 2022, wired devices will account for 29 percent
of IP traffic, and Wi-Fi and mobile devices will account for 71 percent of IP
traffic. In 2017, also, wired devices accounted for less than half of the global
IP traffic, at 48 percent.
Globally, mobile data traffic will increase sevenfold between 2017 and
2022. Mobile data traffic will grow at a CAGR of 46 percent between 2017
and 2022, reaching 77.5 exabytes per month by 2022.
Global mobile data traffic will grow nearly twice as fast as fixed IP
traffic from 2017 to 2022. Fixed IP traffic will grow at a CAGR of 24 percent
between 2017 and 2022, while mobile traffic grows at a CAGR of 46
percent. Global mobile data traffic was 9 percent of total IP traffic in 2017
and will be 20 percent of total IP traffic by 2022.
Global application trends
Globally, IP video traffic will be 82 percent of all IP traffic (both business
and consumer) by 2022, up from 75 percent in 2017. Global IP video traffic
will grow four-fold from 2017 to 2022, a CAGR of 29 percent. Internet video
traffic will grow fourfold from 2017 to 2022, a CAGR of 33 percent.
Live Internet video will account for 17 percent of Internet video traffic by
2022. Live video will grow 15-fold from 2017 to 2022.
Internet video surveillance traffic will increase sevenfold between 2017
to 2022. Globally, 3 percent of all Internet video traffic will be due to video
surveillance by 2022, up from 2 percent in 2017.
Virtual Reality (VR) and Augmented Reality (AR) traffic will increase 12-
fold between 2017 and 2022 globally, a CAGR of 65 percent.
Internet video to TV will increase threefold between 2017 to 2022.
Internet video to TV will be 27 percent of fixed consumer Internet video
traffic by 2022.
Consumer Video-on-Demand (VoD) traffic will nearly double by 2022.
The amount of VoD traffic by 2022 will be equivalent to 10 billion DVDs
per month.
Internet gaming traffic will grow ninefold from 2017 to 2022, a CAGR
of 55 percent. Globally, Internet gaming traffic will be 4 percent of global IP
traffic by 2022, up from 1 percent in 2017.
Global network performance
Broadband speeds will nearly double by 2022. By 2022, global fixed
broadband speeds will reach 75.4 Mbps, up from 39 Mbps in 2017.
White paperCisco public�
Global traffic topology
Content Delivery Networks (CDNs) will carry 72 percent of Internet traffic by 2022 up from 56 percent in 2017.
Thirty-three percent of service provider network capacity will be within a metro network by 2022, up from 27
percent in 2017.
Global 5G mobile highlights
5G devices and connections will be over 3 percent of global mobile devices and connections by 2022.
By 2022, global mobile devices will grow from 8.6 billion in 2017 to 12.3 billion by 2022 - over 422 million of those
will be 5G capable.
Nearly twelve percent of global mobile traffic will be on 5G cellular connectivity by 2022. Globally, the average
5G connection will generate 21 GB of traffic per month by 2022.
Regional highlights
IP traffic is growing fastest in the Middle East and Africa, followed by Asia Pacific. Traffic in the Middle East and
Africa will grow at a CAGR of 41 percent between 2017 and 2022.
Summary of regional growth rates:
• IP traffic in Asia Pacific will reach 172.7 EB per month by 2022, growing at a CAGR of 32 percent.
- By 2022, APAC will have 2.6 billion Internet users (62 percent of population), up from 1.7 billion (41 percent of
population) in 2017.
- By 2022, APAC will have 13.1 billion networked devices/connections, up from 8.6 billion in 2017.
- By 2022, APAC’s average fixed broadband speed will reach 98.8 Mbps, 2.1-fold growth from 2017 (46.2 Mbps)
• IP traffic in North America will reach 108.4 EB per month by 2022, growing at a CAGR of 21 percent.
- By 2022, NA will have 353 million Internet users (94 percent of population), up from 331 million (92 percent of
population) in 2017.
- By 2022, NA will have 5.0 billion networked devices/connections, up from 2.9 billion in 2017.
- By 2022, NA’s average fixed broadband speed will reach 94.2 Mbps, 2.2-fold growth from 2017 (43.2 Mbps)
• IP traffic in Western Europe will reach 49.9 EB per month by 2022, growing at a CAGR of 22 percent.
- By 2022, WE will have 380 million Internet users (89 percent of population), up from 358 million (85 percent of
population) in 2017.
- By 2022, WE will have 4.0 billion networked devices/connections, up from 2.3 billion in 2017.
- By 2022, WE’s average fixed broadband speed will reach 76.0 Mbps, 2.0-fold growth from 2017 (37.9 Mbps)
IP traffic in Central and Eastern Europe will reach 25.3 EB per month by 2022, growing at a CAGR of 26 percent.
- By 2022, CEE will have 364 million Internet users (73 percent of population), up from 332 million (68 percent of
population) in 2017.
- By 2022, CEE will have 2.0 billion networked devices/connections, up from 1.2 billion in 2017.
- By 2022, CEE’s average fixed broadband speed will reach 46.7 Mbps, 1.4-fold growth from 2017 (32.8 Mbps)
White paperCisco public© 2019 Cisco and/or its affiliates. All rights reserved.�
• IP traffic in the Middle East and Africa will reach 20.9 EB per month by 2022, growing at a CAGR of 41 percent.
- By 2022, MEA will have 549 million Internet users (32 percent of population), up from 388 million (23 percent of
population) in 2017.
- By 2022, MEA will have 2.5 billion networked devices/connections, up from 1.7 billion in 2017.
- By 2022, MEA’s average fixed broadband speed will reach 20.2 Mbps, 2.0-fold to 2.6-fold growth from 2017
(7.8 Mbps)
• IP traffic in Latin America will reach 18.8 EB per month by 2022, growing at a CAGR of 21 percent.
- By 2022, LATAM will have 465 million Internet users (69 percent of population), up from 368 million (57 percent
of population) in 2017.
- By 2022, LATAM will have 2.0 billion networked devices/connections, up from 1.4 billion in 2017.
- By 2022, LATAM’s average fixed broadband speed will reach 28.1 Mbps, 2.4-fold growth from 2017 (11.7 Mbps).
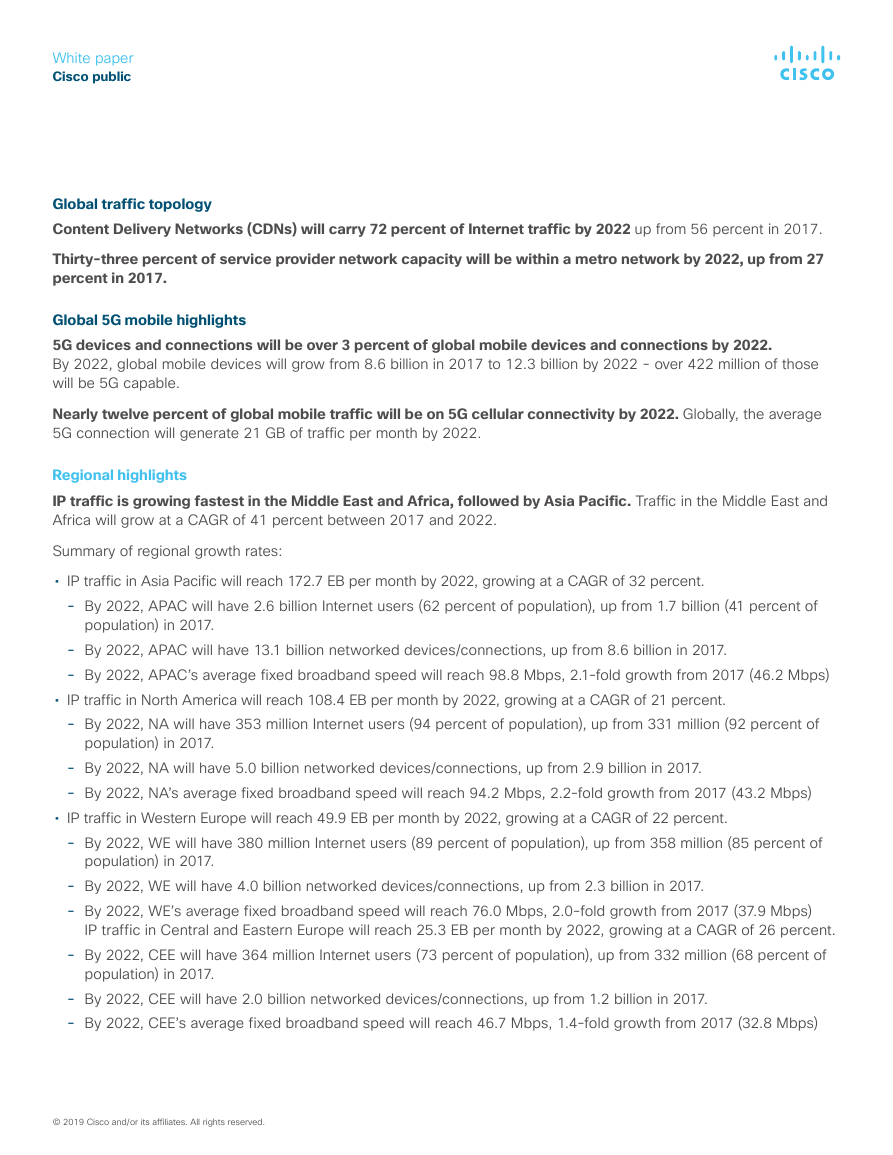
Forecast overview
The current Cisco Visual Networking Index (VNI) forecast projects global IP traffic to nearly triple from 2017 to 2022.
The appendix offers a detailed summary.
Overall IP traffic is expected to grow to 396 EB per month by 2022, up from 122 EB per month in 2017, a CAGR
of 26 percent (Figure 1). This growth represents a slight increase in expectations over last year’s forecast, which
projected a CAGR of 24 percent from 2016 to 2021, driven by an increase in the growing share of mobile traffic as a
percentage of the total IP traffic.
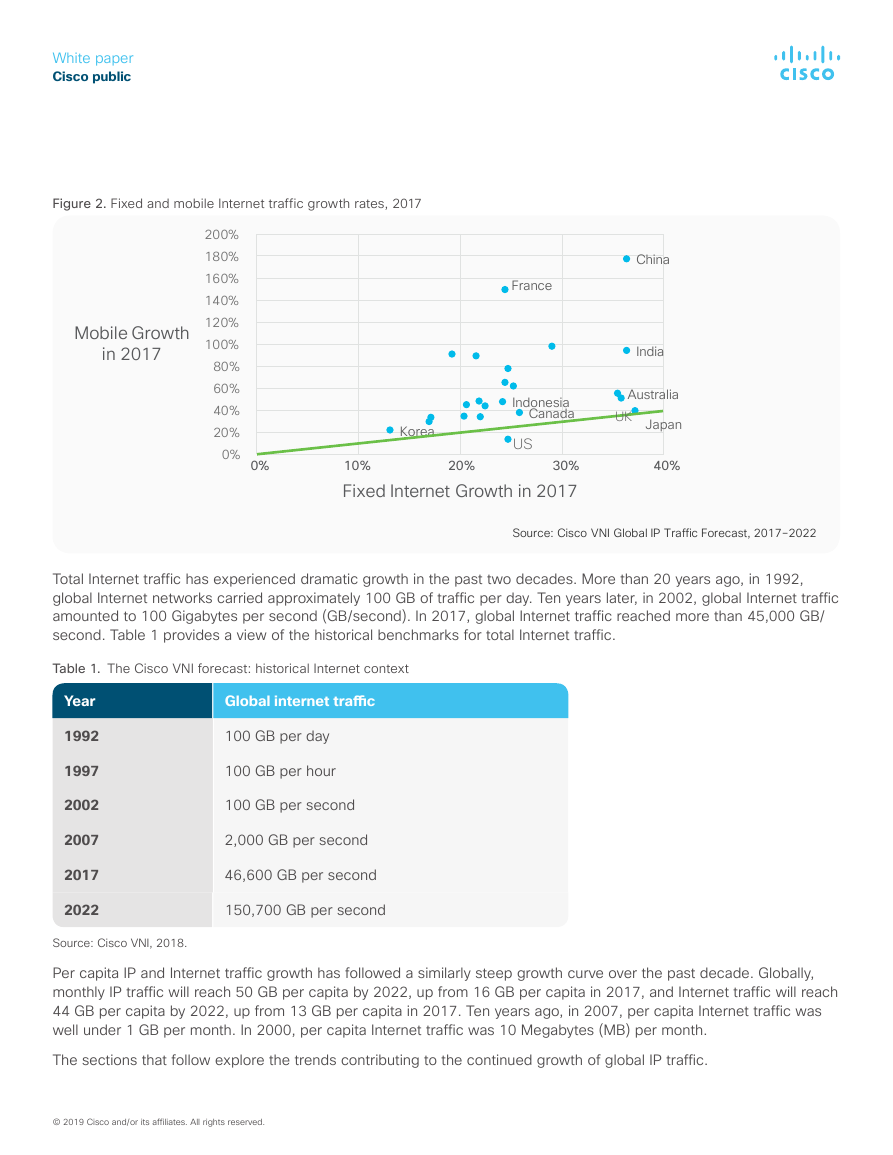
Also, of note in the recent forecast is the growing number of countries whose fixed traffic growth rivals that of their
mobile traffic growth. United States is the outlier, with a fixed growth of 26 percent in 2017 and a mobile growth of
23 percent over the same time period. Japan, Korea, Canada, Germany and Sweden, all have fixed growth that is only
slightly lower than their mobile growth. The majority of countries still have significantly higher growth rates for mobile
than for fixed.
Figure 1. Cisco VNI forecasts 396 EB per month of IP traffic by 2022
26% CAGR
2017–2022
Exabytes
per Month
400
350
300
250
200
150
100
50
0
396
319
254
201
156
122
2017
2018
2019
2020
2021
2022
Source: Cisco VNI Global IP Traffic Forecast, 2017–2022
For more details about Cisco’s forecasting methodology, refer to the appendix.
White paperCisco public© 2019 Cisco and/or its affiliates. All rights reserved.�
Figure 2. Fixed and mobile Internet traffic growth rates, 2017
Mobile Growth
in 2017
200%
180%
160%
140%
120%
100%
80%
60%
40%
20%
0%
France
Korea
Indonesia
Canada
US
0%
30%
10%
Fixed Internet Growth in 2017
20%
China
India
Australia
UK Japan
40%
Source: Cisco VNI Global IP Traffic Forecast, 2017–2022
Total Internet traffic has experienced dramatic growth in the past two decades. More than 20 years ago, in 1992,
global Internet networks carried approximately 100 GB of traffic per day. Ten years later, in 2002, global Internet traffic
amounted to 100 Gigabytes per second (GB/second). In 2017, global Internet traffic reached more than 45,000 GB/
second. Table 1 provides a view of the historical benchmarks for total Internet traffic.
Table 1. The Cisco VNI forecast: historical Internet context
Year
1992
1997
2002
2007
2017
2022
Global internet traffic
100 GB per day
100 GB per hour
100 GB per second
2,000 GB per second
46,600 GB per second
150,700 GB per second
Source: Cisco VNI, 2018.
Per capita IP and Internet traffic growth has followed a similarly steep growth curve over the past decade. Globally,
monthly IP traffic will reach 50 GB per capita by 2022, up from 16 GB per capita in 2017, and Internet traffic will reach
44 GB per capita by 2022, up from 13 GB per capita in 2017. Ten years ago, in 2007, per capita Internet traffic was
well under 1 GB per month. In 2000, per capita Internet traffic was 10 Megabytes (MB) per month.
The sections that follow explore the trends contributing to the continued growth of global IP traffic.
White paperCisco public© 2019 Cisco and/or its affiliates. All rights reserved.�
Trends
Trend 1: Continued shifts in mix of devices and connections
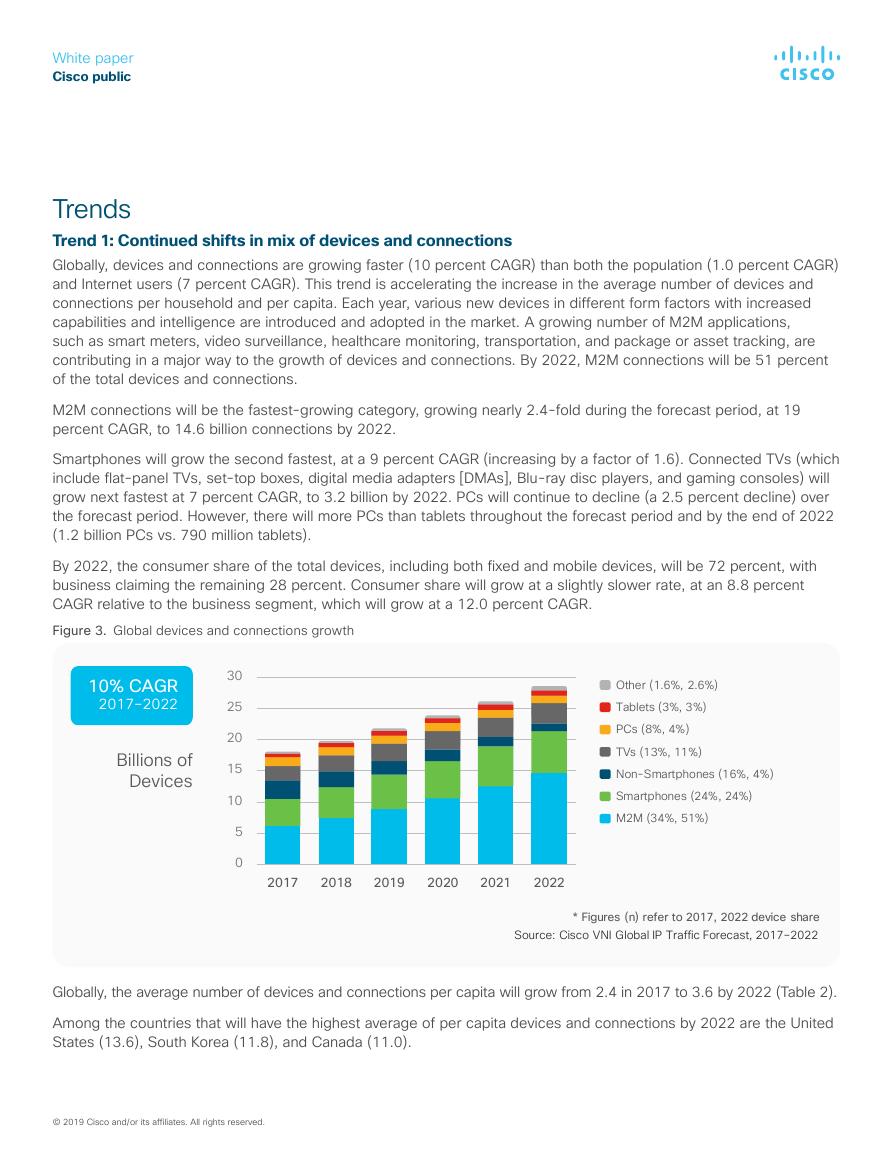
Globally, devices and connections are growing faster (10 percent CAGR) than both the population (1.0 percent CAGR)
and Internet users (7 percent CAGR). This trend is accelerating the increase in the average number of devices and
connections per household and per capita. Each year, various new devices in different form factors with increased
capabilities and intelligence are introduced and adopted in the market. A growing number of M2M applications,
such as smart meters, video surveillance, healthcare monitoring, transportation, and package or asset tracking, are
contributing in a major way to the growth of devices and connections. By 2022, M2M connections will be 51 percent
of the total devices and connections.
M2M connections will be the fastest-growing category, growing nearly 2.4-fold during the forecast period, at 19
percent CAGR, to 14.6 billion connections by 2022.
Smartphones will grow the second fastest, at a 9 percent CAGR (increasing by a factor of 1.6). Connected TVs (which
include flat-panel TVs, set-top boxes, digital media adapters [DMAs], Blu-ray disc players, and gaming consoles) will
grow next fastest at 7 percent CAGR, to 3.2 billion by 2022. PCs will continue to decline (a 2.5 percent decline) over
the forecast period. However, there will more PCs than tablets throughout the forecast period and by the end of 2022
(1.2 billion PCs vs. 790 million tablets).
By 2022, the consumer share of the total devices, including both fixed and mobile devices, will be 72 percent, with
business claiming the remaining 28 percent. Consumer share will grow at a slightly slower rate, at an 8.8 percent
CAGR relative to the business segment, which will grow at a 12.0 percent CAGR.
Figure 3. Global devices and connections growth
10% CAGR
2017–2022
Billions of
Devices
30
25
20
15
10
5
0
Other (1.6%, 2.6%)
Tablets (3%, 3%)
PCs (8%, 4%)
TVs (13%, 11%)
Non-Smartphones (16%, 4%)
Smartphones (24%, 24%)
M2M (34%, 51%)
2017
2018
2019
2020
2021
2022
* Figures (n) refer to 2017, 2022 device share
Source: Cisco VNI Global IP Traffic Forecast, 2017–2022
Globally, the average number of devices and connections per capita will grow from 2.4 in 2017 to 3.6 by 2022 (Table 2).
Among the countries that will have the highest average of per capita devices and connections by 2022 are the United
States (13.6), South Korea (11.8), and Canada (11.0).
White paperCisco public© 2019 Cisco and/or its affiliates. All rights reserved.�
Table 2. Average number of devices and connections per capita
Asia Pacific
Central and Eastern Europe
Latin America
Middle East and Africa
North America
Western Europe
Global
Source: Cisco VNI, 2018.
2017
2.1
2.5
2.1
1.1
8.0
5.4
2.4
2022
3.1
3.9
2.9
1.4
13.4
9.4
3.6
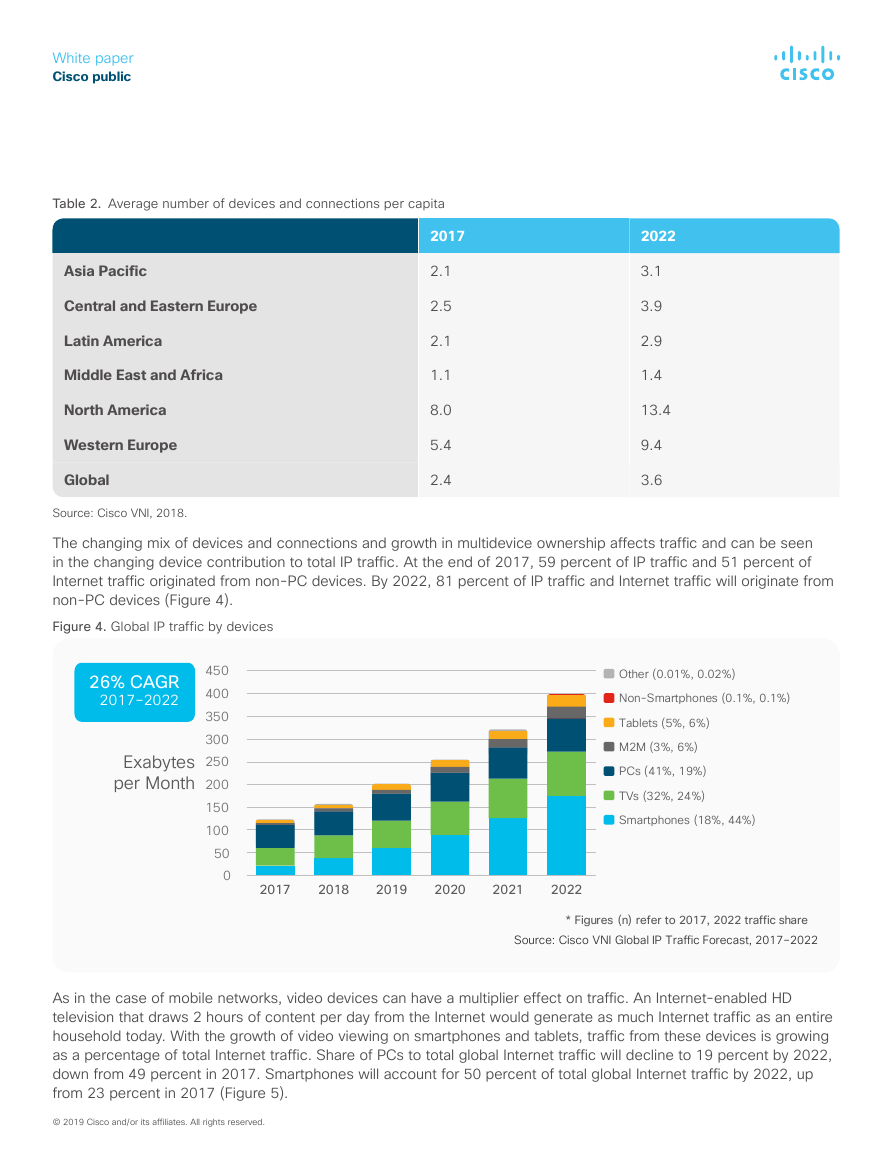
The changing mix of devices and connections and growth in multidevice ownership affects traffic and can be seen
in the changing device contribution to total IP traffic. At the end of 2017, 59 percent of IP traffic and 51 percent of
Internet traffic originated from non-PC devices. By 2022, 81 percent of IP traffic and Internet traffic will originate from
non-PC devices (Figure 4).
Figure 4. Global IP traffic by devices
26% CAGR
2017–2022
Exabytes
per Month
450
400
350
300
250
200
150
100
50
0
Other (0.01%, 0.02%)
Non-Smartphones (0.1%, 0.1%)
Tablets (5%, 6%)
M2M (3%, 6%)
PCs (41%, 19%)
TVs (32%, 24%)
Smartphones (18%, 44%)
2017
2018
2019
2020
2021
2022
* Figures (n) refer to 2017, 2022 traffic share
Source: Cisco VNI Global IP Traffic Forecast, 2017–2022
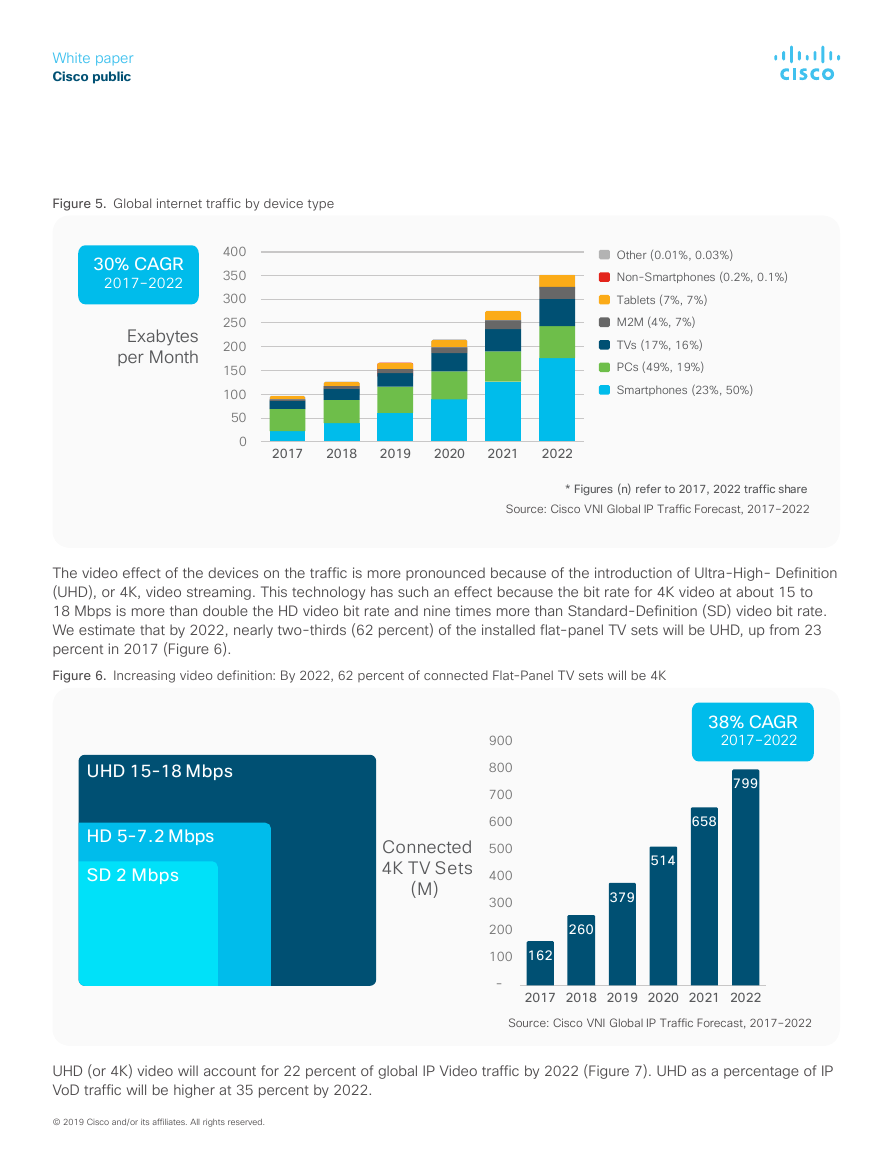
As in the case of mobile networks, video devices can have a multiplier effect on traffic. An Internet-enabled HD
television that draws 2 hours of content per day from the Internet would generate as much Internet traffic as an entire
household today. With the growth of video viewing on smartphones and tablets, traffic from these devices is growing
as a percentage of total Internet traffic. Share of PCs to total global Internet traffic will decline to 19 percent by 2022,
down from 49 percent in 2017. Smartphones will account for 50 percent of total global Internet traffic by 2022, up
from 23 percent in 2017 (Figure 5).
White paperCisco public© 2019 Cisco and/or its affiliates. All rights reserved.�
Figure 5. Global internet traffic by device type
30% CAGR
2017–2022
Exabytes
per Month
400
350
300
250
200
150
100
50
0
Other (0.01%, 0.03%)
Non-Smartphones (0.2%, 0.1%)
Tablets (7%, 7%)
M2M (4%, 7%)
TVs (17%, 16%)
PCs (49%, 19%)
Smartphones (23%, 50%)
2017
2018
2019
2020
2021
2022
* Figures (n) refer to 2017, 2022 traffic share
Source: Cisco VNI Global IP Traffic Forecast, 2017–2022
The video effect of the devices on the traffic is more pronounced because of the introduction of Ultra-High- Definition
(UHD), or 4K, video streaming. This technology has such an effect because the bit rate for 4K video at about 15 to
18 Mbps is more than double the HD video bit rate and nine times more than Standard-Definition (SD) video bit rate.
We estimate that by 2022, nearly two-thirds (62 percent) of the installed flat-panel TV sets will be UHD, up from 23
percent in 2017 (Figure 6).
Figure 6. Increasing video definition: By 2022, 62 percent of connected Flat-Panel TV sets will be 4K
UHD 15-18 Mbps
HD 5-7.2 Mbps
SD 2 Mbps
Connected
4K TV Sets
(M)
900
800
700
600
500
400
300
200
100
-
38% CAGR
2017–2022
799
658
514
379
260
162
2017 2018 2019 2020 2021 2022
Source: Cisco VNI Global IP Traffic Forecast, 2017–2022
UHD (or 4K) video will account for 22 percent of global IP Video traffic by 2022 (Figure 7). UHD as a percentage of IP
VoD traffic will be higher at 35 percent by 2022.
White paperCisco public© 2019 Cisco and/or its affiliates. All rights reserved.�


 2023年江西萍乡中考道德与法治真题及答案.doc
 2012年重庆南川中考生物真题及答案.doc
 2013年江西师范大学地理学综合及文艺理论基础考研真题.doc
 2020年四川甘孜小升初语文真题及答案I卷.doc
 2020年注册岩土工程师专业基础考试真题及答案.doc
 2023-2024学年福建省厦门市九年级上学期数学月考试题及答案.doc
 2021-2022学年辽宁省沈阳市大东区九年级上学期语文期末试题及答案.doc
 2022-2023学年北京东城区初三第一学期物理期末试卷及答案.doc
 2018上半年江西教师资格初中地理学科知识与教学能力真题及答案.doc
 2012年河北国家公务员申论考试真题及答案-省级.doc
 2020-2021学年江苏省扬州市江都区邵樊片九年级上学期数学第一次质量检测试题及答案.doc
 2022下半年黑龙江教师资格证中学综合素质真题及答案.doc