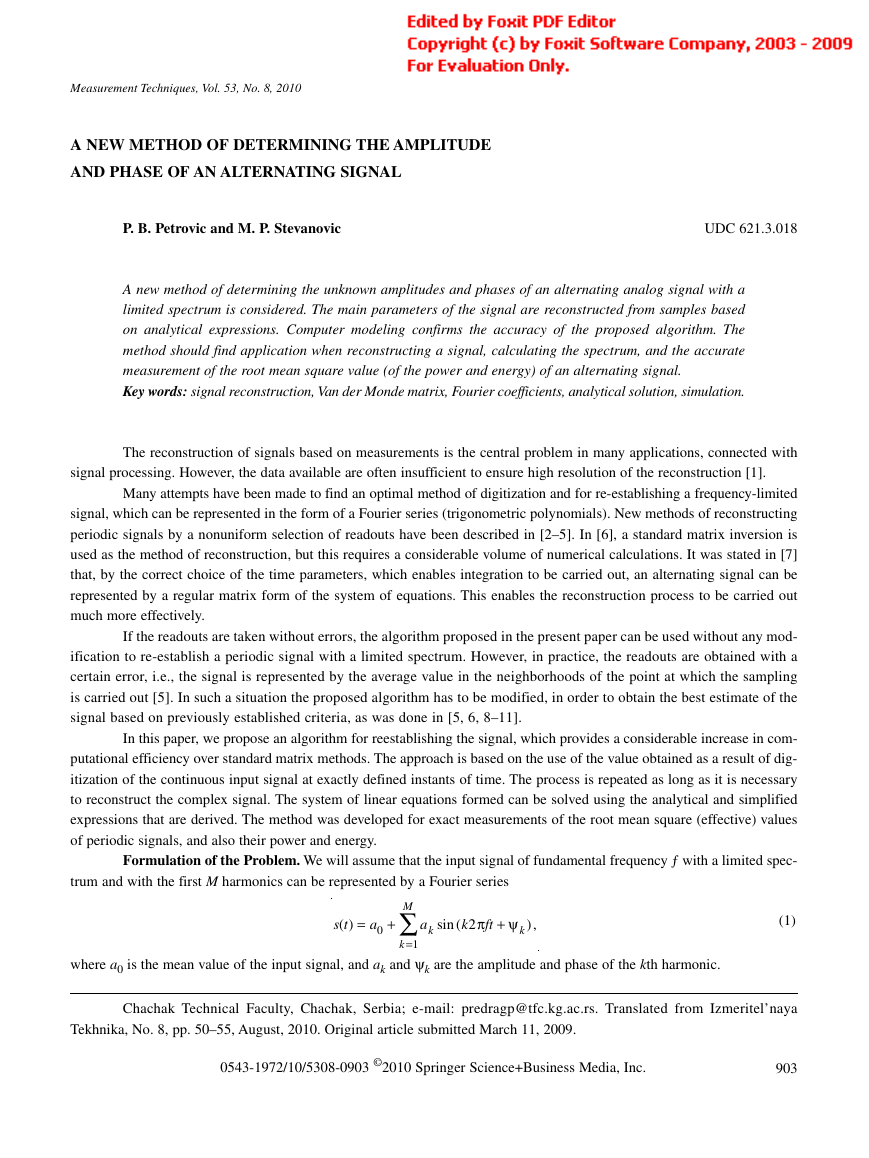
Measurement Techniques, Vol. 53, No. 8, 2010
A NEW METHOD OF DETERMINING THE AMPLITUDE
AND PHASE OF AN ALTERNATING SIGNAL
P. B. Petrovic and M. P. Stevanovic
UDC 621.3.018
A new method of determining the unknown amplitudes and phases of an alternating analog signal with a
limited spectrum is considered. The main parameters of the signal are reconstructed from samples based
on analytical expressions. Computer modeling confirms the accuracy of the proposed algorithm. The
method should find application when reconstructing a signal, calculating the spectrum, and the accurate
measurement of the root mean square value (of the power and energy) of an alternating signal.
Key words: signal reconstruction, Van der Monde matrix, Fourier coefficients, analytical solution, simulation.
The reconstruction of signals based on measurements is the central problem in many applications, connected with
signal processing. However, the data available are often insufficient to ensure high resolution of the reconstruction [1].
Many attempts have been made to find an optimal method of digitization and for re-establishing a frequency-limited
signal, which can be represented in the form of a Fourier series (trigonometric polynomials). New methods of reconstructing
periodic signals by a nonuniform selection of readouts have been described in [2–5]. In [6], a standard matrix inversion is
used as the method of reconstruction, but this requires a considerable volume of numerical calculations. It was stated in [7]
that, by the correct choice of the time parameters, which enables integration to be carried out, an alternating signal can be
represented by a regular matrix form of the system of equations. This enables the reconstruction process to be carried out
much more effectively.
If the readouts are taken without errors, the algorithm proposed in the present paper can be used without any mod-
ification to re-establish a periodic signal with a limited spectrum. However, in practice, the readouts are obtained with a
certain error, i.e., the signal is represented by the average value in the neighborhoods of the point at which the sampling
is carried out [5]. In such a situation the proposed algorithm has to be modified, in order to obtain the best estimate of the
signal based on previously established criteria, as was done in [5, 6, 8–11].
In this paper, we propose an algorithm for reestablishing the signal, which provides a considerable increase in com-
putational efficiency over standard matrix methods. The approach is based on the use of the value obtained as a result of dig-
itization of the continuous input signal at exactly defined instants of time. The process is repeated as long as it is necessary
to reconstruct the complex signal. The system of linear equations formed can be solved using the analytical and simplified
expressions that are derived. The method was developed for exact measurements of the root mean square (effective) values
of periodic signals, and also their power and energy.
Formulation of the Problem. We will assume that the input signal of fundamental frequency ƒ with a limited spec-
trum and with the first M harmonics can be represented by a Fourier series
∑0
+
=
1
where a0 is the mean value of the input signal, and ak and ψ
( )
s t
=
a
M
k
a
sin (
k
2
k
π +
ft
ψ
) ,
k
(1)
k are the amplitude and phase of the kth harmonic.
Chachak Technical Faculty, Chachak, Serbia; e-mail: predragp@tfc.kg.ac.rs. Translated from Izmeritel’naya
Tekhnika, No. 8, pp. 50–55, August, 2010. Original article submitted March 11, 2009.
0543-1972/10/5308-0903 ©2010 Springer Science+Business Media, Inc.
903
�
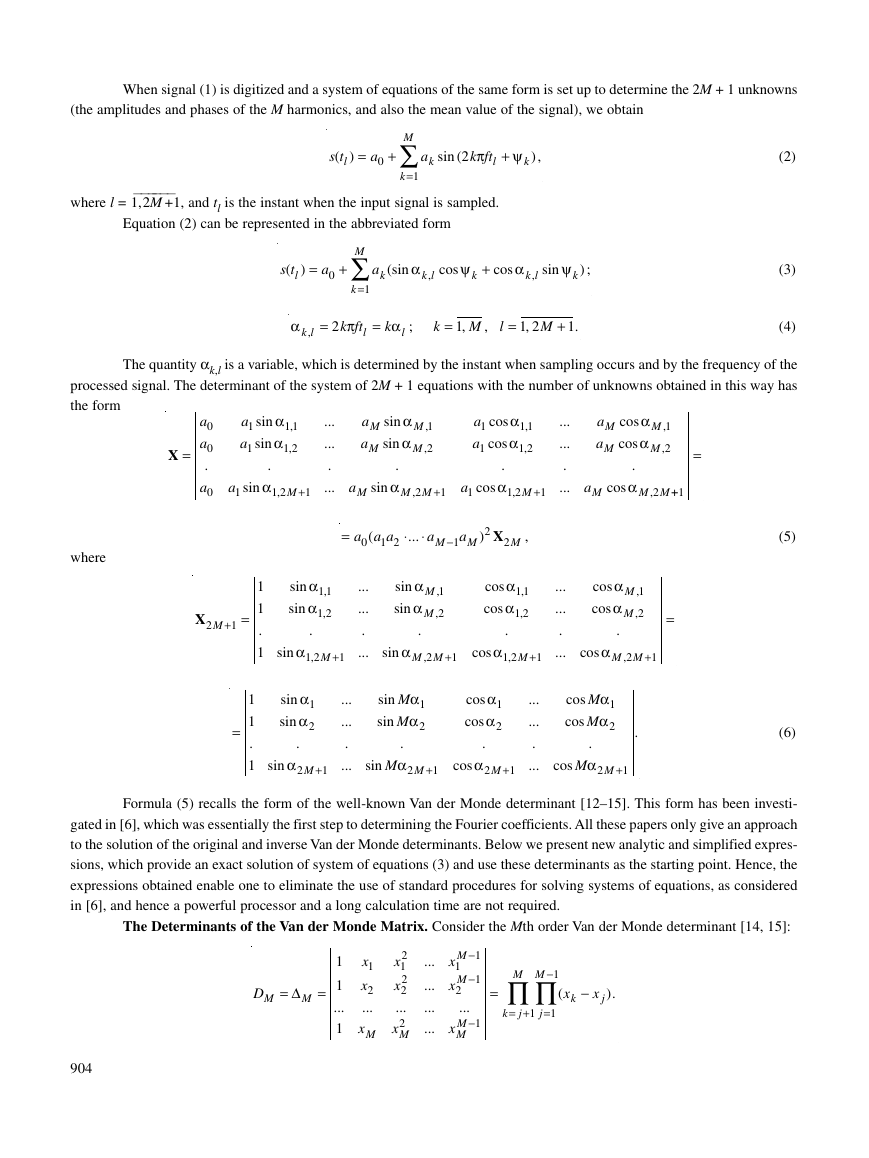
When signal (1) is digitized and a system of equations of the same form is set up to determine the 2M + 1 unknowns
(the amplitudes and phases of the M harmonics, and also the mean value of the signal), we obtain
=
a
(
s t
l
)
M
∑0
+
=
1
k
a
k
sin (
2
π
k ft
l
+
ψ
) ,
k
where l =⎯
⎯ 1,2M +1, and tl is the instant when the input signal is sampled.
Equation (2) can be represented in the abbreviated form
=
a
(
s t
l
)
M
∑0
+
=
1
k
a
k
(sin
α
,
k l
cos
ψ
k
+
α
cos
ψ
sin
) ;
k
,
k l
α
,
k l
=
π
k ft
2
=
α
k
;
l
l
=
k
,
1
M l
,
=
,
1 2
M
+
1
.
(2)
(3)
(4)
The quantity α
k,l is a variable, which is determined by the instant when sampling occurs and by the frequency of the
processed signal. The determinant of the system of 2M + 1 equations with the number of unknowns obtained in this way has
the form
0
a
a
0
.
a
0
X =
where
α
α
1 1
,
1 2
,
a
1
a
1
sin
sin
.
α
...
...
.
...
a
a
M
M
sin
sin
.
α
α
α
M
1
,
M
,
2
a
1
a
1
α
α
1 1
,
1 2
,
cos
cos
.
α
...
...
.
...
M
1
,
M
,
2
=
a
a
M
M
α
α
cos
cos
.
α
a
1
sin
1 2
,
+
1
M
a
M
sin
M M
2
,
+
1
a
1
cos
1 2
,
+
1
M
a
M
cos
M M
2
,
++
1
=
a a a
0
1 2
(
⋅
...
⋅
a
aM
1
−
M
2
)
X
,
2
M
sin
sin
1 1
,
1 2
,
α
α
.
α
sin
1 2
,
M
+
1
...
...
.
...
sin
sin
α
sin
M
,
1
M
,
2
α
α
.
M M
2
,
cos
cos
1 1
,
1 2
,
α
α
.
α
cos
+
1
1 2
,
M
+
1
...
...
.
...
cos
cos
M
1
,
M
,
2
α
α
.
M M
2
,
α
cos
α
sin
α
sin
.
1
2
α
sin
2
M
+
1
...
...
.
...
1
2
sin
sin
α
M
α
M
.
α
M
α
α
1
2
cos
cos
.
α
...
...
.
...
1
2
cos
cos
α
M
α
M
.
α
M
2
M
cos
.
+
1
sin
2
M
+
1
cos
+
1
M
2
=
+
1
(5)
(6)
X2
+
1
M
=
1
1
.
1
=
1
1
.
1
Formula (5) recalls the form of the well-known Van der Monde determinant [12–15]. This form has been investi-
gated in [6], which was essentially the first step to determining the Fourier coefficients. All these papers only give an approach
to the solution of the original and inverse Van der Monde determinants. Below we present new analytic and simplified expres-
sions, which provide an exact solution of system of equations (3) and use these determinants as the starting point. Hence, the
expressions obtained enable one to eliminate the use of standard procedures for solving systems of equations, as considered
in [6], and hence a powerful processor and a long calculation time are not required.
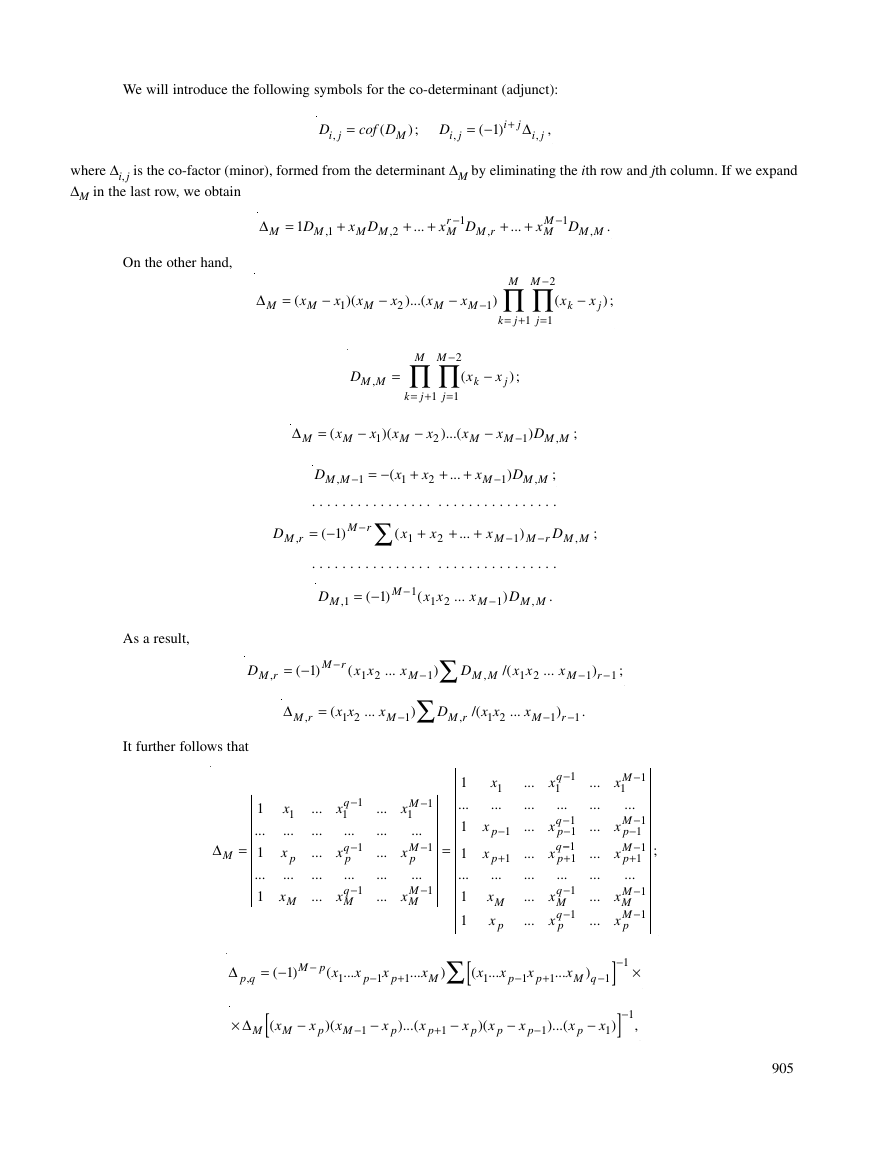
The Determinants of the Van der Monde Matrix. Consider the Mth order Van der Monde determinant [14, 15]:
D
M
= Δ
=
M
1
1
...
1
x
1
x
2
...
x
M
2
x
1
2
x
2
...
2
x
M
...
...
...
...
904
−
−
M
x
1
M
x
2
...
−
M
M
x
1
1
1
=
M
M
−∏ ∏
1
(
= +
j
k
1
j
=
1
x
−
k
x
).
j
⎯
⎯
⎯
⎯
�
We will introduce the following symbols for the co-determinant (adjunct):
=
D
,
i j
cof D
(
) ;
M
D
,
i j
= −
)
(
1
i
Δ+
j
,
,
i j
i, j is the co-factor (minor), formed from the determinant Δ
where Δ
M in the last row, we obtain
M by eliminating the ith row and jth column. If we expand
=
M
1
D
M
+
1
,
x D
M M
+
2
,
+
...
−
r
x D
M
1
+
,
M r
+
...
−
1
D
x
M
M
.
M M
,
On the other hand,
=
M
(
x
−
M
x
1
)(
x
−
M
x
2
)...(
x
−
M
x
)
−
1
M
M
M
−∏ ∏
2
(
= +
j
k
1
j
=
1
x
−
k
x
j
) ;
D
M M
,
=
M
M
−∏ ∏
2
(
= +
j
k
1
j
=
1
−
x
k
x
j
) ;
=
M
(
x
−
M
x
1
)(
x
−
M
x
2
)...(
x
−
M
x
−
1
M
)
D
M M
,
;
D
M M
,
−
1
= −
(
x
1
+
x
2
+
...
+
x
−
1
M
)
D
M M
,
;
. . . . . . . . . . . . . . . . . . . . . . . . . . . . . . . .
= −
(
∑1
−
M r
...
+
+
+
x
x
x
−
−
)
(
)
D
M
1
M r M M
,
1
2
;
D
,
M r
. . . . . . . . . . . . . . . . . . . . . . . . . . . . . . . .
= −
)
1
(
−
1
M
D
M
,
1
(
x x
1 2
...
x
−
1
M
)
D
M M
,
.
As a result,
= −
)
(
1
−
M r
D
,
M r
(
x x
1 2
...
x
)
−
1
M
∑
D
M M
,
/(
x x
1 2
...
x
−
)
r
1
−
1
;
M
=
,
M r
(
x x
1 2
...
x
)
−
1
M
∑
D
,
M r
/(
x x
1 2
...
x
)
−
1
r
−
1
.
M
It further follows that
=
M
1
...
1
...
1
x
1
...
x
p
...
x
M
...
...
...
...
...
−
q
x
1
...
−
q
p
...
−
q
M
x
x
1
1
1
...
...
...
...
...
−
M
x
1
...
−
M
p
...
−
M
M
x
x
1
=
1
1
1
...
1
1
...
1
1
1
1
...
...
...
...
...
...
...
−
x
1
q
x
1
...
−
1
q
−
1
p
−−
1
q
+
1
p
...
−
q
M
−
q
p
x
x
1
1
x
...
...
...
...
...
...
...
−
1
x
M
x
1
...
−
1
M
−
1
p
−
1
M
+
1
p
...
−
M
M
M
p
x
x
x
−
1
1
x
1
...
−
p
x
x
+
p
...
x
M
x
p
= −
(
,
p q
−
M p
1
)
(
...
x
1
x
−
1
p
x
+
...
1
x
p
M
)
∑
[
(
...
x
1
x
−
1
p
x
+
...
1
x
)
M q
p
−
1
−
1
]
×
[
(
M
× Δ
x
−
M
x
)(
p M
x
−
−
1
x
p
)...(
x
−
1
+
p
x
p
)(
x
−
p
x
−
1
p
)...(
x
−
p
x
1
)
]
−
1
,
;
905
Δ
Δ
Δ
Δ
Δ
Δ
Δ
�
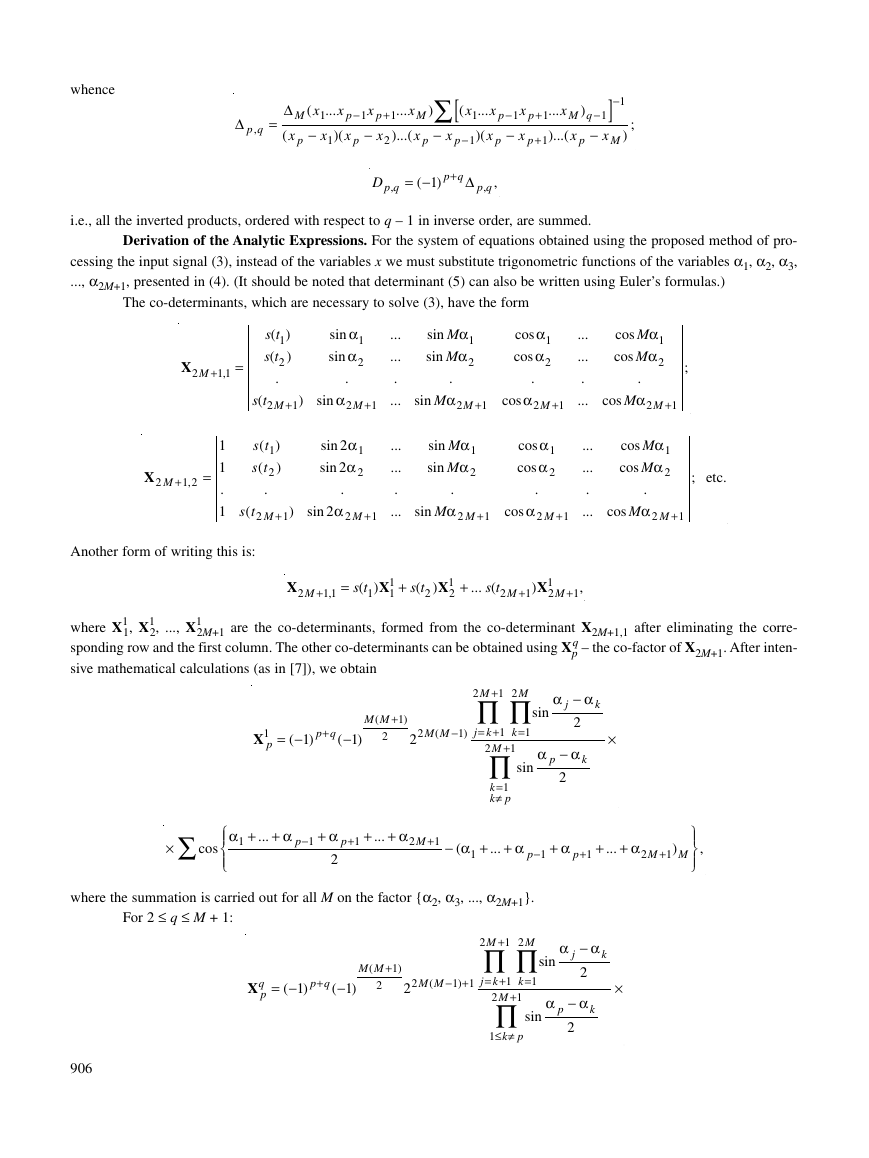
whence
=
p q
,
(
x
−
M
x
p
(
x
1
−
p
x
−
p
p
x
+
2
x
...
1
)...(
M
x
p
)
∑
−
x
x
...
1
x
1
)(
[
(
x
−
p
1
x
p
...
1
)(
x
p
x
−
1
−
x
+
p
+
p
x
...
1
)...(
)
−
M q
−
x
1
x
p
1
−
1
]
)
M
;
i.e., all the inverted products, ordered with respect to q – 1 in inverse order, are summed.
= −
)
(
1
Δ+
p q
D p q
,
,
,
p q
Derivation of the Analytic Expressions. For the system of equations obtained using the proposed method of pro-
2, α
3,
cessing the input signal (3), instead of the variables x we must substitute trigonometric functions of the variables α
..., α
2M+1, presented in (4). (It should be noted that determinant (5) can also be written using Euler’s formulas.)
1, α
The co-determinants, which are necessary to solve (3), have the form
(
s t
)
+
1
2
M
sin
2
M
+
1
sin
2
M
+
1
cos
+
1
M
2
X2
+
1 1
,
M
=
)
)
(
s t
1
(
s t
2
.
α
sin
α
sin
.
1
2
α
sin
sin
1
2
α
2
α
2
.
α
...
...
.
...
...
...
.
...
X2
+
M
1 2
,
=
1
1
.
1
)
)
1
2
(
s t
(
s t
.
(
s t
)
+
1
2
M
sin
2
2
M
+
1
1
2
sin
sin
α
M
α
M
.
α
M
α
α
1
2
cos
cos
.
α
1
2
cos
cos
α
M
α
M
.
α
M
2
M
cos
1
2
sin
sin
α
M
α
M
.
α
M
sin
2
M
+
1
1
2
α
cos
α
cos
.
α
cos
2
M
+
1
cos
cos
α
M
α
M
.
α
M
cos
2
M
+
1
...
...
.
...
...
...
.
...
;
+
1
1
2
;
etc.
Another form of writing this is:
X
2
M
+
1 1
,
=
(
s t
1
)
1
X
1
+
(
s t
2
)
1
X
2
+
... (
s t
)
1
X
2
+
1
,
+
1
M
2
M
1, X1
2, ..., X1
where X1
sponding row and the first column. The other co-determinants can be obtained using Xp
sive mathematical calculations (as in [7]), we obtain
2M+1 are the co-determinants, formed from the co-determinant X2M+1,1 after eliminating the corre-
q – the co-factor of X2M+1. After inten-
= −
1
(
)
+
p q
−
1
)
(
1
X p
+
1
)
(
M M
2
2
M M
(
−
1
)
2
+
2
1
2
M
M
∏∏
=
1
= +
1
j k
+
2
M
k
1
α
j
−
α
k
sin
2
α
k
×
α
p
−
2
sin
∏
=
1
k
≠
k p
∑ cos
×
α
1
+
...
+
α
−
1
p
+
α
+
1
p
+
...
+
α
2
M
+
1
2
−
α
(
1
+
...
+
α
−
1
p
+
α
+
1
p
+
...
+
α
)
+
1
M
2
M
,
where the summation is carried out for all M on the factor {α
2, α
3, ..., α
2M+1}.
For 2 ≤ q ≤ M + 1:
= −
)
1
(
+
p q
−
)
1
(
q
X p
+
)
1
(
M M
2
2
2
M M
(
− +
)
1 1
+
2
1
2
M
M
∏∏
sin
α
j
−
α
k
2
α
k
×
= +
1
j k
+
2
M
k
1
∏
≤ ≠
k p
=
1
α
p
−
2
sin
906
1
⎧
⎨
⎪
⎩
⎪
⎫
⎬
⎪
⎭
⎪
Δ
Δ
�
∑ sin
×
α
1
+
...
+
α
−
1
p
+
α
+
1
p
+
...
+
α
2
M
+
1
2
−
α
(
1
+
...
+
α
−
1
p
+
α
+
1
p
+
...
+
α
)
+
1
+ −
M q
1
2
M
.
. . . . . . . . . . . . . . . . . . . . . . . . . . . . . . . . . . . . . . . . . . . . . . . . . . . . . .
For q = 2M + 1
−
)
1
(
M M
2
2
q
X p
= −
)
1
(
2
M M
(
− +
)
1 1
+
2
1
2
M
M
∏∏
sin
α
j
−
α
k
= +
1
j k
+
2
M
k
1
∏
≤ ≠
k p
1
=
1
α
p
−
2
sin
×
2
α
k
.
×
cos
α
1
+
...
+
α
−
1
p
+
α
+
1
p
+
...
+
α
2
M
+
1
2
The result obtained shows that there is no need to use the standard procedure for solving the system of equations, as
proposed in [7, 8]. If the spectral composition of the signal is exceptionally complex, it is necessary to use a highly efficient
processor for this procedure and sufficient time to carry out the process. The expressions derived practically on-line enable
one to determine the unknown parameters – the amplitudes and phases using the following formulas:
=
a
0
X
2
X
+
1 1
,
+
1
;
=
a
k
1
X
2
M
+
1
X
2
2
+
1
,
M k
+
1
+
X
2
2
M M k
1
,
+ +
+
;
1
ψ
k
=
arctan
X
+
+ +
2
M M k
X
+
1
,
+
1
,
M k
2
1
1
.
M
2
M
A Check of the Results. Calculations showed agreement (to 10–14) of the results of calculations of X2M+1 and X1
l
(l = 1, ..., 15), carried out using the above formulas and the GEPP (Gaussian elimination with partial pivoting) algorithm,
which is usually used for these purposes (all the calculations were carried out in the standard IEEE arithmetic with double
accuracy). Hence, a practical check of this algorithm was carried out for the case of an ideal sample, ignoring quantization
errors and errors in measuring the frequency of the fundamental harmonic.
The proposed algorithm requires a knowledge of the number of higher harmonic components M of the signal being
processed or it must be taken to be greater than the expected (real) value. For this purpose, one must use any well-known
method of estimating the frequency spectrum. Two such algorithms for estimating the spectrum of a sinusoidal signal in the
presence of white noise are described in [16]. A modified parametric estimate, based on phase adjustment of the frequency,
was proposed in [17].
In view of the presence of an error when averaging the samples s(tl) and the variables α
l, it is necessary to obtain
their dependence on the carrier frequency ƒ of the signal fairly accurately. In this case the estimation procedure does not
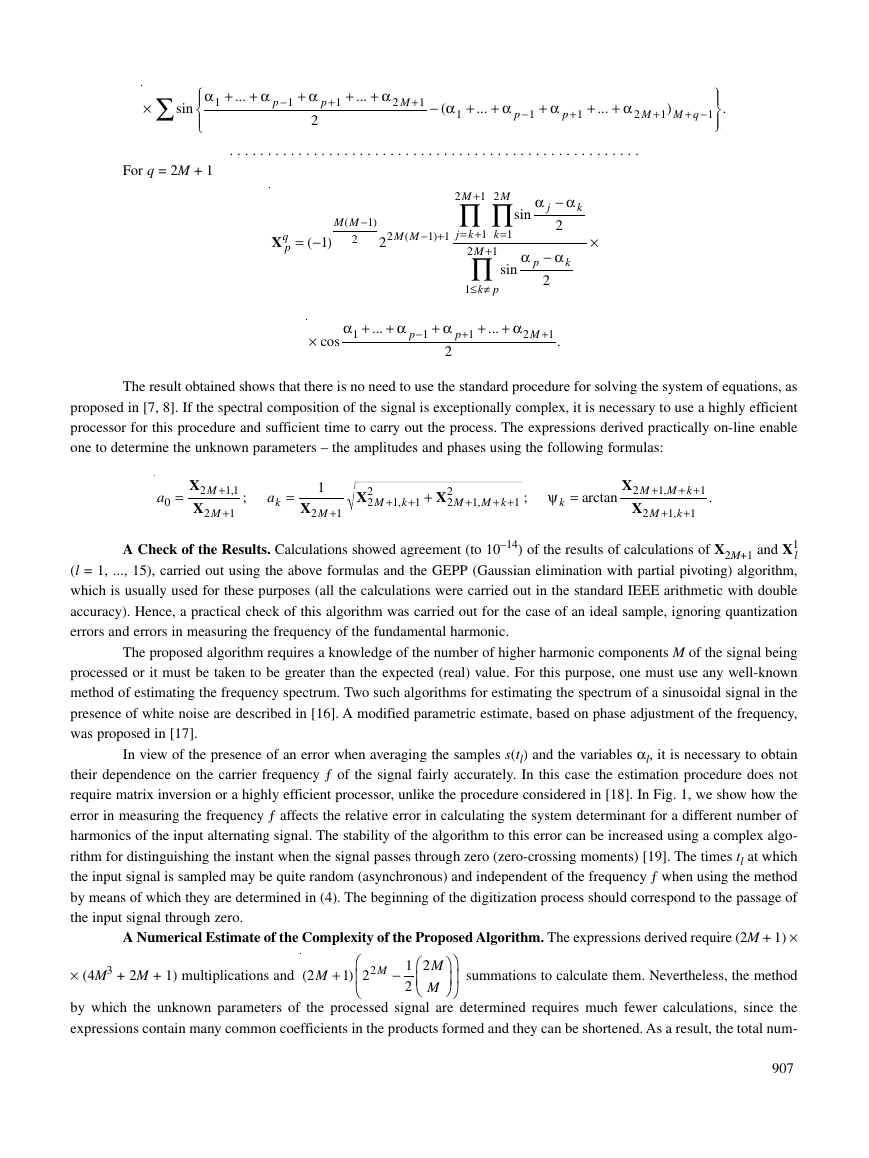
require matrix inversion or a highly efficient processor, unlike the procedure considered in [18]. In Fig. 1, we show how the
error in measuring the frequency ƒ affects the relative error in calculating the system determinant for a different number of
harmonics of the input alternating signal. The stability of the algorithm to this error can be increased using a complex algo-
rithm for distinguishing the instant when the signal passes through zero (zero-crossing moments) [19]. The times tl at which
the input signal is sampled may be quite random (asynchronous) and independent of the frequency ƒ when using the method
by means of which they are determined in (4). The beginning of the digitization process should correspond to the passage of
the input signal through zero.
A Numerical Estimate of the Complexity of the Proposed Algorithm. The expressions derived require (2M + 1) ×
× (4M3 + 2M + 1) multiplications and
(
2
M
+
)
1 2
2
M
−
1
2
2
M
M
summations to calculate them. Nevertheless, the method
by which the unknown parameters of the processed signal are determined requires much fewer calculations, since the
expressions contain many common coefficients in the products formed and they can be shortened. As a result, the total num-
907
⎛
⎝
⎜
⎞
⎠
⎟
⎛
⎝
⎜
⎞
⎠
⎟
⎧
⎨
⎪
⎩
⎪
⎫
⎬
⎪
⎭
⎪
�
Fig. 1. Graphs of the relative error in calculating the determinant of the system as a
function of the error in synchronization with the frequency of the fundamental input
signal ƒ = 50 Hz; the time quantization step is 1 msec (M is the number of harmonics).
Hz
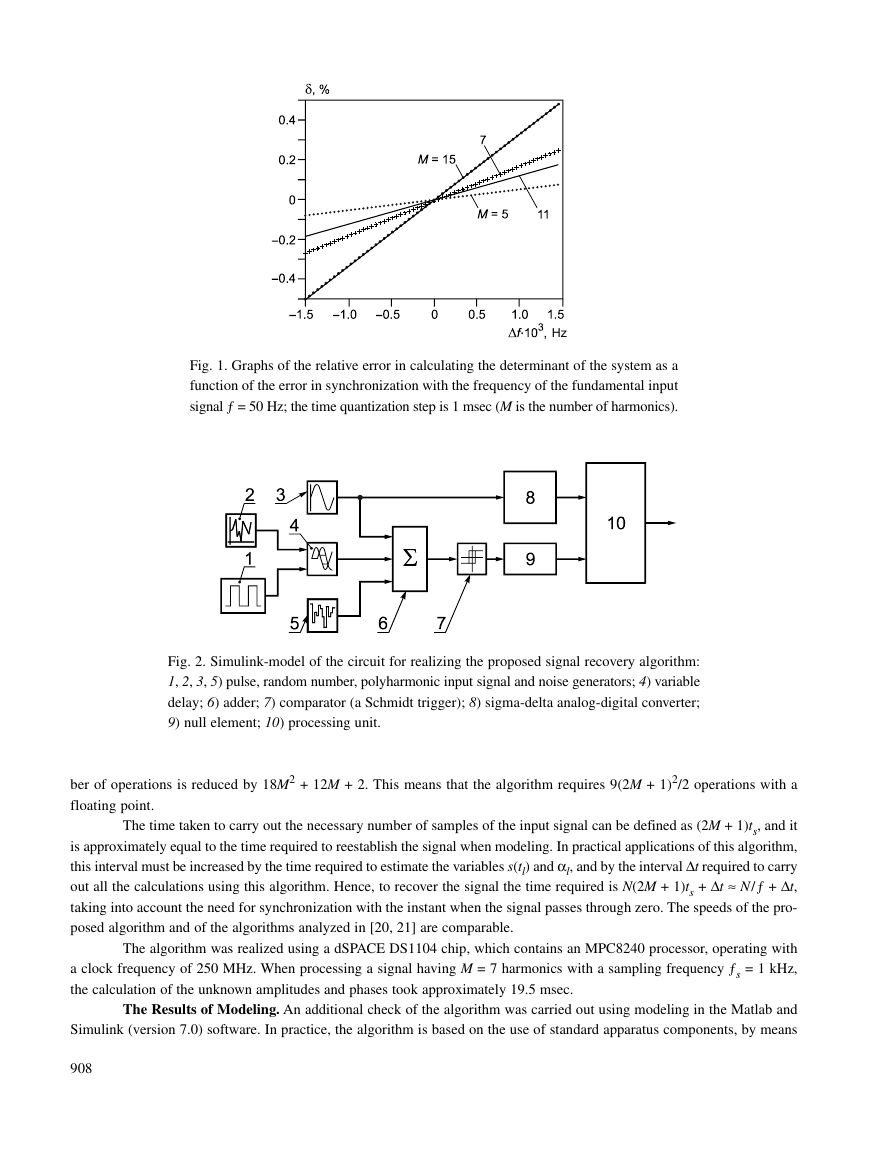
Fig. 2. Simulink-model of the circuit for realizing the proposed signal recovery algorithm:
1, 2, 3, 5) pulse, random number, polyharmonic input signal and noise generators; 4) variable
delay; 6) adder; 7) comparator (a Schmidt trigger); 8) sigma-delta analog-digital converter;
9) null element; 10) processing unit.
ber of operations is reduced by 18M2 + 12M + 2. This means that the algorithm requires 9(2M + 1)2/2 operations with a
floating point.
The time taken to carry out the necessary number of samples of the input signal can be defined as (2M + 1)ts, and it
is approximately equal to the time required to reestablish the signal when modeling. In practical applications of this algorithm,
this interval must be increased by the time required to estimate the variables s(tl) and α
t required to carry
out all the calculations using this algorithm. Hence, to recover the signal the time required is N(2M + 1)ts + Δ
t,
taking into account the need for synchronization with the instant when the signal passes through zero. The speeds of the pro-
posed algorithm and of the algorithms analyzed in [20, 21] are comparable.
l, and by the interval Δ
t ≈ N/ƒ + Δ
The algorithm was realized using a dSPACE DS1104 chip, which contains an MPC8240 processor, operating with
a clock frequency of 250 MHz. When processing a signal having M = 7 harmonics with a sampling frequency ƒs = 1 kHz,
the calculation of the unknown amplitudes and phases took approximately 19.5 msec.
The Results of Modeling. An additional check of the algorithm was carried out using modeling in the Matlab and
Simulink (version 7.0) software. In practice, the algorithm is based on the use of standard apparatus components, by means
908
�
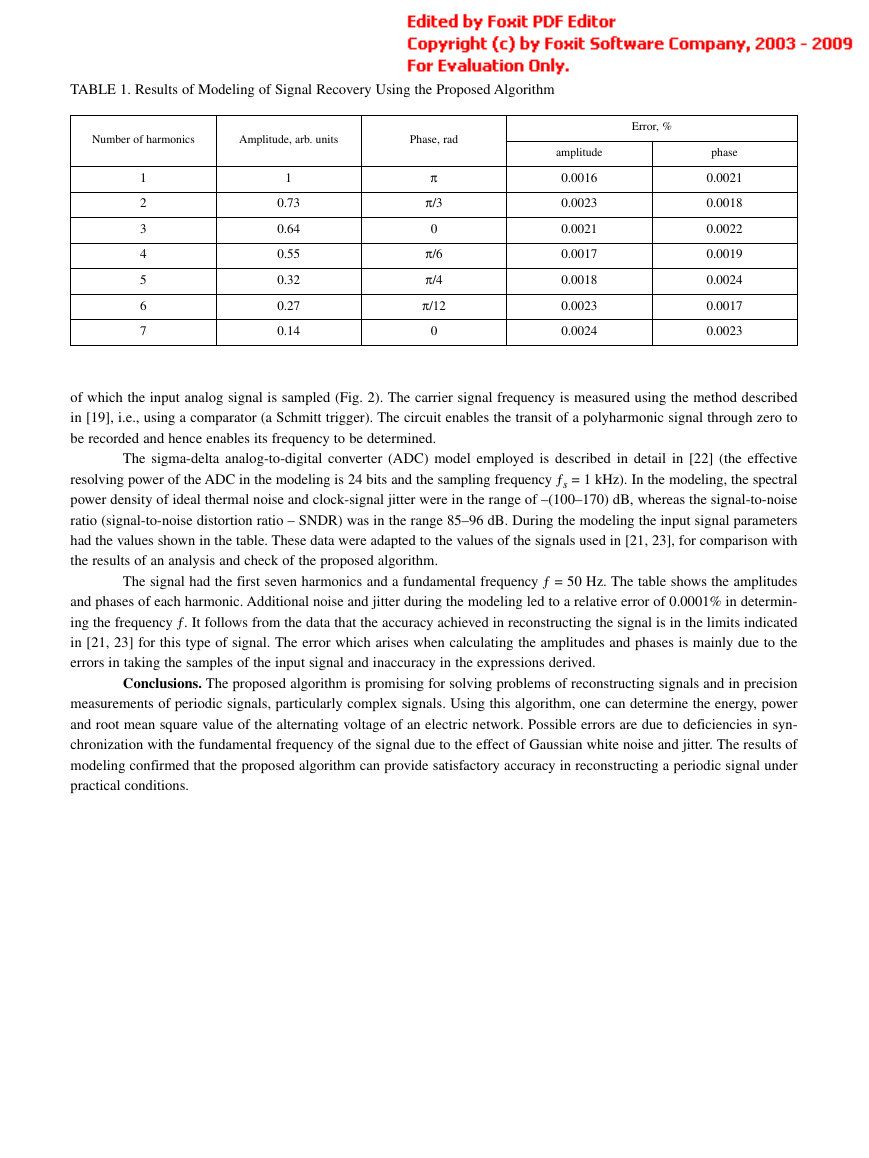
TABLE 1. Results of Modeling of Signal Recovery Using the Proposed Algorithm
Number of harmonics
Amplitude, arb. units
Phase, rad
1
2
3
4
5
6
7
1
0.73
0.64
0.55
0.32
0.27
0.14
π
π/3
0
π/6
π/4
π/12
0
Error, %
amplitude
0.0016
0.0023
0.0021
0.0017
0.0018
0.0023
0.0024
phase
0.0021
0.0018
0.0022
0.0019
0.0024
0.0017
0.0023
of which the input analog signal is sampled (Fig. 2). The carrier signal frequency is measured using the method described
in [19], i.e., using a comparator (a Schmitt trigger). The circuit enables the transit of a polyharmonic signal through zero to
be recorded and hence enables its frequency to be determined.
The sigma-delta analog-to-digital converter (ADC) model employed is described in detail in [22] (the effective
resolving power of the ADC in the modeling is 24 bits and the sampling frequency ƒs = 1 kHz). In the modeling, the spectral
power density of ideal thermal noise and clock-signal jitter were in the range of –(100–170) dB, whereas the signal-to-noise
ratio (signal-to-noise distortion ratio – SNDR) was in the range 85–96 dB. During the modeling the input signal parameters
had the values shown in the table. These data were adapted to the values of the signals used in [21, 23], for comparison with
the results of an analysis and check of the proposed algorithm.
The signal had the first seven harmonics and a fundamental frequency ƒ = 50 Hz. The table shows the amplitudes
and phases of each harmonic. Additional noise and jitter during the modeling led to a relative error of 0.0001% in determin-
ing the frequency ƒ. It follows from the data that the accuracy achieved in reconstructing the signal is in the limits indicated
in [21, 23] for this type of signal. The error which arises when calculating the amplitudes and phases is mainly due to the
errors in taking the samples of the input signal and inaccuracy in the expressions derived.
Conclusions. The proposed algorithm is promising for solving problems of reconstructing signals and in precision
measurements of periodic signals, particularly complex signals. Using this algorithm, one can determine the energy, power
and root mean square value of the alternating voltage of an electric network. Possible errors are due to deficiencies in syn-
chronization with the fundamental frequency of the signal due to the effect of Gaussian white noise and jitter. The results of
modeling confirmed that the proposed algorithm can provide satisfactory accuracy in reconstructing a periodic signal under
practical conditions.
�


 2023年江西萍乡中考道德与法治真题及答案.doc
 2012年重庆南川中考生物真题及答案.doc
 2013年江西师范大学地理学综合及文艺理论基础考研真题.doc
 2020年四川甘孜小升初语文真题及答案I卷.doc
 2020年注册岩土工程师专业基础考试真题及答案.doc
 2023-2024学年福建省厦门市九年级上学期数学月考试题及答案.doc
 2021-2022学年辽宁省沈阳市大东区九年级上学期语文期末试题及答案.doc
 2022-2023学年北京东城区初三第一学期物理期末试卷及答案.doc
 2018上半年江西教师资格初中地理学科知识与教学能力真题及答案.doc
 2012年河北国家公务员申论考试真题及答案-省级.doc
 2020-2021学年江苏省扬州市江都区邵樊片九年级上学期数学第一次质量检测试题及答案.doc
 2022下半年黑龙江教师资格证中学综合素质真题及答案.doc