Bi-Histogram Equalization with a Plateau Limit
for Digital Image Enhancement
Chen Hee Ooi, Student Member, IEEE, Nicholas Sia Pik Kong, Student Member, IEEE,
and Haidi Ibrahim, Member, IEEE
that requires a short processing
Abstract — Many histogram equalization based methods
have been introduced for the use in consumer electronics in
recent years. Yet, many of these methods are relatively
complicated to be implemented, and mostly require a high
computational time. Furthermore, some of the methods
require several predefined parameters from the user, which
make the optimal results cannot be obtained automatically.
Therefore, this paper presents Bi-Histogram Equalization
with a Plateau Level (BHEPL) as one of the options for the
system
image
enhancement. First, BHEPL divides the input histogram into
two independent sub-histograms. This is done in order to
maintain the mean brightness. Then, these sub-histograms
are clipped based on the calculated plateau value. By doing
this, excessive enhancement can be avoided. Experimental
results show that this method only requires 34.20ms, in
average, to process images of size 3648×2736 pixels (i.e. 10
Mega pixels images). The proposed method also gives better
enhancement results as compared with some multi-sections
mean brightness preserving histogram equalization methods1.
Index Terms — Image contrast enhancement, histogram
equalization, brightness preserving enhancement, clipped
histogram equalization.
time
I. INTRODUCTION
Global Histogram Equalization (GHE), although is simple to be
implemented, and one of the popular methods for digital image
enhancement, this method is not suitable to be implemented in
consumer electronic products, such as television, digital camera,
and camcorder. This is because GHE tends to cause level
saturation effects in small but visually important areas [1]. This
saturation effect, not only degrades the appearance of the image,
but it also leads to information lost [2]. Furthermore, the excessive
change in brightness level introduce by GHE leads to annoying
artifacts and unnatural enhancement. The noise level in the image
is also enhanced or magnified significantly [3]. Thus, although
GHE can increase the brightness level in the image, this method
might significantly degrade the quality of the image.
The idea of keeping the mean brightness of an image for
consumer electronic products is first introduced by Kim [4]. By
preserving the mean brightness, it is not only can maintain the
artistic value of the image, but it is also proven that this
methodology can reduce the saturation effect, and able to avoid
unnatural enhancement and annoying artifacts on the output
image.
The mean brightness preserving histogram equalization
(MBPHE) methods basically can be divided into two main
groups, which are bisections MBPHE, and multi-sections
MBPHE. Bisections MBPHE group is the simplest group of
MBPHE. Fundamentally, these methods separate the input
histogram into two sections. These two histogram sections are
then equalized independently. The major difference among
the methods in this family is the criteria used to divide the
input histogram.
Brightness preserving Bi-Histogram
Equalization (BBHE) [4] and Quantized Bi-Histogram
Equalization (QBHE) [5] use the average intensity value as
their
Dual Sub-Image Histogram
Equalization (DSIHE) [6] uses the median intensity value as
the separating point. Minimum Mean Brightness Error Bi-HE
(MMBEBHE) [7],[8] uses the separating point that produces
the smallest Absolute Mean Brightness Error (AMBE).
separating point.
However, bisections MBPHE can preserve the mean
brightness only to a certain extent. However, some cases do
require higher degree of preservation to avoid unpleasant
artifacts [9]. Furthermore, bisections MBPHE can only
preserve the original mean brightness if and only if the input
histogram has a quasi-symmetrical distribution around its
separating point [10]. But, most of the input histograms do
not have this property. This condition leads to the failure of
bisections MBPHE in preserving the mean intensity in real life
applications.
Works in [9], [11]-[21] are a few of multi-sections
MBPHE. Multi-sections MBPHE group has a better mean
brightness preservation as compared with the group of bi-
sections MBPHE. In multi-sections MBPHE, the input
histogram is divided into R sub-histograms, where R is any
positive integer value. Each sub-histogram is then equalized
independently. The creation of the sub-histograms can be
carried out recursively (e.g. by using the mean or median
intensity value), or based on the shape of the input histogram
itself (e.g. using the locations of local maximum or local
minimum).
1This work is partly supported by Ministry of Science, Technology and
Innovation Malaysia, under ScienceFund Grant SF-01-01-05-SF0255, and by
Universiti Sains Malaysia under Postgraduate Fellowship Scheme, Incentive
Grant, and Research Universiti Postgraduate Research Grant.
Chen Hee Ooi is with the School of Electrical and Electronic Engineering,
Engineering Campus, Universiti Sains Malaysia, 14300 Nibong Tebal,
Penang, Malaysia (e-mail: chooi86@hotmail.com).
Nicholas Sia Pik Kong is with the School of Electrical and Electronic
Engineering, Engineering Campus, Universiti Sains Malaysia, 14300 Nibong
Tebal, Penang, Malaysia (e-mail: pik_kong@ieee.org).
Haidi Ibrahim is with the School of Electrical and Electronic Engineering,
Engineering Campus, Universiti Sains Malaysia, 14300 Nibong Tebal,
Penang, Malaysia (e-mail: haidi_ibrahim@ieee.org).
Contributed Paper
Manuscript received August 25, 2009 0098 3063/09/$20.00 © 2009 IEEE
2072IEEE Transactions on Consumer Electronics, Vol. 55, No. 4, NOVEMBER 2009�
Yet, in these methods, the detection of the separating
points’ process normally requires complicated algorithms,
which then associated with relatively high computational
time. Furthermore, these methods usually increase the
hardware
for
consumer electronic products. In addition, most of these
methods put too much constrain on keeping the mean
intensity value.
As a consequence, not much
enhancement could be obtained from most of these
methods.
implementations
requirement
the
in
One type of histogram equalization based methods that
is still not being fully studied for the use in consumer
electronic products is the clipped histogram equalization.
By altering the input histogram before the equalization is
taking place, clipped histogram equalization methods are
able to control the enhancement rate. As a consequence,
these methods can avoid over amplification of noise in the
image.
Example of clipped histogram equalization
methods are Histogram Equalization with Bin Underflow
and Bin Overflow (BUBOHE) [22], Weighted and
Thresholded Histogram Equalization (WTHE) [1], Gain-
Controllable Clipped Histogram Equalization (GC-CHE)
[23], Self-Adaptive Plateau Histogram Equalization
(SAPHE) [24], and Modified SAPHE (MSAPHE) [25].
Unfortunately, in order to obtain a good enhancement
result, BUBOHE, WTHE and GC-CHE require the user to
manually set the parameters’ value. Thus, these methods
are not so suitable to be used in an automated image
enhancement system. SAPHE selects its parameter value
automatically, based on the median value of the local
peaks of the corresponding input histogram. However, in
some cases, SAPHE fails to detect any local peaks in the
image, and therefore fails to set its parameter [25].
MSAPHE
this problem.
MSAPHE sets the plateau limit as the median value of the
non-empty histogram bins.
to overcome
introduced
is
In this paper, we combine bi-sections MBPHE (i.e.
BBHE) with clipped histogram equalization. This paper
is organized as follow. Section II will briefly explain
histogram equalization, which is the backbone of this
project. Introduction to clipped histogram equalization
will also be included. Section III will present our
methodology. The experimental results will be shown in
Section IV, and Section V is our conclusion.
II. HISTOGRAM EQUALIZATION
A. Transformation Function for Histogram Equalization
For a given image X, the histogram for intensity x, h(x) is
defined as:
xh
(1)
)(
,
where nx is the number of occurrence of intensity x in the
image. The probability density function, p(x) is given by:
,...,1,0
for
L
=
−
=
n
1
x
x
xp
)(
=
xh
,)(
N
for
x
=
,...,1,0
L
−
1
(2)
with N is the total number of pixels in the image. Then, the
cumulative density function, c(x) is defined by (3).
xc
)(
=
x
∑
Xk
=
0
kp
)(
(3)
0
=
).
xcX
X
)(
L −
1
−
the output
(4)
image produce by histogram
The transformation function f(x) for the standard histogram
equalization maps the input image into the entire dynamic
range, [X0, XL-1], by using c(x). This is given by the following
equation.
xf
X
)(
(
+
0
From here,
equalization, Y={Y(i,j)}, can be expressed as:
Y
(5)
where (i,j) are the spatial coordinates of the pixel in the image.
However, a better histogram equalization transformation
function has been suggested in [26]. Therefore, in our
implementation, this modified transformation function has
been employed instead of (4). This improved transformation
function is given as:
xf
)(
−
[
])(5.0)(
xp
xc
).
jiXf
,(
({
jiY
)},({
jiX
),(
(6)
|))
X
∈
∀
X
X
X
=
=
−
+
=
}
(
0
L
1
−
0
B. Clipped Histogram Equalization
Histogram equalization stretches the contrast of the high
histogram regions, and compresses the contrast of the low
histogram regions [19]. As a consequence, when the object of
interest in an image only occupies a small portion of the
image, this object will not be successfully enhanced by
histogram equalization. This method also extremely pushes
the intensities towards the right or the left side of the
histogram, causes level saturation effects.
Clipped histogram equalization methods try to overcome
these problems by restricting the enhancement rate. For
histogram equalization methods, the enhancement is obtained
from the transformation function. As given by (4) or (6), it is
known that the enhancement from histogram equalization is
heavily dependent to c(x). Therefore the enhancement rate is
proportional to the rate of c(x). The rate of c(x) is given by
the following equation:
d
dx
Therefore, if we want to limit the enhancement rate, we can do
so by limiting the value of p(x), or h(x) [27].
Therefore, clipped histogram equalization modifies the
shape of the input histogram by reducing or increasing the
value in the histogram’s bins based on a threshold limit before
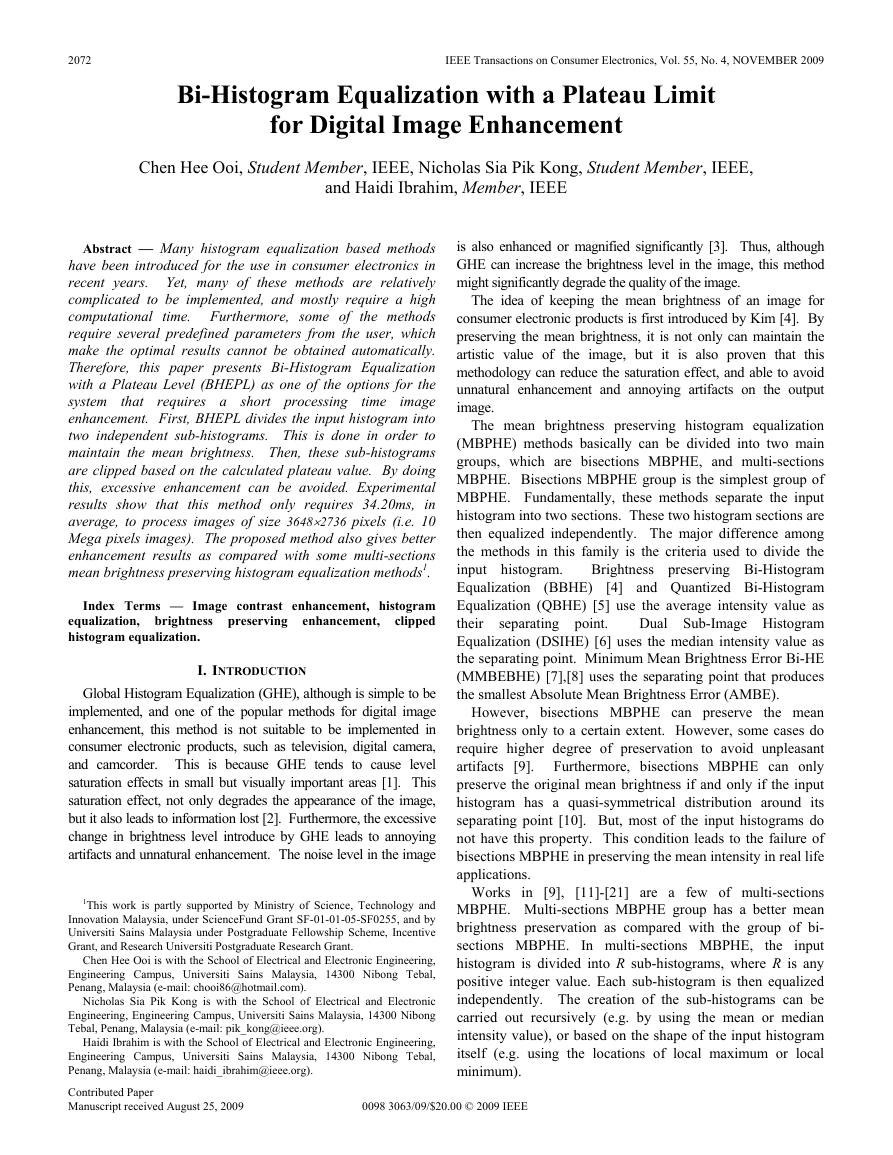
the equalization is taking place. An example is shown in Fig.
1.
xp
)(
xc
)(
(7)
=
This threshold limit is also known as the clipping limit, or
the plateau level of the histogram. The histogram will be
clipped based on this threshold value. The clipped portion is
then redistributed back into the histogram in some cases.
Histogram equalization is then carried out using this modified
histogram.
There are two major problem associated with clipped
histogram equalization. First, most of the methods need the
user to set manually the plateau level of the histogram, which
C. H. Ooi et al.: Bi-Histogram Equalization with a Plateau Limit for Digital Image Enhancement2073�
make these methods not suitable for automatic systems.
SAPHE selects the plateau level automatically, but the process
is relatively complicated, and sometimes fails in its execution.
Second, some of the methods put weight to the modified
histogram. The weight factor is also dependent to the user.
Therefore, we simplified the method of clipped histogram
equalization by assigned the plateau limit automatically, based
on a simple calculation, in order to make it more suitable for
an automated system. This will be described in the next
section.
III. METHODOLOGY
This section describes the methodology of Bi-Histogram
Equalization with a Plateau Value (BHEPL). First, similar to
BBHE [4], the average intensity of the input image, Xm, is
calculated. Then, BHEPL decomposes the input image into
two sub-images XL and XU based on Xm as given in (8) to
(10).
XX
=
(8)
L X
∪
U
where
{
X
jiXjiX
),(
=
|),(
(9)
≤
X
,
∀
jiX
),(
∈
}X
,
m
m
=
>
X
∀
∈
}X
|),(
jiX
),(
{
jiXjiX
),(
L
and
X
(10)
U
Note that the sub-image XL is composed of {X0, X1, .., Xm},
and the another sub-image XU is composed of {Xm+1, Xm+2, ..,
XL-1}. Actually, this condition separates the input histogram
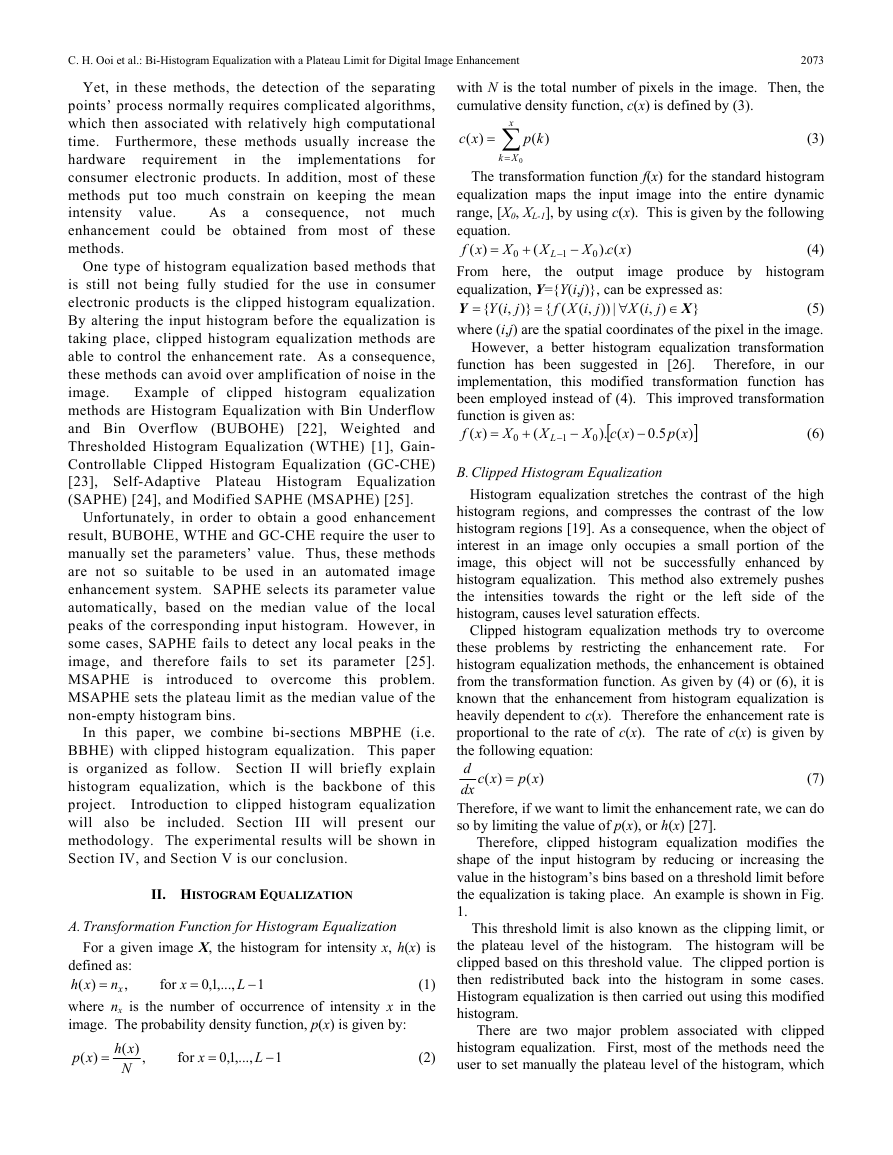
into two sections, as shown in Fig. 2(a).
The histogram created from XL is denoted as hL, and the
histogram created from XU is denoted as hU. By using these
histograms, BHEPL finds two plateau limits TL and TU, for XU
and XL, respectively (see Fig. 2(b)). The values for TL and TU
are set automatically, by using (11) and (12).
mX
∑
=
0
k
1
X
m
+
1
T
L
=
and
kh
)(
L
T
U
=
1
)1
−−
(
L
X
m
X
1
L
∑−
Xk
=
m
kh
)(
U
1
+
(11)
(12)
As given by (11) TL is actually the average of hL. Similarly,
from (12), TU is the average of hU.
Next, in order to control the enhancement rate of BHEPL,
sub-histograms hL and hU are clipped as given in (13) and
(14). This is shown in Fig. 2(c). The clipped histogram
versions are denoted as hCL and hCU.
L
T
h
CL
x
)(
=
xh
)(
⎧
L
⎨
T
⎩
L
xh
)(
L
if
≤
elsewhere
(13)
and
h
UL
x
)(
=
xh
)(
⎧
U
⎨
T
⎩
U
xh
)(
U
if
≤
elsewhere
T
U
(14)
By clipping the histogram using the plateau limit as the
average of
the
enhancement rate of BHEPL will not be beyond the
enhancement rate of an ideal histogram equalized image (i.e.
intensity occurrence,
the number of
(a)
(b)
(c)
(d)
Fig. 1. An example of the process in clipped histogram equalization
method. (a) The original input histogram. (b) The setting of the plateau
limit. (c) The clipping of the histogram based on the plateau limit. (d) In
some cases, the clipped portion is redistributed back into the modified
histogram.
The process also requires further processing time. Methods
that require the redistribution of the clipped portion increase
the complexity of them.
2074IEEE Transactions on Consumer Electronics, Vol. 55, No. 4, NOVEMBER 2009�
an image with a flat histogram). The input image with a good
contrast and high entropy value normally will have an almost
flat histogram. For this case, not much portions from the
input histogram will be clipped. For poor contrast image, the
input histogram is normally being dominated by a certain
range of intensity values. By using plateau values, the
histogram bins in these ranges will be clipped in order to
avoid intensity saturation in the output image.
(a)
(b)
(c)
Fig. 2. An example of the process in BHEPL. (a) The original input
histogram is divided into two based on Xm. (b) The setting of the plateau
limits. (c) The clipping of the histogram based on the plateau limits.
After the clipping process, BHEPL defines M1 and M2 as:
M
1
=
M
2
=
mX
∑
0
Xk
=
X
1
L
∑−
Xk
=
m
1
+
CL k
h
)(
CU k
h
)(
(15)
(16)
M1 is actually the total number of samples in XL and M2 is the
total number of samples in XU.
Then, the respective probability density functions for XL
and XU are given by equation (17) and (18).
Xp
L
(
k
)
=
Xp
U
(
k
)
=
Xh
(
L
M
1
Xh
(
U
M
2
k
,)
k
for
=
,...,1,0
m
(17)
k
,)
for
mk
=
+
,1
m
+
,...,2
L
−
1
(18)
Next, the respective cumulative density functions for XL and
XU are defined by using (19) and (20).
Xc
L
(
k
)
=
Xc
U
(
k
)
=
m
j
∑
∑−
0
=
L
1
Xp
L
(
)
j
(
Xp
U
mj
1
+=
)
j
(19)
(20)
L
L
X
L
1
−
m
1
+
m
1
+
=
=
By definition, cL(Xm)=1 and cU(XL-1)=1.
As BHEPL is a histogram equalization based method,
cumulative density functions are used as the transform
functions to assign the new intensity values to the input
image. The transform functions for BHEPL are defined in
(21) and (22).
f
X
x
(21)
(
)(
+
−
m
f
X
x
(22)
)(
(
+
U
The decomposed sub-images are equalized independently
based on their transform functions. Finally, the output image
of BHEPL, Y, is expressed by (23) to (25).
Y
where
X
f
])(
xp
x
5.0)(
−
L
[
c
p
x
5.0)(
).
−
U
U
[
c
).
0
X
−
iY
)},({
X
0
X
])(
x
(23)
X
U
L
and
f
(25)
(
U
It is worth noting that we do not redistribute the clipped
portions back into the modified histogram. As a consequence,
BHEPL is simple to be implemented and less hardware and
circuitries are needed.
iXf
,(
U
}U
X
j
),(
iX
iXf
,(
L
iX
j
),(
(24)
Y
U
}L
Y
L
|))
|))
f
U
X
∪
)
∈
)
=
)
=
∀
∈
f
L
(
∀
{
{
=
=
(
(
L
j
j
(
)
(
j
IV. EXPERIMENTAL RESULTS
In addition to BHEPL, ten other methods have been
implemented for comparison. They are linear stretching (LS),
global histogram equalization (GHE), Brightness Preserving
Bi-Histogram Equalization (BBHE) [4], Dual Sub-Image
Histogram Equalization (DSIHE) [6],
Minimum Mean
Brightness Error Histogram Equalization (MMBEBHE) [7],
Recursive Mean-Separate Histogram Equalization (RMSHE)
[9], Recursive Sub-Image Histogram Equalization (RSIHE)
[13], Multi-Peak Histogram Equalization (MPHE) [11],
Dynamic Histogram Equalization (DHE) [12], and Modified
Self-Adaptive Plateau Histogram Equalization (MSAPHE)
[25]. BBHE, DSIHE and MMBEBHE present the bisections
MBPHE. RMSHE, RSIHE, MPHE and DHE present the
multi-sections MBPHE. MSAPHE presents
the clipped
histogram equalization methods.
C. H. Ooi et al.: Bi-Histogram Equalization with a Plateau Limit for Digital Image Enhancement2075�
(a)
(d)
(g)
(j)
(b)
(e)
(h)
(c)
(f)
(i)
(k)
(l)
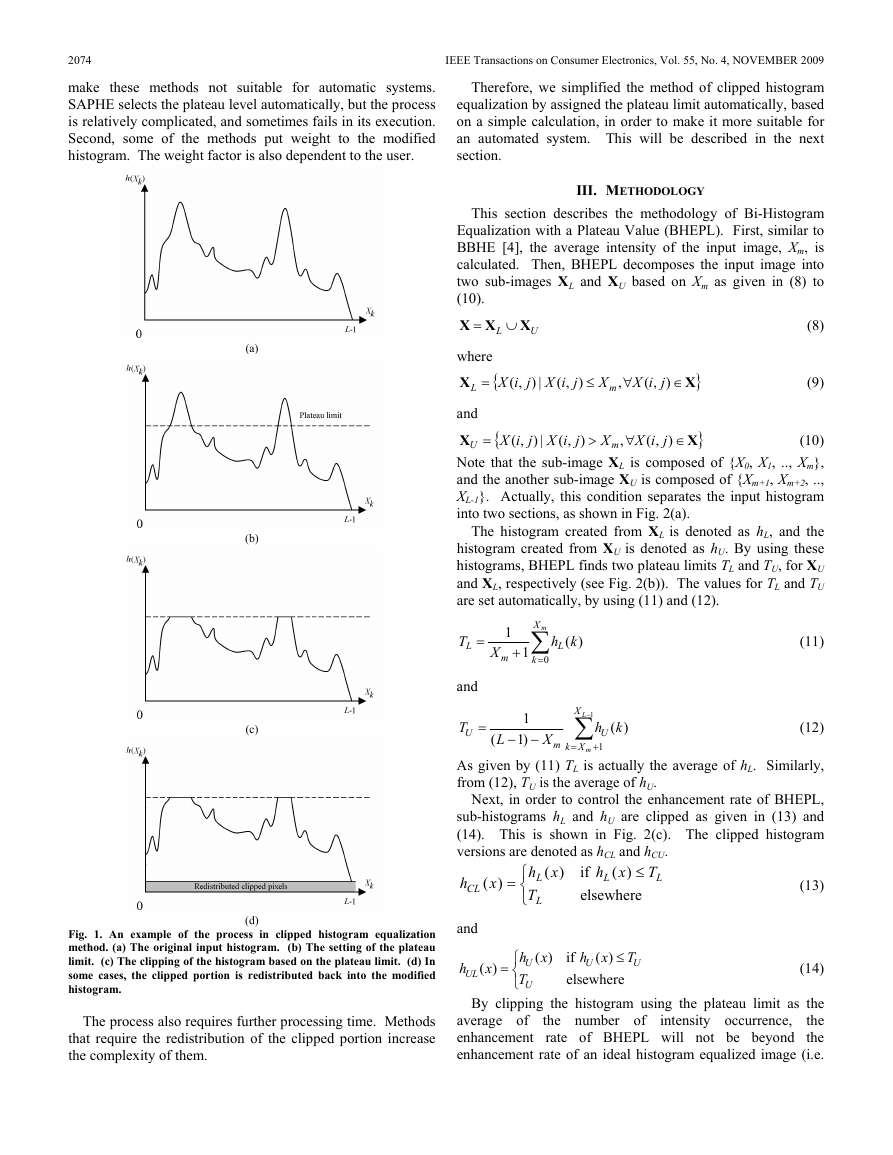
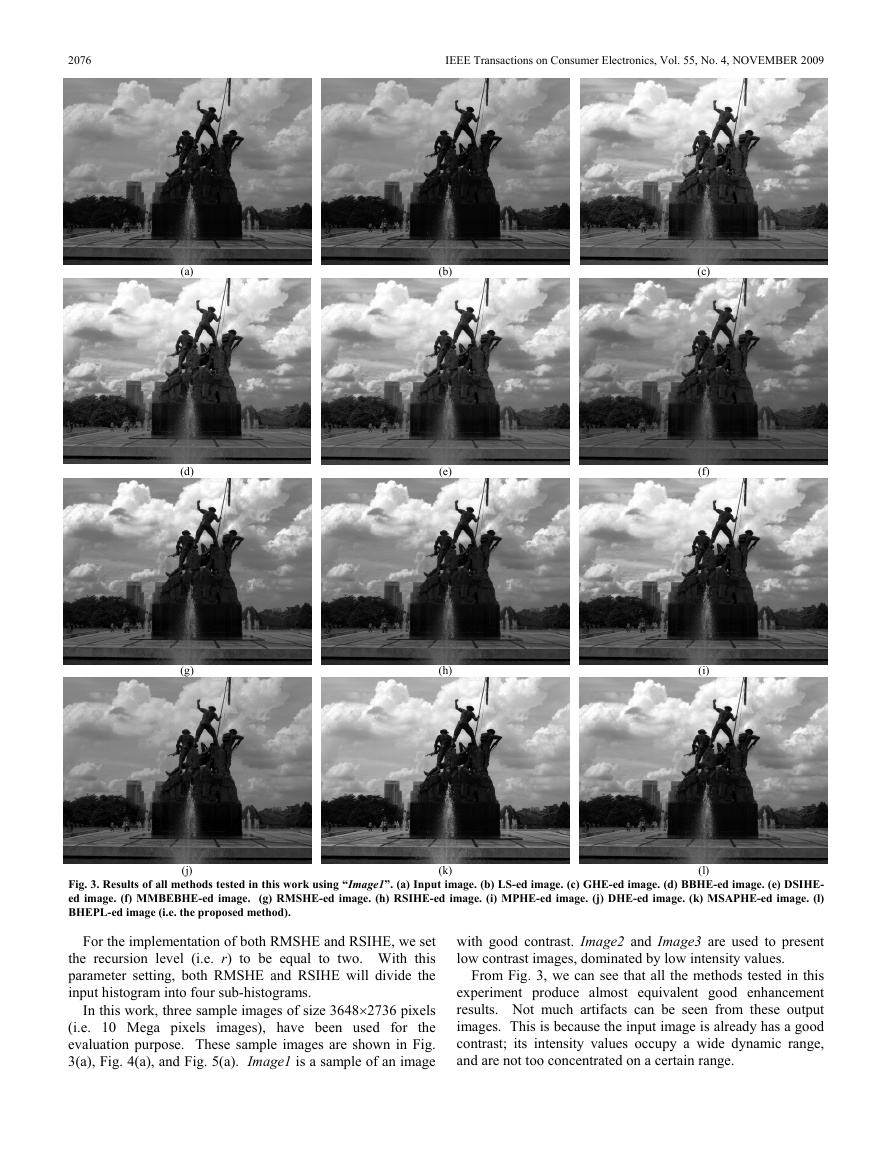
Fig. 3. Results of all methods tested in this work using “Image1”. (a) Input image. (b) LS-ed image. (c) GHE-ed image. (d) BBHE-ed image. (e) DSIHE-
ed image. (f) MMBEBHE-ed image. (g) RMSHE-ed image. (h) RSIHE-ed image. (i) MPHE-ed image. (j) DHE-ed image. (k) MSAPHE-ed image. (l)
BHEPL-ed image (i.e. the proposed method).
For the implementation of both RMSHE and RSIHE, we set
the recursion level (i.e. r) to be equal to two. With this
parameter setting, both RMSHE and RSIHE will divide the
input histogram into four sub-histograms.
In this work, three sample images of size 3648×2736 pixels
(i.e. 10 Mega pixels images), have been used for the
evaluation purpose. These sample images are shown in Fig.
3(a), Fig. 4(a), and Fig. 5(a). Image1 is a sample of an image
with good contrast. Image2 and Image3 are used to present
low contrast images, dominated by low intensity values.
From Fig. 3, we can see that all the methods tested in this
experiment produce almost equivalent good enhancement
results. Not much artifacts can be seen from these output
images. This is because the input image is already has a good
contrast; its intensity values occupy a wide dynamic range,
and are not too concentrated on a certain range.
2076IEEE Transactions on Consumer Electronics, Vol. 55, No. 4, NOVEMBER 2009�
(b)
(e)
(h)
(c)
(f)
(i)
(a)
(d)
(g)
(j)
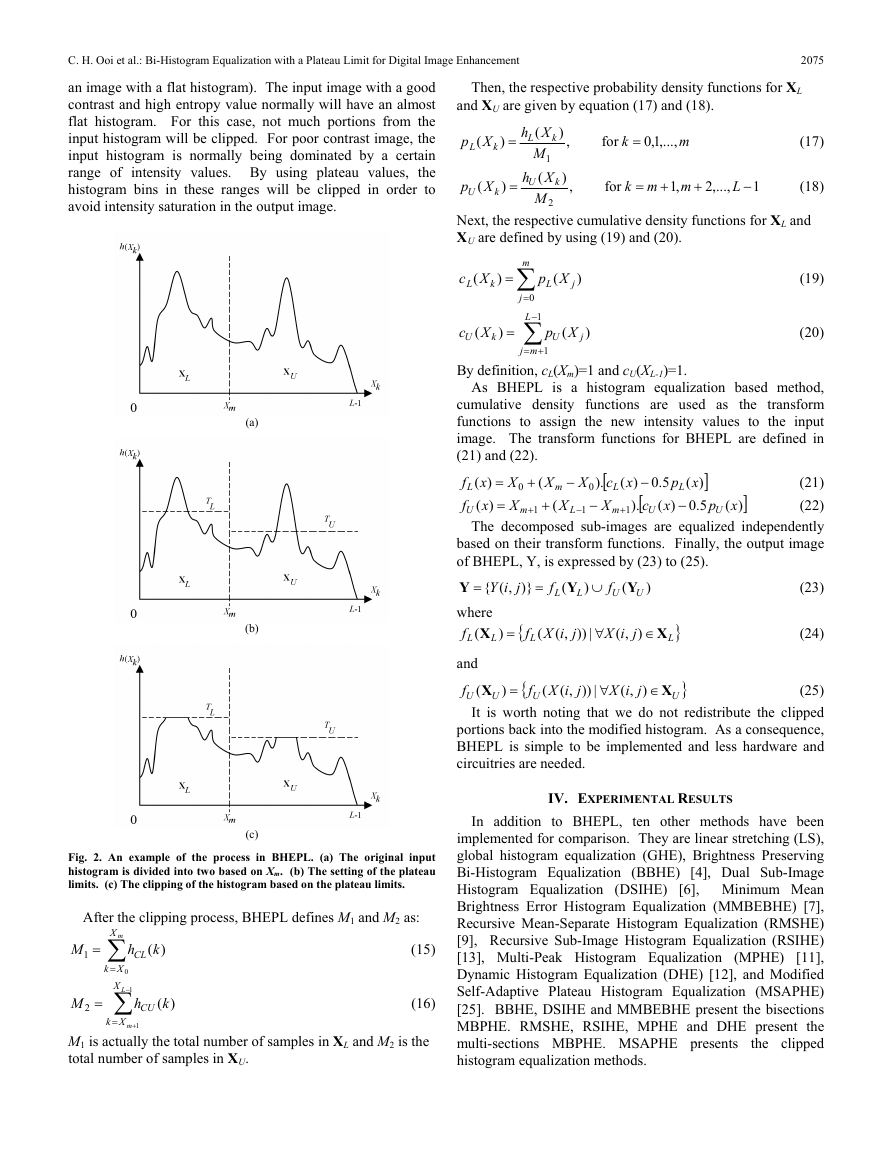
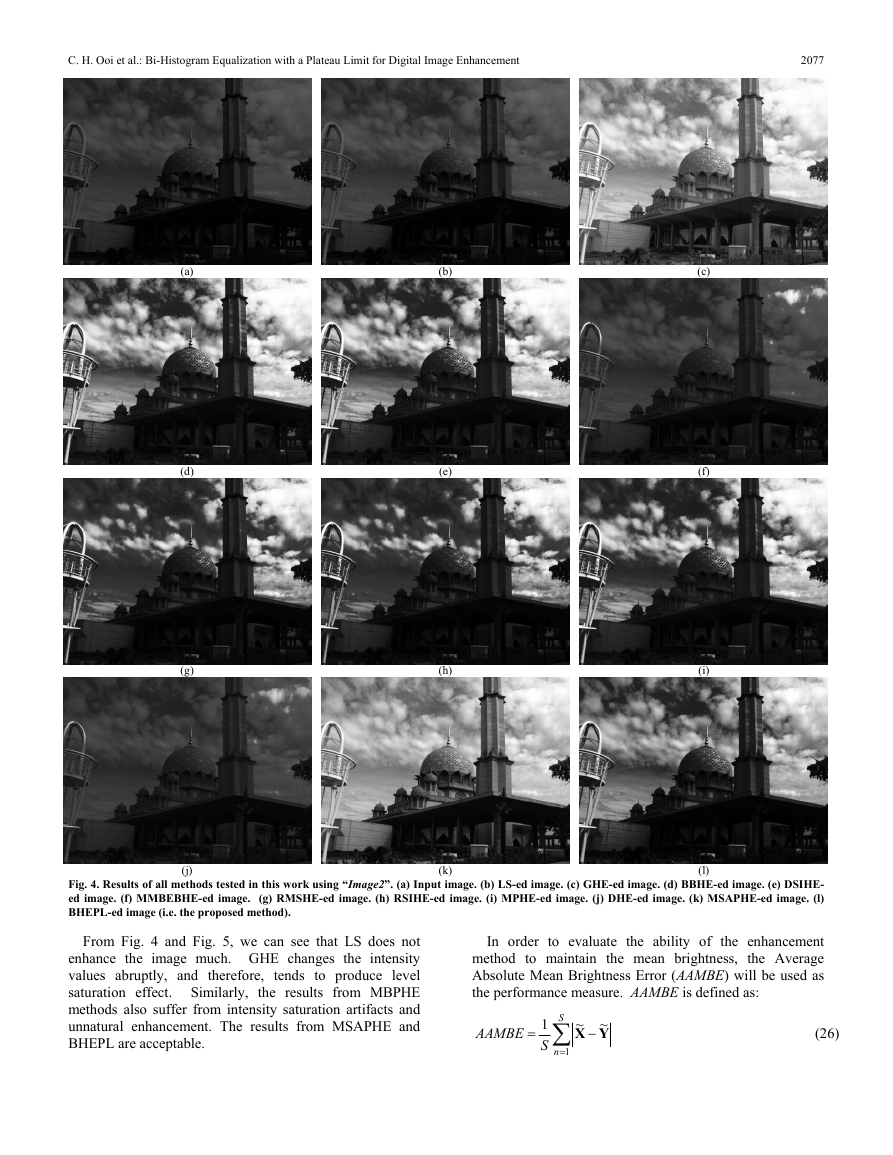
Fig. 4. Results of all methods tested in this work using “Image2”. (a) Input image. (b) LS-ed image. (c) GHE-ed image. (d) BBHE-ed image. (e) DSIHE-
ed image. (f) MMBEBHE-ed image. (g) RMSHE-ed image. (h) RSIHE-ed image. (i) MPHE-ed image. (j) DHE-ed image. (k) MSAPHE-ed image. (l)
BHEPL-ed image (i.e. the proposed method).
(k)
(l)
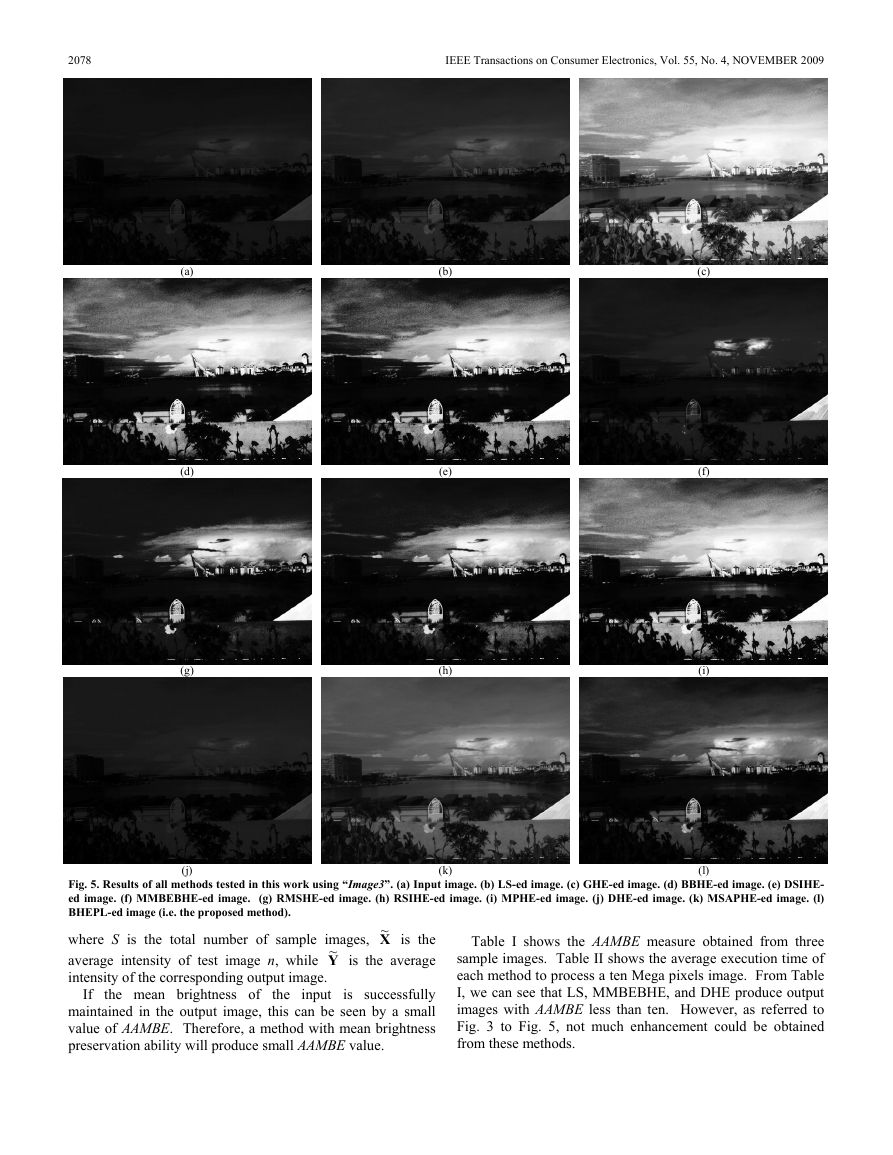
From Fig. 4 and Fig. 5, we can see that LS does not
enhance the image much. GHE changes the intensity
values abruptly, and therefore, tends to produce level
saturation effect. Similarly, the results from MBPHE
methods also suffer from intensity saturation artifacts and
unnatural enhancement. The results from MSAPHE and
BHEPL are acceptable.
In order to evaluate the ability of the enhancement
method to maintain the mean brightness, the Average
Absolute Mean Brightness Error (AAMBE) will be used as
the performance measure. AAMBE is defined as:
AAMBE
=
~
~
YX
−
S
1
∑
nS
1
=
(26)
C. H. Ooi et al.: Bi-Histogram Equalization with a Plateau Limit for Digital Image Enhancement2077�
(a)
(d)
(g)
(j)
(b)
(e)
(h)
(c)
(f)
(i)
(k)
(l)
Fig. 5. Results of all methods tested in this work using “Image3”. (a) Input image. (b) LS-ed image. (c) GHE-ed image. (d) BBHE-ed image. (e) DSIHE-
ed image. (f) MMBEBHE-ed image. (g) RMSHE-ed image. (h) RSIHE-ed image. (i) MPHE-ed image. (j) DHE-ed image. (k) MSAPHE-ed image. (l)
BHEPL-ed image (i.e. the proposed method).
where S is the total number of sample images, X~ is the
average intensity of test image n, while Y~ is the average
intensity of the corresponding output image.
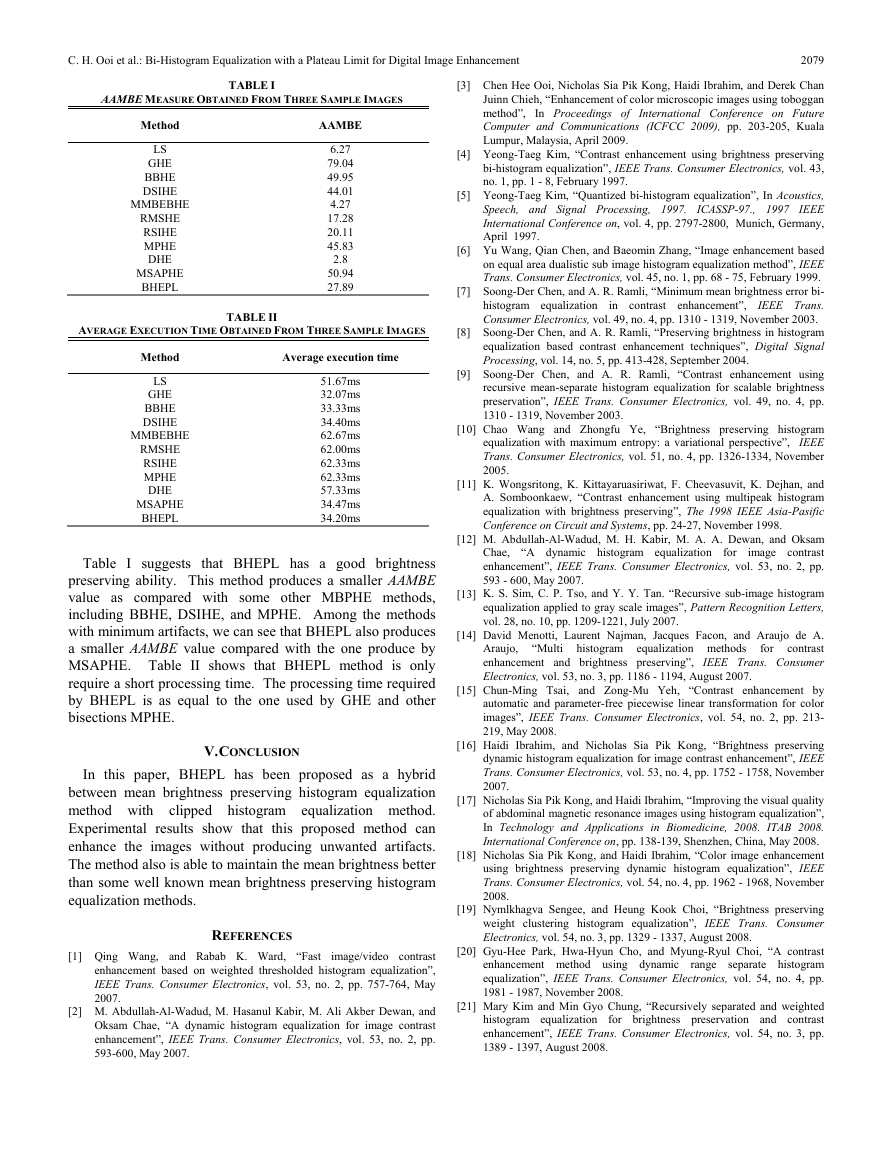
Table I shows the AAMBE measure obtained from three
sample images. Table II shows the average execution time of
each method to process a ten Mega pixels image. From Table
I, we can see that LS, MMBEBHE, and DHE produce output
images with AAMBE less than ten. However, as referred to
Fig. 3 to Fig. 5, not much enhancement could be obtained
from these methods.
If the mean brightness of the input is successfully
maintained in the output image, this can be seen by a small
value of AAMBE. Therefore, a method with mean brightness
preservation ability will produce small AAMBE value.
2078IEEE Transactions on Consumer Electronics, Vol. 55, No. 4, NOVEMBER 2009�
AAMBE MEASURE OBTAINED FROM THREE SAMPLE IMAGES
TABLE I
Method
AAMBE
LS
GHE
BBHE
DSIHE
MMBEBHE
RMSHE
RSIHE
MPHE
DHE
MSAPHE
BHEPL
6.27
79.04
49.95
44.01
4.27
17.28
20.11
45.83
2.8
50.94
27.89
AVERAGE EXECUTION TIME OBTAINED FROM THREE SAMPLE IMAGES
TABLE II
Method
Average execution time
LS
GHE
BBHE
DSIHE
MMBEBHE
RMSHE
RSIHE
MPHE
DHE
MSAPHE
BHEPL
51.67ms
32.07ms
33.33ms
34.40ms
62.67ms
62.00ms
62.33ms
62.33ms
57.33ms
34.47ms
34.20ms
Table I suggests that BHEPL has a good brightness
preserving ability. This method produces a smaller AAMBE
value as compared with some other MBPHE methods,
including BBHE, DSIHE, and MPHE. Among the methods
with minimum artifacts, we can see that BHEPL also produces
a smaller AAMBE value compared with the one produce by
MSAPHE. Table II shows that BHEPL method is only
require a short processing time. The processing time required
by BHEPL is as equal to the one used by GHE and other
bisections MPHE.
V. CONCLUSION
In this paper, BHEPL has been proposed as a hybrid
between mean brightness preserving histogram equalization
method with clipped histogram equalization method.
Experimental results show that this proposed method can
enhance the images without producing unwanted artifacts.
The method also is able to maintain the mean brightness better
than some well known mean brightness preserving histogram
equalization methods.
REFERENCES
[1] Qing Wang, and Rabab K. Ward, “Fast
image/video contrast
enhancement based on weighted thresholded histogram equalization”,
IEEE Trans. Consumer Electronics, vol. 53, no. 2, pp. 757-764, May
2007.
[2] M. Abdullah-Al-Wadud, M. Hasanul Kabir, M. Ali Akber Dewan, and
Oksam Chae, “A dynamic histogram equalization for image contrast
enhancement”, IEEE Trans. Consumer Electronics, vol. 53, no. 2, pp.
593-600, May 2007.
[3] Chen Hee Ooi, Nicholas Sia Pik Kong, Haidi Ibrahim, and Derek Chan
Juinn Chieh, “Enhancement of color microscopic images using toboggan
method”, In Proceedings of International Conference on Future
Computer and Communications (ICFCC 2009), pp. 203-205, Kuala
Lumpur, Malaysia, April 2009.
[4] Yeong-Taeg Kim, “Contrast enhancement using brightness preserving
bi-histogram equalization”, IEEE Trans. Consumer Electronics, vol. 43,
no. 1, pp. 1 - 8, February 1997.
[5] Yeong-Taeg Kim, “Quantized bi-histogram equalization”, In Acoustics,
Speech, and Signal Processing, 1997. ICASSP-97., 1997 IEEE
International Conference on, vol. 4, pp. 2797-2800, Munich, Germany,
April 1997.
[6] Yu Wang, Qian Chen, and Baeomin Zhang, “Image enhancement based
on equal area dualistic sub image histogram equalization method”, IEEE
Trans. Consumer Electronics, vol. 45, no. 1, pp. 68 - 75, February 1999.
[7] Soong-Der Chen, and A. R. Ramli, “Minimum mean brightness error bi-
IEEE Trans.
histogram equalization
Consumer Electronics, vol. 49, no. 4, pp. 1310 - 1319, November 2003.
[8] Soong-Der Chen, and A. R. Ramli, “Preserving brightness in histogram
equalization based contrast enhancement techniques”, Digital Signal
Processing, vol. 14, no. 5, pp. 413-428, September 2004.
in contrast enhancement”,
[9] Soong-Der Chen, and A. R. Ramli, “Contrast enhancement using
recursive mean-separate histogram equalization for scalable brightness
preservation”, IEEE Trans. Consumer Electronics, vol. 49, no. 4, pp.
1310 - 1319, November 2003.
[10] Chao Wang and Zhongfu Ye, “Brightness preserving histogram
equalization with maximum entropy: a variational perspective”, IEEE
Trans. Consumer Electronics, vol. 51, no. 4, pp. 1326-1334, November
2005.
[11] K. Wongsritong, K. Kittayaruasiriwat, F. Cheevasuvit, K. Dejhan, and
A. Somboonkaew, “Contrast enhancement using multipeak histogram
equalization with brightness preserving”, The 1998 IEEE Asia-Pasific
Conference on Circuit and Systems, pp. 24-27, November 1998.
[12] M. Abdullah-Al-Wadud, M. H. Kabir, M. A. A. Dewan, and Oksam
image contrast
Chae, “A dynamic histogram equalization
enhancement”, IEEE Trans. Consumer Electronics, vol. 53, no. 2, pp.
593 - 600, May 2007.
[13] K. S. Sim, C. P. Tso, and Y. Y. Tan. “Recursive sub-image histogram
equalization applied to gray scale images”, Pattern Recognition Letters,
vol. 28, no. 10, pp. 1209-1221, July 2007.
for
[14] David Menotti, Laurent Najman, Jacques Facon, and Araujo de A.
Araujo,
contrast
enhancement and brightness preserving”, IEEE Trans. Consumer
Electronics, vol. 53, no. 3, pp. 1186 - 1194, August 2007.
equalization methods
“Multi histogram
[15] Chun-Ming Tsai, and Zong-Mu Yeh, “Contrast enhancement by
automatic and parameter-free piecewise linear transformation for color
images”, IEEE Trans. Consumer Electronics, vol. 54, no. 2, pp. 213-
219, May 2008.
[16] Haidi Ibrahim, and Nicholas Sia Pik Kong, “Brightness preserving
dynamic histogram equalization for image contrast enhancement”, IEEE
Trans. Consumer Electronics, vol. 53, no. 4, pp. 1752 - 1758, November
2007.
for
[17] Nicholas Sia Pik Kong, and Haidi Ibrahim, “Improving the visual quality
of abdominal magnetic resonance images using histogram equalization”,
In Technology and Applications in Biomedicine, 2008. ITAB 2008.
International Conference on, pp. 138-139, Shenzhen, China, May 2008.
[18] Nicholas Sia Pik Kong, and Haidi Ibrahim, “Color image enhancement
using brightness preserving dynamic histogram equalization”, IEEE
Trans. Consumer Electronics, vol. 54, no. 4, pp. 1962 - 1968, November
2008.
[19] Nymlkhagva Sengee, and Heung Kook Choi, “Brightness preserving
weight clustering histogram equalization”, IEEE Trans. Consumer
Electronics, vol. 54, no. 3, pp. 1329 - 1337, August 2008.
[20] Gyu-Hee Park, Hwa-Hyun Cho, and Myung-Ryul Choi, “A contrast
enhancement method using dynamic
range separate histogram
equalization”, IEEE Trans. Consumer Electronics, vol. 54, no. 4, pp.
1981 - 1987, November 2008.
[21] Mary Kim and Min Gyo Chung, “Recursively separated and weighted
histogram equalization
for brightness preservation and contrast
enhancement”, IEEE Trans. Consumer Electronics, vol. 54, no. 3, pp.
1389 - 1397, August 2008.
C. H. Ooi et al.: Bi-Histogram Equalization with a Plateau Limit for Digital Image Enhancement2079�


 2023年江西萍乡中考道德与法治真题及答案.doc
 2012年重庆南川中考生物真题及答案.doc
 2013年江西师范大学地理学综合及文艺理论基础考研真题.doc
 2020年四川甘孜小升初语文真题及答案I卷.doc
 2020年注册岩土工程师专业基础考试真题及答案.doc
 2023-2024学年福建省厦门市九年级上学期数学月考试题及答案.doc
 2021-2022学年辽宁省沈阳市大东区九年级上学期语文期末试题及答案.doc
 2022-2023学年北京东城区初三第一学期物理期末试卷及答案.doc
 2018上半年江西教师资格初中地理学科知识与教学能力真题及答案.doc
 2012年河北国家公务员申论考试真题及答案-省级.doc
 2020-2021学年江苏省扬州市江都区邵樊片九年级上学期数学第一次质量检测试题及答案.doc
 2022下半年黑龙江教师资格证中学综合素质真题及答案.doc