Sentinel-1 Toolbox
TOPS Interferometry Tutorial
Issued May 2015
Updated August 2016
Luis Veci
Copyright © 2015 Array Systems Computing Inc. http://www.array.ca/
http://step.esa.int
�
TOPS Interferometry Tutorial
Interferometry Tutorial
The goal of this tutorial is to provide novice and experienced remote sensing users with step-by-
step instructions on interferometric processing with Sentinel-1 Interferometric Wideswath
products.
What is Interferometry?
Interferometric synthetic aperture radar (InSAR) exploits the phase difference between two
complex radar SAR observations taken from slightly different sensor positions and extracts
information about the earth’s surface.
A SAR signal contains amplitude and phase information. The amplitude is the strength of the
radar response and the phase is the fraction of one complete sine wave cycle (a single SAR
wavelength). The phase of the SAR image is determined primarily by the distance between the
satellite antenna and the ground targets.
By combining the phase of these two images after coregistration, an interferogram can be
generated whose phase is highly correlated to the terrain topography.
For an introduction to interferometric concepts, please see ESA’s InSAR Principles: Guidelines
for SAR Interferometry Processing and Interpretation (ESA TM-19).
Sentinel-1 Interferometric Wide Swath Products
The Interferometric Wide (IW) swath mode is the main acquisition mode over land for Sentinel-1.
It acquires data with a 250 km swath at 5 m by 20 m spatial resolution (single look). IW mode
captures three sub-swaths using Terrain Observation with Progressive Scans SAR (TOPSAR).
With the TOPSAR technique, in addition to steering the beam in range as in ScanSAR, the beam
is also electronically steered from backward to forward in the azimuth direction for each burst,
avoiding scalloping and resulting in homogeneous image quality throughout the swath.
TOPSAR mode replaces the conventional ScanSAR mode, achieving the same coverage and
resolution as ScanSAR, but with a nearly uniform SNR (Signal-to-Noise Ratio) and DTAR
(Distributed Target Ambiguity Ratio).
2
�
TOPS Interferometry Tutorial
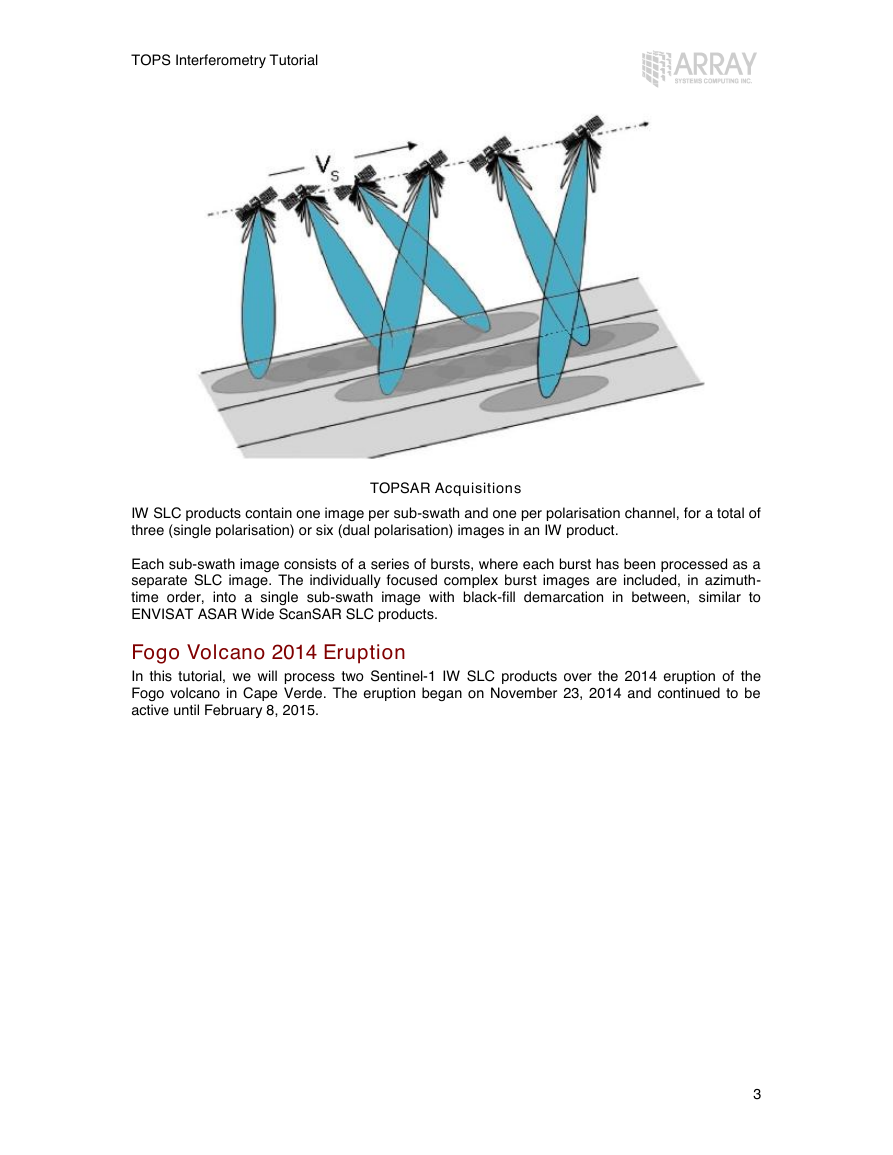
TOPSAR Acquisitions
IW SLC products contain one image per sub-swath and one per polarisation channel, for a total of
three (single polarisation) or six (dual polarisation) images in an IW product.
Each sub-swath image consists of a series of bursts, where each burst has been processed as a
separate SLC image. The individually focused complex burst images are included, in azimuth-
time order, into a single sub-swath image with black-fill demarcation in between, similar to
ENVISAT ASAR Wide ScanSAR SLC products.
Fogo Volcano 2014 Eruption
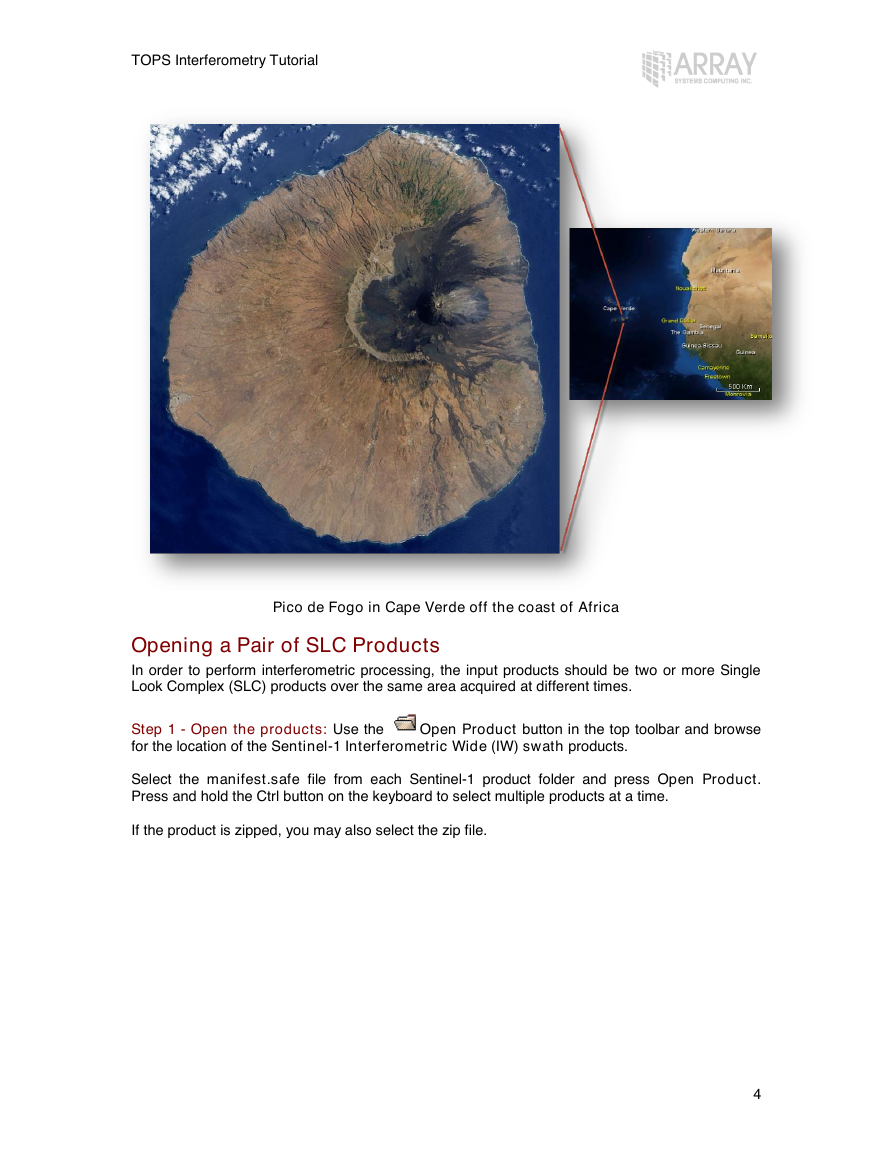
In this tutorial, we will process two Sentinel-1 IW SLC products over the 2014 eruption of the
Fogo volcano in Cape Verde. The eruption began on November 23, 2014 and continued to be
active until February 8, 2015.
3
�
TOPS Interferometry Tutorial
Pico de Fogo in Cape Verde off the coast of Africa
Opening a Pair of SLC Products
In order to perform interferometric processing, the input products should be two or more Single
Look Complex (SLC) products over the same area acquired at different times.
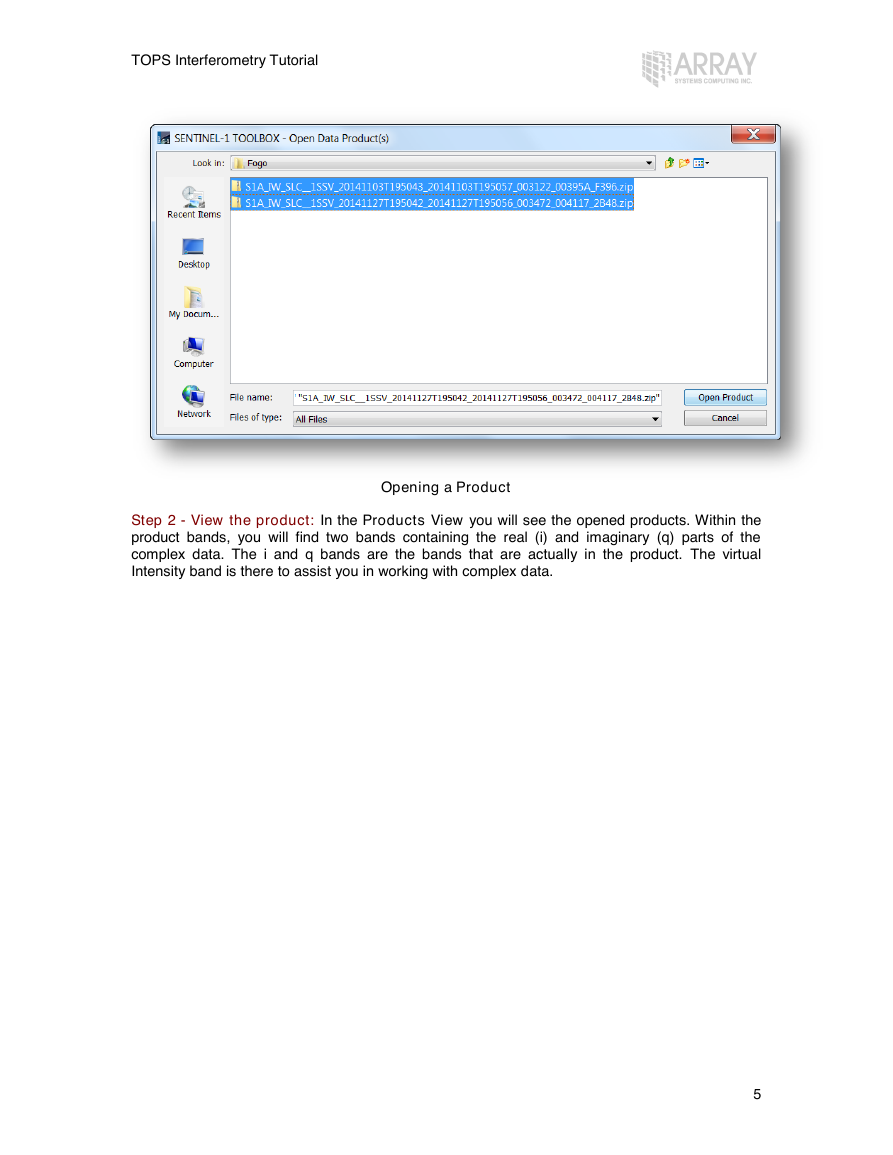
Open Product button in the top toolbar and browse
Step 1 - Open the products: Use the
for the location of the Sentinel-1 Interferometric Wide (IW) swath products.
Select the manifest.safe file from each Sentinel-1 product folder and press Open Product.
Press and hold the Ctrl button on the keyboard to select multiple products at a time.
If the product is zipped, you may also select the zip file.
4
�
TOPS Interferometry Tutorial
Opening a Product
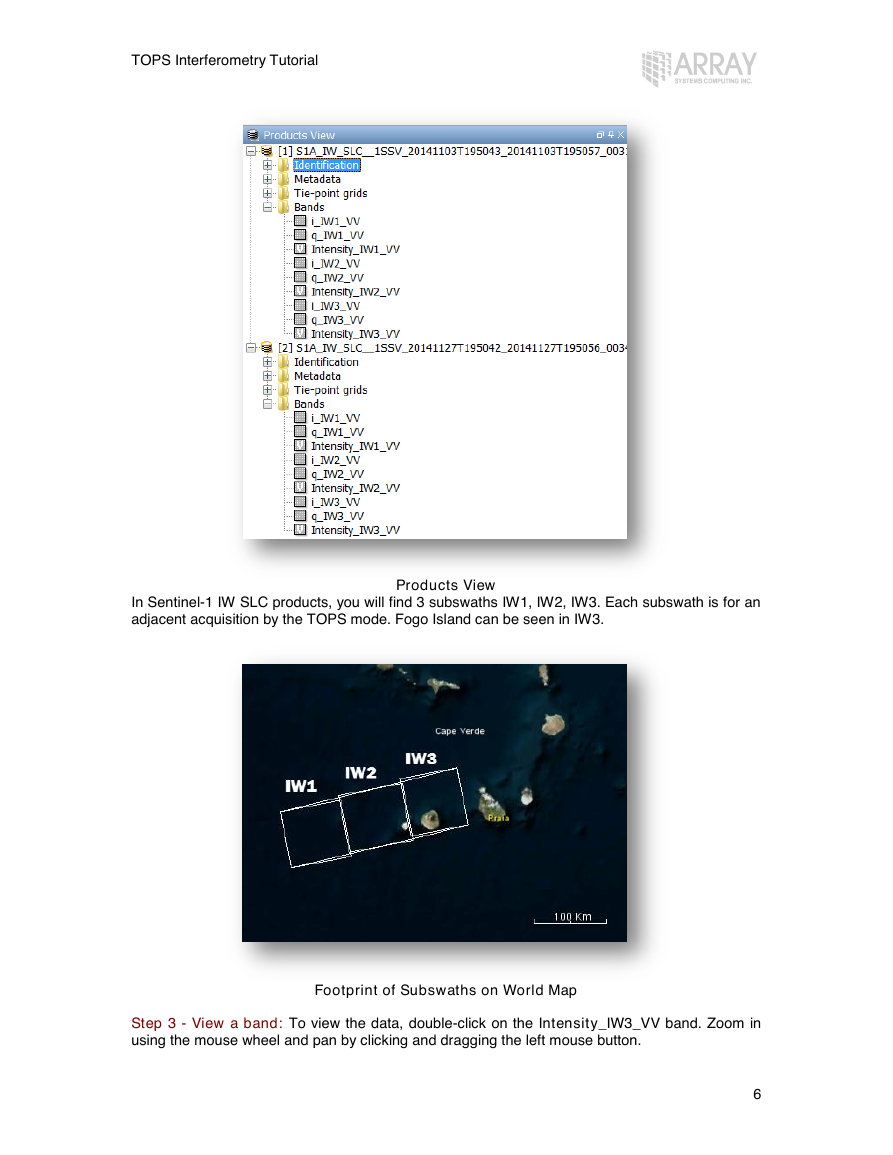
Step 2 - View the product: In the Products View you will see the opened products. Within the
product bands, you will find two bands containing the real (i) and imaginary (q) parts of the
complex data. The i and q bands are the bands that are actually in the product. The virtual
Intensity band is there to assist you in working with complex data.
5
�
TOPS Interferometry Tutorial
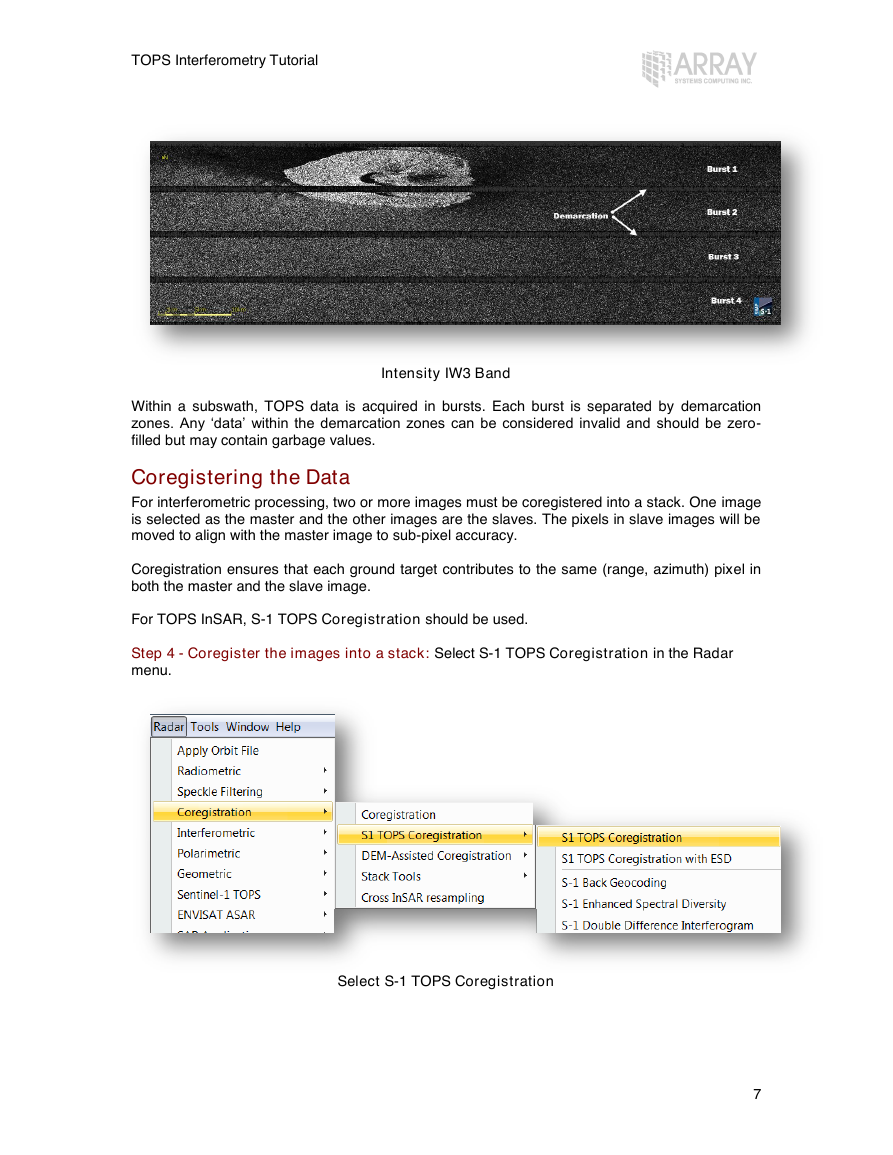
In Sentinel-1 IW SLC products, you will find 3 subswaths IW1, IW2, IW3. Each subswath is for an
adjacent acquisition by the TOPS mode. Fogo Island can be seen in IW3.
Products View
Footprint of Subswaths on World Map
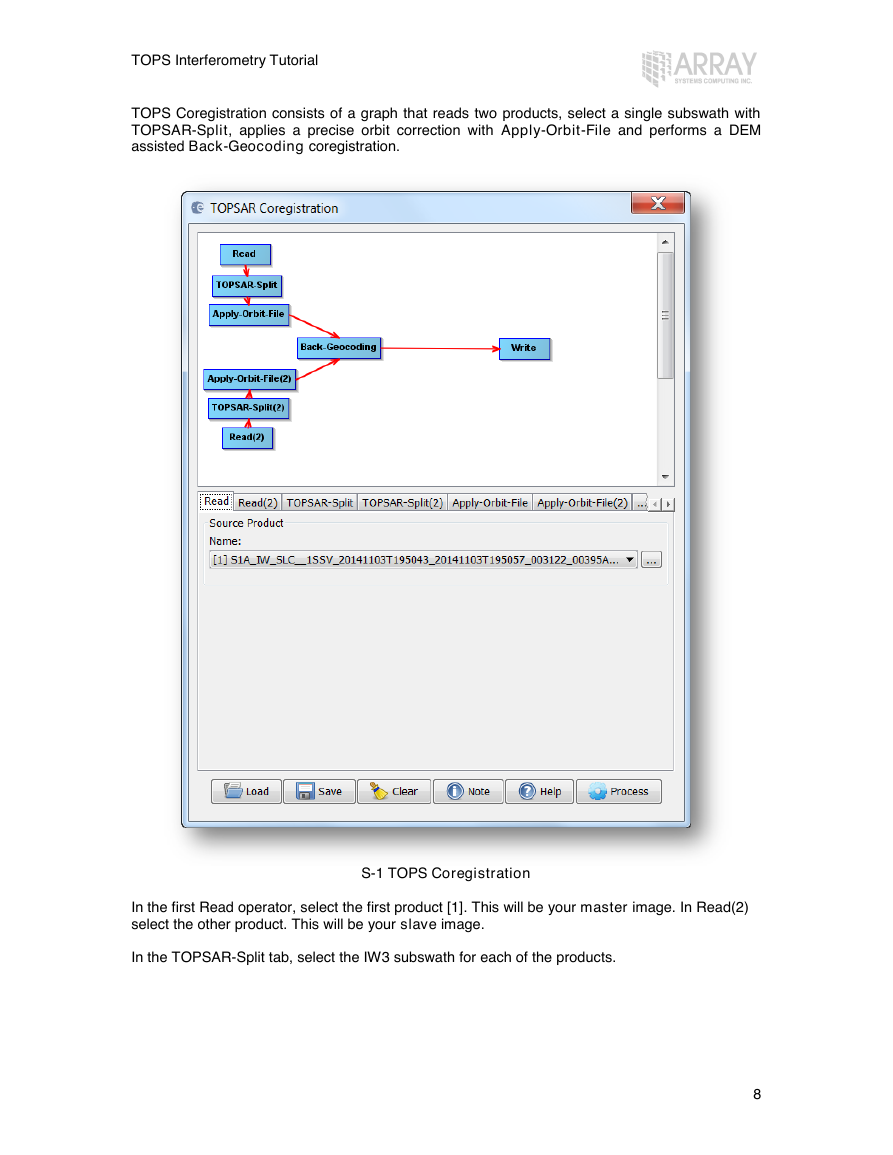
Step 3 - View a band: To view the data, double-click on the Intensity_IW3_VV band. Zoom in
using the mouse wheel and pan by clicking and dragging the left mouse button.
6
�
TOPS Interferometry Tutorial
Intensity IW3 Band
Within a subswath, TOPS data is acquired in bursts. Each burst is separated by demarcation
zones. Any ‘data’ within the demarcation zones can be considered invalid and should be zero-
filled but may contain garbage values.
Coregistering the Data
For interferometric processing, two or more images must be coregistered into a stack. One image
is selected as the master and the other images are the slaves. The pixels in slave images will be
moved to align with the master image to sub-pixel accuracy.
Coregistration ensures that each ground target contributes to the same (range, azimuth) pixel in
both the master and the slave image.
For TOPS InSAR, S-1 TOPS Coregistration should be used.
Step 4 - Coregister the images into a stack: Select S-1 TOPS Coregistration in the Radar
menu.
Select S-1 TOPS Coregistration
7
�
TOPS Interferometry Tutorial
TOPS Coregistration consists of a graph that reads two products, select a single subswath with
TOPSAR-Split, applies a precise orbit correction with Apply-Orbit-File and performs a DEM
assisted Back-Geocoding coregistration.
S-1 TOPS Coregistration
In the first Read operator, select the first product [1]. This will be your master image. In Read(2)
select the other product. This will be your slave image.
In the TOPSAR-Split tab, select the IW3 subswath for each of the products.
8
�


 2023年江西萍乡中考道德与法治真题及答案.doc
 2012年重庆南川中考生物真题及答案.doc
 2013年江西师范大学地理学综合及文艺理论基础考研真题.doc
 2020年四川甘孜小升初语文真题及答案I卷.doc
 2020年注册岩土工程师专业基础考试真题及答案.doc
 2023-2024学年福建省厦门市九年级上学期数学月考试题及答案.doc
 2021-2022学年辽宁省沈阳市大东区九年级上学期语文期末试题及答案.doc
 2022-2023学年北京东城区初三第一学期物理期末试卷及答案.doc
 2018上半年江西教师资格初中地理学科知识与教学能力真题及答案.doc
 2012年河北国家公务员申论考试真题及答案-省级.doc
 2020-2021学年江苏省扬州市江都区邵樊片九年级上学期数学第一次质量检测试题及答案.doc
 2022下半年黑龙江教师资格证中学综合素质真题及答案.doc