Downloaded from SPIE Digital Library on 26 Oct 2011 to 222.190.117.202. Terms of Use: http://spiedl.org/terms
N-FINDR: an algorithm for fast autonomous spectral end-memberdetermination in hyperspectral data,Michael E. Winter*, Department of Earth Sciences, University of Queensland (Australia) and TechnicalResearch Associates, Inc. (USA)ABSTRACTThe analysis of hyperspectral data sets requires the determination of certain basis spectra called "end-members". Once thesespectra are found, the image cube can be "unmixed" into the fractional abundance of each material in each pixel. There existseveral techniques for accomplishing the determination of the end-members, most of which involve the intervention of atrained geologist. Often these end-members are assumed to be present in the image, in the form of pure, or unmixed, pixels.In this paper a method based upon the geometry of convex sets is proposed to find a unique set of purest pixels in an image.The technique is based on the fact that in N spectral dimensions, the N-volume contained by a simplex formed of the purestpixels is larger than any other volume formed from any other combination of pixels. The algorithm works by "inflating" asimplex inside the data, beginning with a random set of pixels. For each pixel and each end-member, the end-member isreplaced with the spectrum of the pixel and the volume is recalculated. If it increases, the spectrum of the new pixel replacesthat end-member. This procedure is repeated until no more replacements are done. This algorithm successfully derives end-members in a synthetic data set, and appears robust with less than perfect data. Spectral end-members have been extractedfor the AVIRIS Cuprite data set which closely match reference spectra, and resulting abundance maps match publishedmineral maps.Keywords: end-member, hyperspectral, autonomous1. INTRODUCTIONHyperspectral data represents a challenge from a data-processing point of view, as it can consist of hundreds of bands. Anecessary first step is to reduce the complexity of the image by a dimensionality reduction, which compresses the image datato a few meaningful bands. The most widely used methods for reducing the dimensionality of the data are orthogonalsubspace projections (OSPs) and unmixing the image based on a set of component spectra (end-members). OSPs reduce thedimensionality of the data by fmding the combinations of bands, which best represent the image in some manner. WhileOSPs reduce dimensionality, the resulting images have a mathematical rather than physical relationship with the originalimage. The principal advantage of unmixing an image using end-members it that offers the reduction of the complexity ofthe data set based on a physical set of component spectra. The resulting images are the abundance of the correspondingsubstance for that pixel.In many cases end-member spectra for an image are unknown. The image may be classified using laboratory spectra,however this requires that the image be converted to reflectance. Moreover, the selection of end-members can be non-unique. A more optimal approach is to determine the end-member spectra based solely on the information contained withinthe image itself.A perfect algorithm for the determination of end-members would find end-members directly from the image regardless ofcomposition or noise, without any a priori knowledge. However, due to the mathematical complexity of the problem andimperfections in any real data (the influence of atmosphere, sensor noise etc), a more realistic goal is to determinerecognizable spectra, and produce useful abundance maps. Recognizable spectra allow the determination of the real end-member from a spectral library, while the abundance maps show roughly the relative amount of each end-member in eachpixel.Generally, algorithms which derive end-members directly from an image fall into two broad categories: those which assumethat the end-members themselves are present in the image in the form of pure, or unmixed, pixels, and those which derivethe spectra of the end-members analytically (for example "factor analysis", Harmon, 1967). Pure pixel based techniques,which include this algorithm, the selection of extreme points of an n-dimensional scatter plot, and the "convex-cone"*Correspondence:Email: wintershake2.earthsciences.uq.edu.au; Telephone: +61 7 3876-7319Part ofthe SPIE Conference on lmacjincj Spectrometry V • Denver, Colorado • July 1999266SPIE Vol. 3753 • 0277-786X1991$1O.OO�
Downloaded from SPIE Digital Library on 26 Oct 2011 to 222.190.117.202. Terms of Use: http://spiedl.org/terms
method (Ifarraguerri, 1997), leverage the simplification that the end-members themselves are present in the image. Thisallows a reduction in the scope of the problem by restricting the possible characteristics of the end-members to discrete pointsin spectral-feature-space.The N-FINDR algorithm (Winter, 1999) is essentially an automated technique for finding the purest pixels in an image. Thegoal of the algorithm is to duplicate the successful non-automated technique of selecting extreme points of an n-dimensionalscatter plot. Although this method has its critics (e.g. Craig 1990; 1994) it remains the most widely used and successfullyapplied method for determining end-members without a priori information. N-FINDR attempts to find the simplex ofmaximum volume that can be inscribed within the hyperspectral data set using a simple non-linear inversion. The convexnature of hyperspectral data allows this operation to be performed in a quick and relatively straightforward manner.Subsequent optimizations of the algorithm (not detailed here) have allowed the use of this algorithm at speeds approachingthose required by real-time applications.This work focuses on the performance of the algorithm on both synthetic and real data sets. To illustrate the viability of thealgorithm under realistic circumstances, areal distributions of the minerals alunite, kaolinite and calcite are mapped using theAVIRIS Cuprite Nevada sample image.2. THE ALGORITHMMost methods of determining end-members autonomously from an image make use of the geometric nature of hyperspectraldata (for example, see Craig I 994, Boardman, 1 995).Dataanalysis problems can often be viewed geometrically, with eachobservation occupying a point in a space spanned by all ofthe data (cf. Rawlings, 1988).Generally, the spectra for a given pixel in an image is assumed to be a linear combination ofthe end-member spectra:joy —eIkckJ+k,(1)where p is the i-th band ofthej-th pixel, elkisthe i-th band ofthe k-th end-member, CkJisthe mixing proportions for thej-th pixel from the k-th end-member, and t'isgaussian random error (assumed to be small). Since the pixel compositions areassumed to be percentages, the mixing proportions are should sum to one:kjk(2)The mixing proportions can be visualized as "abundance maps" which depict the fractional composition of the end-membermaterial as a gray level image. Any distribution of data which follows the mixture model outlined in Equations 1 and 2forms a simplex (Lay, 1982) in data space. A simplex is the simplest geometric object which spans a given space, forexample a triangle in two dimensions and a tetrahedron in three dimensions.If CkJ' 1 forany end-member contribution in a pixel, the other end-member contributions must be near zero, and the pixelcan be classified as pure. These pure pixels define the vertices of the N-dimensional scatter plot of the data. Moreover, thesepure pixels define a simple of maximum volume which can be inscribed within the data set. This procedure "inflates" asimplex within the data set in order to determine these pixels. A necessary assumption is that there exists at least one purepixel per end-member species within the image.2.1 Pre-processingIn order for the volume to be determined the dimensionality of the image must be reduced to be one less than the number ofend-members. This is accomplished through an orthogonal subspace projection. OSPs act to compress the information in animage based on a mathematical criteria: maximum power for the singular value decomposition (Rawlings, 1988), maximumvariation for the principal components transform, and noise weighted variation for the Maximum Noise Fraction (MNF)transform (Green, 1988). In theory, the MNF transform offers the best performance, however for thepurposes of thisalgorithm all methods appear to work equally well.267�
Downloaded from SPIE Digital Library on 26 Oct 2011 to 222.190.117.202. Terms of Use: http://spiedl.org/terms
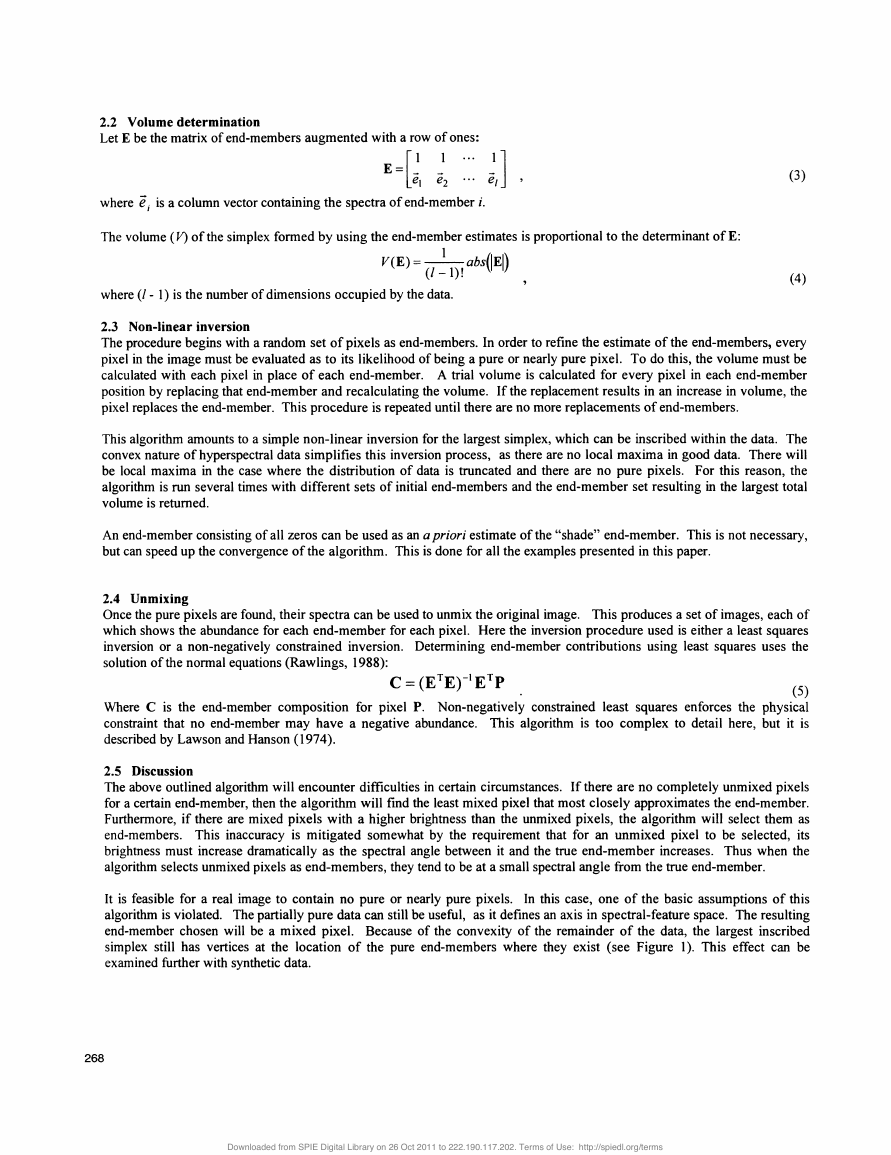
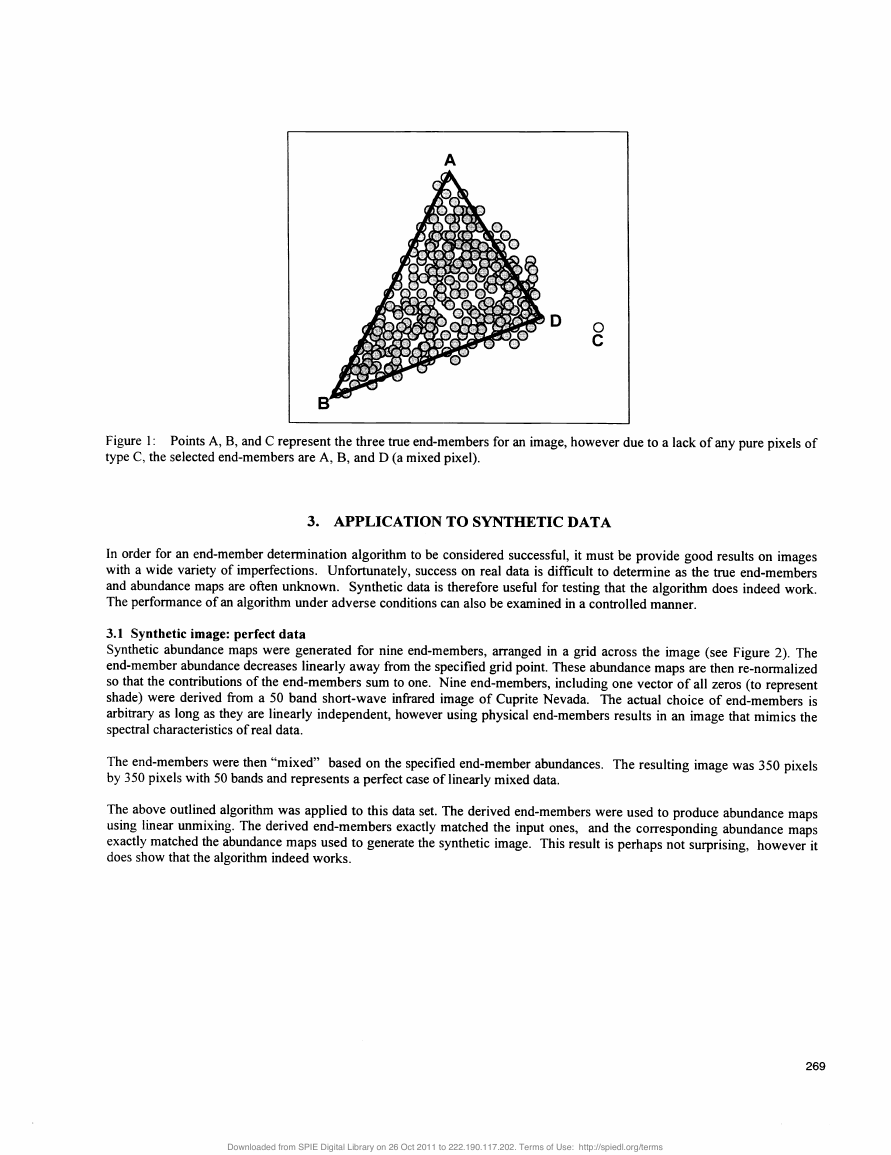
2.2 Volume determinationLet E be the matrix of end-members augmented with a row of ones:[11•..iiE=[. e2'j'(3)whereis a column vector containing the spectra of end-member i.The volume (V) ofthe simplex formed by using the end-member estimates is proportional to the determinant of E:V(E) =,abs(IEI)( -).,(4)where (1 -1)is the number of dimensions occupied by the data.2.3 Non-linear inversionThe procedure begins with a random set of pixels as end-members. In order to refine the estimate of the end-members, everypixel in the image must be evaluated as to its likelihood of being a pure or nearly pure pixel. To do this, the volume mustbecalculated with each pixel in place of each end-member. A trial volume is calculated for every pixel in each end-memberposition by replacing that end-member and recalculating the volume. If the replacement results in an increase in volume, thepixel replaces the end-member. This procedure is repeated until there are no more replacements of end-members.This algorithm amounts to a simple non-linear inversion for the largest simplex, which can be inscribed within the data. Theconvex nature of hyperspectral data simplifies this inversion process, as there are no local maxima in good data. There willbe local maxima in the case where the distribution of data is truncated and there are no pure pixels. For this reason, thealgorithm is run several times with different sets of initial end-members and the end-member set resulting in the largest totalvolume is returned.An end-member consisting ofall zeros can be used as an apriori estimate ofthe "shade" end-member. This is not necessary,but can speed up the convergence ofthe algorithm. This is done for all the examples presented in this paper.2.4 UnmixingOnce the pure pixels are found, their spectra can be used to unmix the original image. This produces a set of images, each ofwhich shows the abundance for each end-member for each pixel. Here the inversion procedure used is either a least squaresinversion or a non-negatively constrained inversion. Determining end-member contributions using least squares uses thesolution ofthe normal equations (Rawlings, 1988):C=(ETE)'ETP.(5)Where C is the end-member composition for pixel P. Non-negatively constrained least squares enforces the physicalconstraint that no end-member may have a negative abundance. This algorithm is too complex to detail here, but it isdescribed by Lawson and Hanson (1974).2.5 DiscussionThe above outlined algorithm will encounter difficulties in certain circumstances. If there are no completely unmixed pixelsfor a certain end-member, then the algorithm will find the least mixed pixel that most closely approximates the end-member.Furthermore, if there are mixed pixels with a higher brightness than the unmixed pixels, the algorithm will select them asend-members. This inaccuracy is mitigated somewhat by the requirement that for an unmixed pixel to be selected, itsbrightness must increase dramatically as the spectral angle between it and the true end-member increases. Thus when thealgorithm selects unmixed pixels as end-members, they tend to be at a small spectral angle from the true end-member.It is feasible for a real image to contain no pure or nearly pure pixels. In this case, one of the basic assumptions of thisalgorithm is violated. The partially pure data can still be useful, as it defines an axis in spectral-feature space. The resultingend-member chosen will be a mixed pixel. Because of the convexity of the remainder of the data, the largest inscribedsimplex still has vertices at the location of the pure end-members where they exist (see Figure 1). This effect can beexamined further with synthetic data.268�
Downloaded from SPIE Digital Library on 26 Oct 2011 to 222.190.117.202. Terms of Use: http://spiedl.org/terms
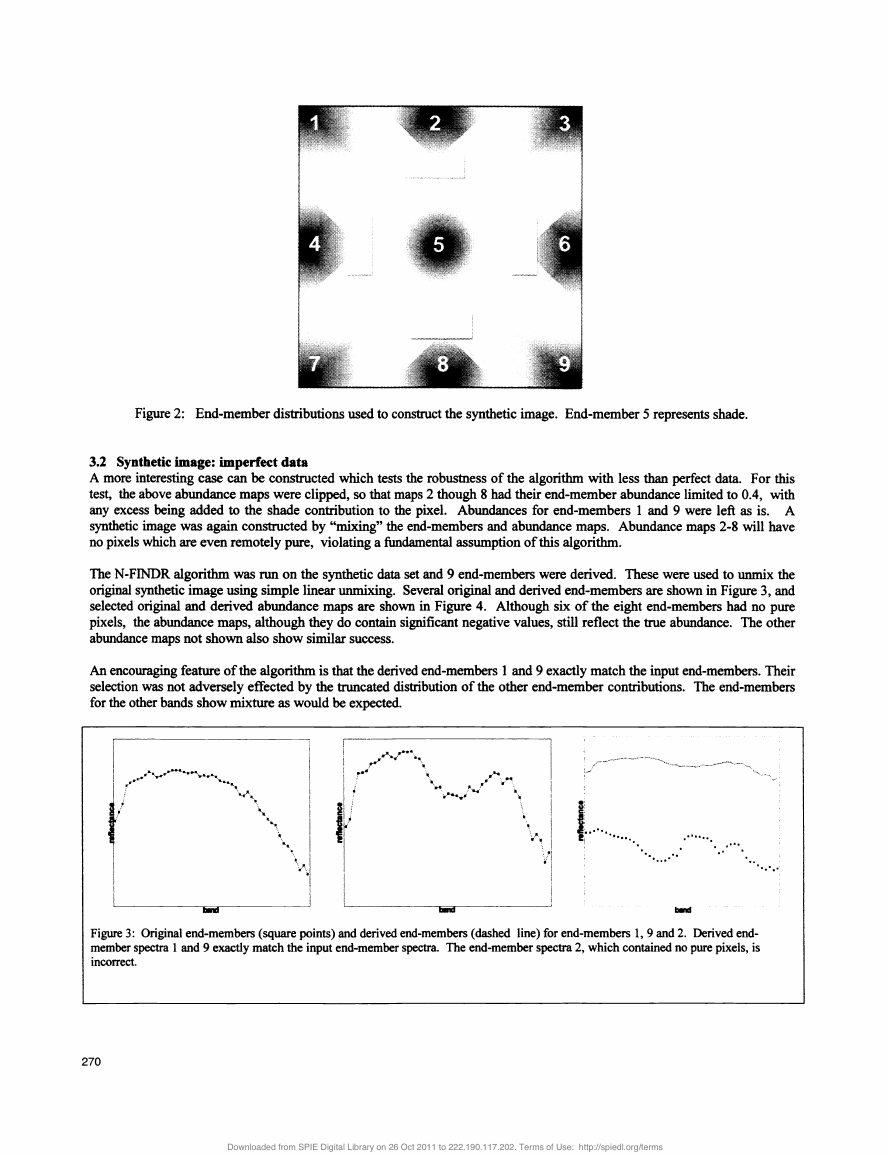
AFigure 1:Points A, B, and C represent the three true end-members for an image, however due to a lack of any pure pixels oftype C, the selected end-members are A, B, and D (a mixed pixel).3. APPLICATION TO SYNTHETIC DATAIn order for an end-member determination algorithm to be considered successful, it must be provide good results on imageswith a wide variety of imperfections. Unfortunately, success on real data is difficult to determine as the true end-membersand abundance maps are often unknown. Synthetic data is therefore useful for testing that the algorithm does indeed work.The performance of an algorithm under adverse conditions can also be examined in a controlled manner.3.1 Synthetic image: perfect dataSynthetic abundance maps were generated for nine end-members, arranged in a grid across the image (see Figure 2). Theend-member abundance decreases linearly away from the specified grid point. These abundance maps are then re-normalizedso that the contributions of the end-members sum to one. Nine end-members, including one vector of all zeros (to representshade) were derived from a 50bandshort-wave infrared image of Cuprite Nevada. The actual choice of end-members isarbitrary as long as they are linearly independent, however using physical end-members results in an image that mimics thespectral characteristics of real data.The end-members were then "mixed" based on the specified end-member abundances. The resulting image was 350pixelsby 350pixelswith 50bandsand represents a perfect case of linearly mixed data.The above outlined algorithm was applied to this data set. The derived end-members were used to produce abundancemapsusing linear unmixing. The derived end-members exactly matched the input ones, and the corresponding abundance mapsexactly matched the abundance maps used to generate the synthetic image. This result is perhaps not surprising, however itdoes show that the algorithm indeed works.269DC�
Downloaded from SPIE Digital Library on 26 Oct 2011 to 222.190.117.202. Terms of Use: http://spiedl.org/terms
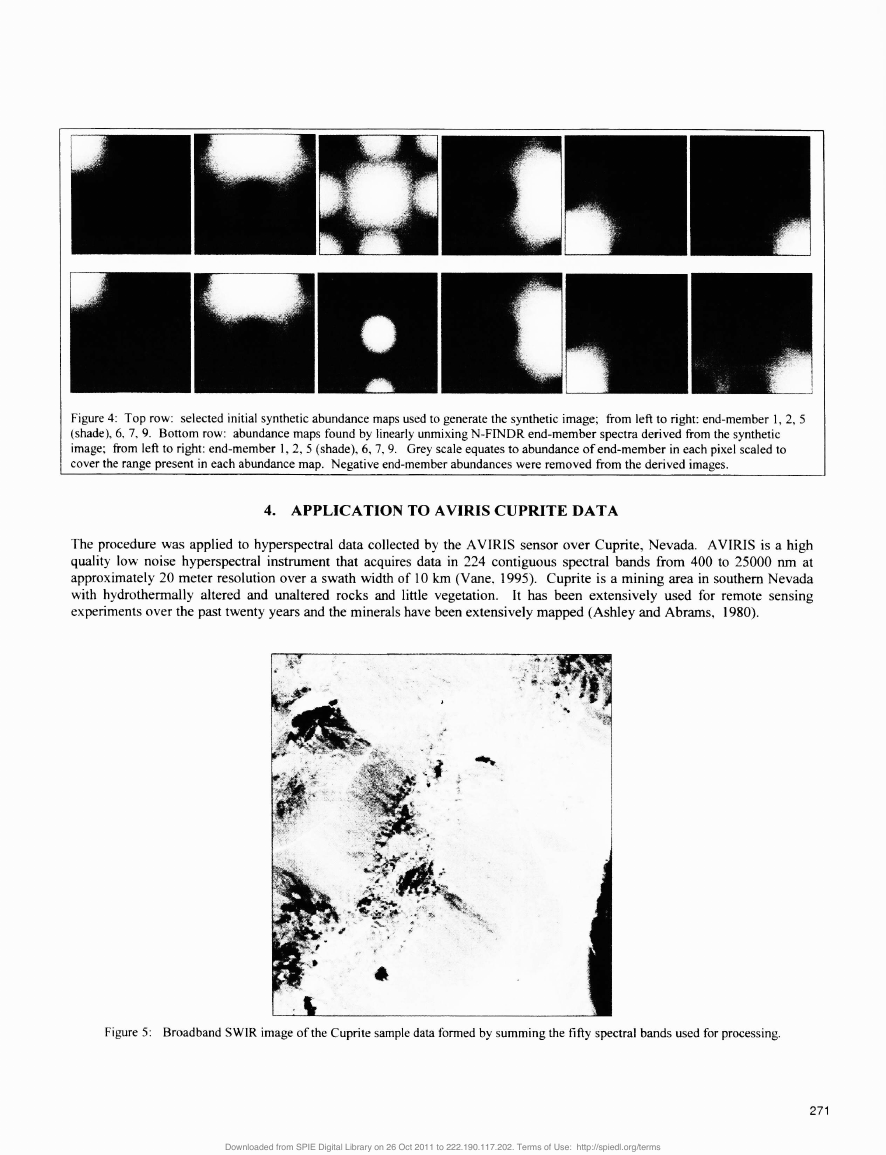
3.2 Synthetic image: imperfect dataA more interesting case can be constructed which tests the robustness of the algorithm with less than perfect data. For thistest, the above abundance maps were clipped, so that maps 2 though 8 had their end-member abundance limited to 0.4, withany excess being added to the shade contribution to the pixel. Abundances for end-members 1 and 9 were left as is. Asynthetic image was again constructed by "mixing" the end-members and abundance maps. Abundance maps 2-8 will haveno pixels which are even remotely pure, violating a fundamental assumption ofthis algorithm.The N-FINDR algorithm was run on the synthetic data set and 9 end-members were derived. These were used to umnix theoriginal synthetic image using simple linear unmixing. Several original and derived end-members are shown in Figure 3, andselected original and derived abundance maps are shown in Figure 4. Although six of the eight end-members had no purepixels, the abundance maps, although they do contain significant negative values, still reflect the true abundance. The otherabundance maps not shown also show similar success.An encouraging feature of the algorithm is that the derived end-members 1 and 9 exactly match the input end-members. Theirselection was not adversely effected by the truncated distribution of the other end-member contributions. The end-membersfor the other bands show mixture as would be expected.270Figure 2: End-member distributions used to construct the synthetic image. End-member 5representsshade.bdFigure3: Original end-members (square points) and derived end-members (dashed line) for end-members 1, 9 and 2. Derived end-member spectra 1and9 exactly match the input end-member spectra. The end-member spectra 2, which contained no pure pixels, isincorrect.�
Downloaded from SPIE Digital Library on 26 Oct 2011 to 222.190.117.202. Terms of Use: http://spiedl.org/terms
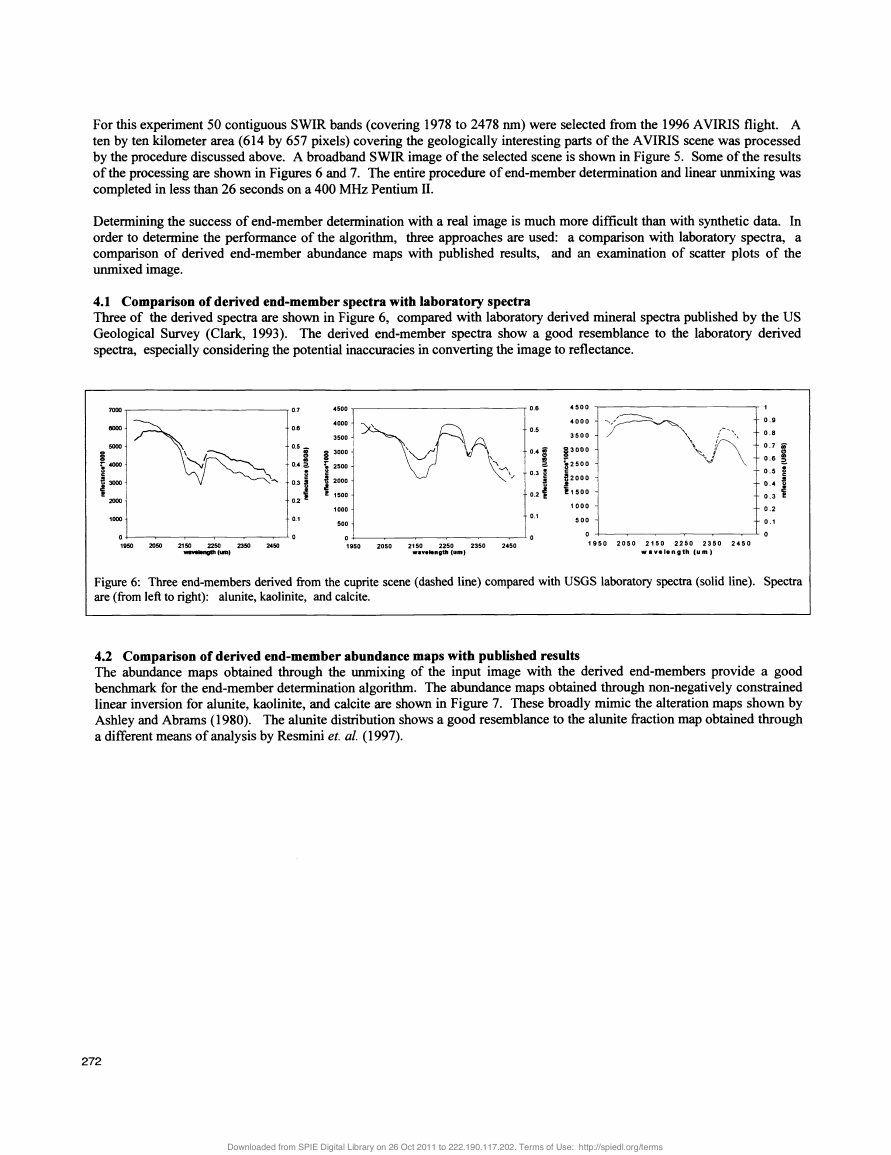
Figure 4: Top row: selected initial synthetic abundance maps used to generate the synthetic image; from left to right: end-member 1, 2, 5(shade), 6. 7.9.Bottom row: abundance maps found by linearly unmixing N-FINDR end-member spectra derived from the syntheticimage from left to right: end-member 1, 2, 5 (shade), 6, 7.9.Grey scale equates to abundance of end-member in each pixel scaled tocover the range present in each abundance map. Negative end-member abundances were removed from the derived images.4. APPLICATION TO AVIRIS CUPRITE DATAThe procedure was applied to hyperspectral data collected by the AVIRIS sensor over Cuprite, Nevada. AVIRIS is a highquality low noise hyperspectral instrument that acquires data in 224 contiguous spectral bands from 400 to 25000 nm atapproximately 20 meter resolution over a swath width of 10 km (Vane. 1995). Cupnte is a mining area in southern Nevadawith hydrothermally altered and unaltered rocks and little vegetation.It has been extensively used for remote sensingexperiments over the past twenty years and the minerals have been extensively mapped (Ashley and Abrams, 1980).Figure 5: Broadband SWIR image of the Cupnte sample data formed by summing the fifty spectral bands used for processing.271�
Downloaded from SPIE Digital Library on 26 Oct 2011 to 222.190.117.202. Terms of Use: http://spiedl.org/terms
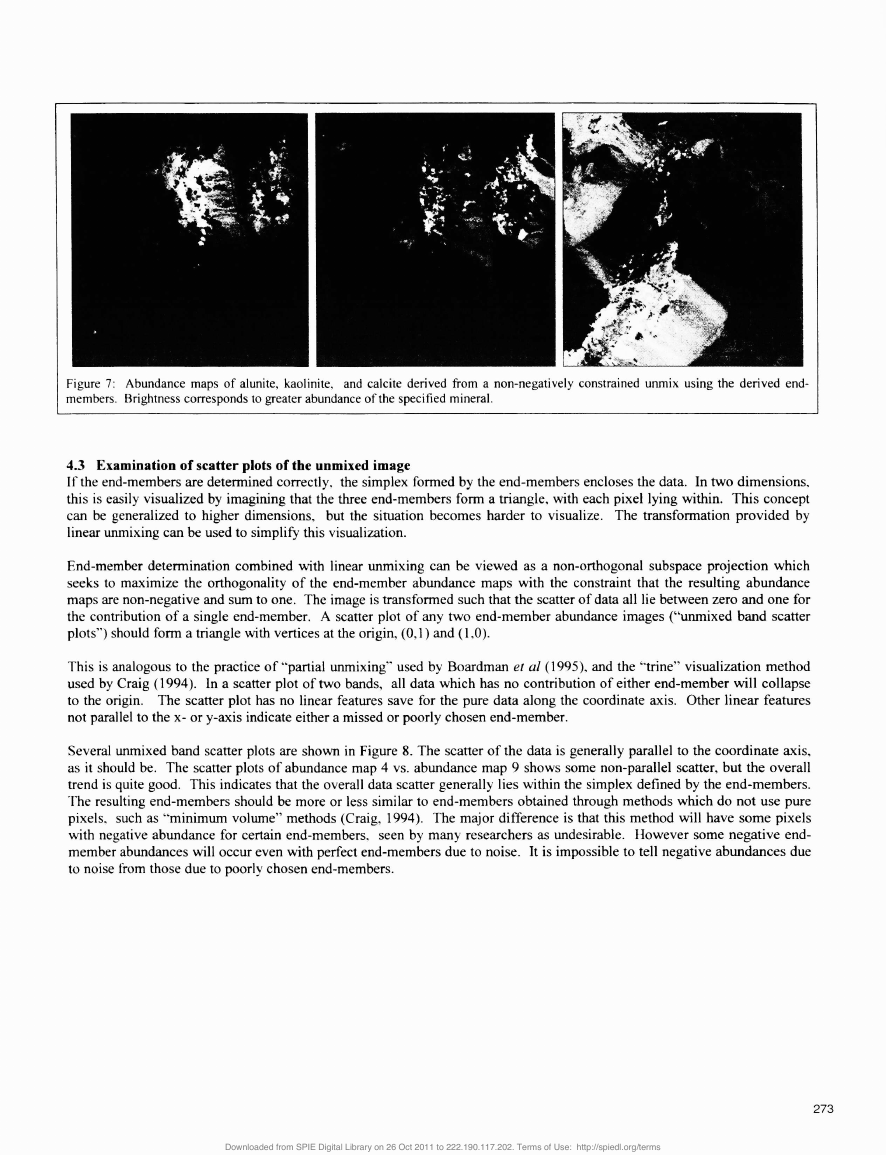
For this experiment 50contiguousSWIR bands (covering 1978 to 2478 nm) were selected from the 1996 AVIRIS flight. Aten by ten kilometer area (614 by 657pixels)covering the geologically interesting parts ofthe AVIRIS scene was processedby the procedure discussed above. A broadband SWIR image ofthe selected scene is shown in Figure 5.Someofthe resultsof the processing are shown in Figures 6 and 7.Theentire procedure of end-member determination and linear unmixing wascompleted in less than 26 seconds on a 400 MHz Pentium II.Determining the success of end-member determination with a real image is much more difficult than with synthetic data. Inorder to determine the performance of the algorithm, three approaches are used: a comparison with laboratory spectra, acomparison of derived end-member abundance maps with published results, and an examination of scatter plots of theunmixed image.4.1 Comparison of derived end-member spectra with laboratory spectraThree of the derived spectra are shown in Figure 6, compared with laboratory derived mineral spectra published by the USGeological Survey (Clark, 1993). The derived end-member spectra show a good resemblance to the laboratory derivedspectra, especially considering the potential inaccuracies in converting the image to reflectance.,')!0.745000.645001!E104;2000021!0.2 15000.3100010000.210000.10.1500 j. o.i00o.00,,01950205021502250235024501950205021502250235024501950 2050 2150 2250 2350 2450w.vslsngth(wn)w.v.I.ngth (urn)wa v•lsn g th (a rn)Figure6: Three end-members derived from the cuprite scene (dashed line) compared with USGS laboratory spectra (solid line). Spectraare (from left to right): alunite, kaolinite, and calcite.4.2 Comparison of derived end-member abundance maps with published resultsThe abundance maps obtained through the unmixing of the input image with the derived end-members provide a goodbenchmark for the end-member determination algorithm. The abundance maps obtained through non-negatively constrainedlinear inversion for alunite, kaolinite, and calcite are shown in Figure 7. These broadly mimic the alteration maps shown byAshley and Abrams (1980). The alunite distribution shows a good resemblance to the alunite fraction map obtained througha different means of analysis by Resmini et. al. (1997).272�
Downloaded from SPIE Digital Library on 26 Oct 2011 to 222.190.117.202. Terms of Use: http://spiedl.org/terms
4.3 Examination of scatter plots of the unmixed imageIf the end-members are determined correctly, the simplex formed by the end-members encloses the data. In two dimensions.this is easily visualized by imagining that the three end-members form a triangle, with each pixel lying within. This conceptcan be generalized to higher dimensions, but the situation becomes harder to visualize. The transformation provided bylinear unmixing can be used to simplify this visualization.End-member determination combined with linear unmixing can be viewed as a non-orthogonal subspace projection whichseeks to maximize the orthogonality of the end-member abundance maps with the constraint that the resulting abundancemaps are non-negative and sum to one. The image is transformed such that the scatter of data all lie between zero and one forthe contribution of a single end-member. A scatter plot of any two end-member abundance images ("unmixed band scatterplots") should form a triangle with vertices at the origin, (0,1) and (1,0).This is analogous to the practice of "partial unmixing" used by Boardman eta!(1995). and the "trine" visualization methodused by Craig (1994). In a scatter plot of two bands, all data which has no contribution of either end-member will collapseto the origin. The scatter plot has no linear features save for the pure data along the coordinate axis. Other linear featuresnot parallel to the x- or y-axis indicate either a missed or poorly chosen end-member.Several unmixed band scatter plots are shown in Figure 8. The scatter of the data is generally parallel to the coordinate axis.as it should be. The scatter plots of abundance map 4 vs. abundance map 9 shows some non-parallel scatter, but the overalltrend is quite good. This indicates that the overall data scatter generally lies within the simplex defined by the end-members.l'he resulting end-members should be more or less similar to end-members obtained through methods which do not use purepixels, such as "minimum volume" methods (Craig, 1994). The major difference is that this method will have some pixelswith negative abundance for certain end-members, seen by many researchers as undesirable. However some negative end-member abundances will occur even with perfect end-members due to noise. It is impossible to tell negative abundances dueto noise from those due to poorly chosen end-members.273Figure 7: Abundance maps of alunite, kaotinite, and calcite derived from a non-negatively constrained unniix using the derived end-members. Brightness corresponds to greater abundance of the specified mineral.�


 2023年江西萍乡中考道德与法治真题及答案.doc
 2012年重庆南川中考生物真题及答案.doc
 2013年江西师范大学地理学综合及文艺理论基础考研真题.doc
 2020年四川甘孜小升初语文真题及答案I卷.doc
 2020年注册岩土工程师专业基础考试真题及答案.doc
 2023-2024学年福建省厦门市九年级上学期数学月考试题及答案.doc
 2021-2022学年辽宁省沈阳市大东区九年级上学期语文期末试题及答案.doc
 2022-2023学年北京东城区初三第一学期物理期末试卷及答案.doc
 2018上半年江西教师资格初中地理学科知识与教学能力真题及答案.doc
 2012年河北国家公务员申论考试真题及答案-省级.doc
 2020-2021学年江苏省扬州市江都区邵樊片九年级上学期数学第一次质量检测试题及答案.doc
 2022下半年黑龙江教师资格证中学综合素质真题及答案.doc