PHOTOACOUSTIC SPECTROSCOPY
Light and sound—photoacoustic
spectroscopy
C. Haisch and R. Niessner
Institute of Hydrochemistry,Technical University of Munich, Marchioninistrasse 17, D-81377 Munich, Germany.
E-mail: Christoph.Haisch@ch.tum.de
Introduction
Like many other spectroscopic tech-
niques, which are today carried out
with laser light sources, photoacoustic
spectroscopy is much older than the
development of the first laser in 1960.
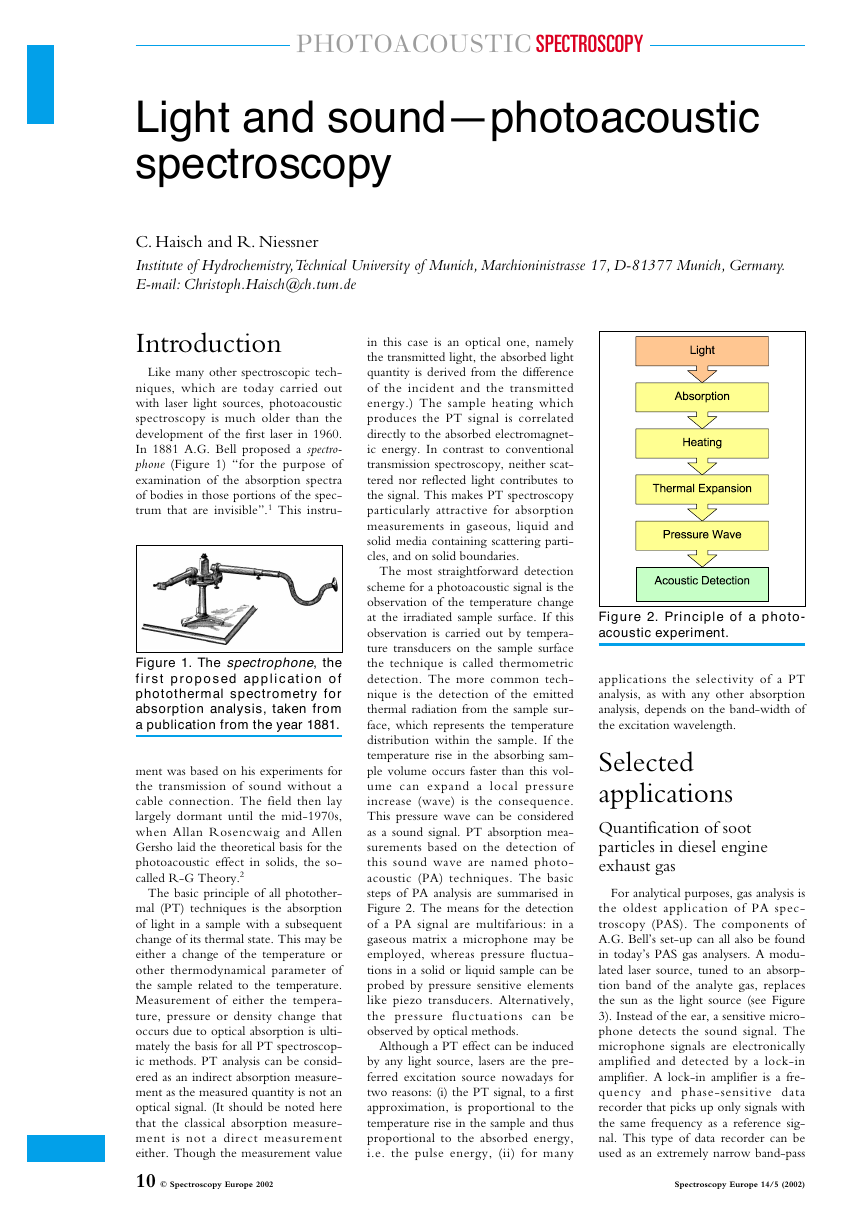
In 1881 A.G. Bell proposed a spectro-
phone (Figure 1) “for the purpose of
examination of the absorption spectra
of bodies in those portions of the spec-
trum that are invisible”.1 This instru-
Figure 1. The spectrophone, the
first proposed application of
photothermal spectrometry for
absorption analysis, taken from
a publication from the year 1881.
ment was based on his experiments for
the transmission of sound without a
cable connection. The field then lay
largely dormant until the mid-1970s,
when Allan Rosencwaig and Allen
Gersho laid the theoretical basis for the
photoacoustic effect in solids, the so-
called R-G Theory.2
The basic principle of all photother-
mal (PT) techniques is the absorption
of light in a sample with a subsequent
change of its thermal state. This may be
either a change of the temperature or
other thermodynamical parameter of
the sample related to the temperature.
Measurement of either the tempera-
ture, pressure or density change that
occurs due to optical absorption is ulti-
mately the basis for all PT spectroscop-
ic methods. PT analysis can be consid-
ered as an indirect absorption measure-
ment as the measured quantity is not an
optical signal. (It should be noted here
that the classical absorption measure-
ment is not a direct measurement
either. Though the measurement value
10 © Spectroscopy Europe 2002
in this case is an optical one, namely
the transmitted light, the absorbed light
quantity is derived from the difference
of the incident and the transmitted
energy.) The sample heating which
produces the PT signal is correlated
directly to the absorbed electromagnet-
ic energy. In contrast to conventional
transmission spectroscopy, neither scat-
tered nor reflected light contributes to
the signal. This makes PT spectroscopy
particularly attractive for absorption
measurements in gaseous, liquid and
solid media containing scattering parti-
cles, and on solid boundaries.
The most straightforward detection
scheme for a photoacoustic signal is the
observation of the temperature change
at the irradiated sample surface. If this
observation is carried out by tempera-
ture transducers on the sample surface
the technique is called thermometric
detection. The more common tech-
nique is the detection of the emitted
thermal radiation from the sample sur-
face, which represents the temperature
distribution within the sample. If the
temperature rise in the absorbing sam-
ple volume occurs faster than this vol-
ume can expand a local pressure
increase (wave) is the consequence.
This pressure wave can be considered
as a sound signal. PT absorption mea-
surements based on the detection of
this sound wave are named photo-
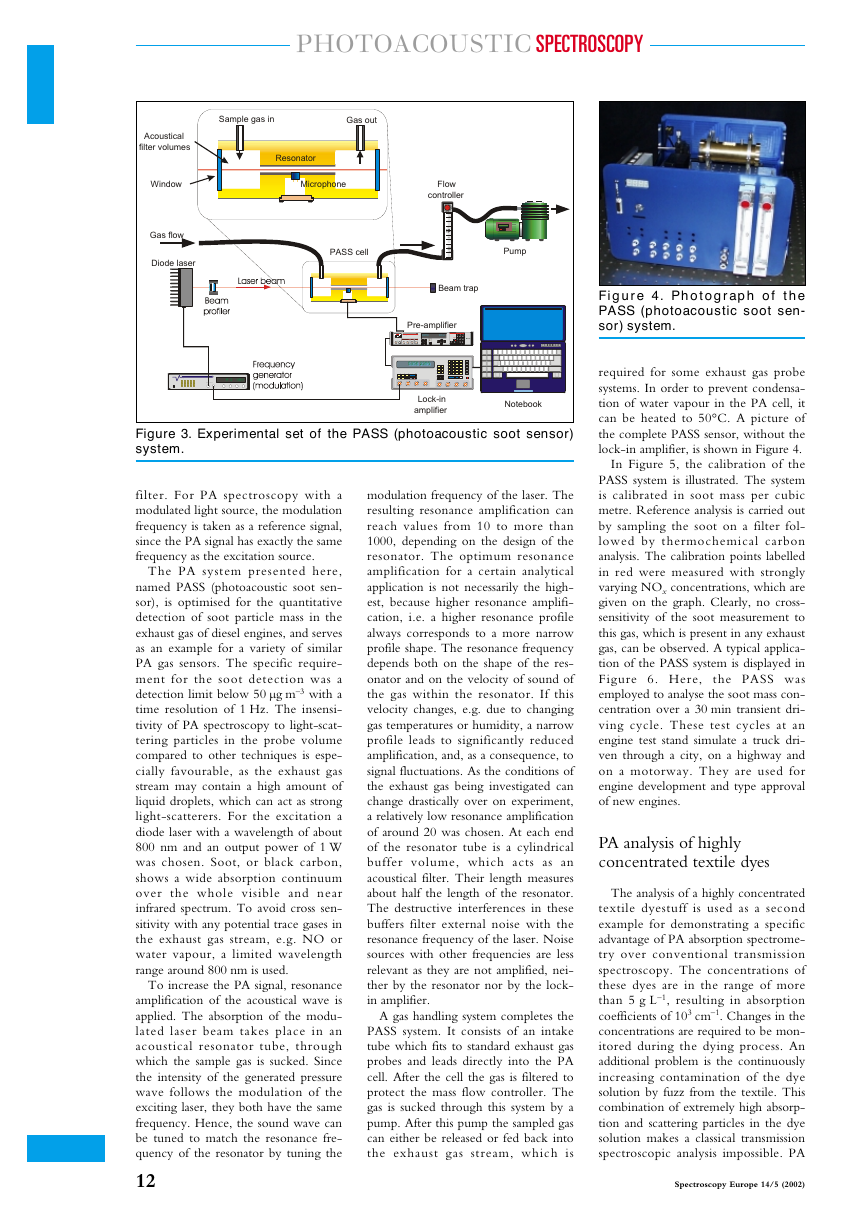
acoustic (PA) techniques. The basic
steps of PA analysis are summarised in
Figure 2. The means for the detection
of a PA signal are multifarious: in a
gaseous matrix a microphone may be
employed, whereas pressure fluctua-
tions in a solid or liquid sample can be
probed by pressure sensitive elements
like piezo transducers. Alternatively,
the pressure fluctuations can be
observed by optical methods.
Although a PT effect can be induced
by any light source, lasers are the pre-
ferred excitation source nowadays for
two reasons: (i) the PT signal, to a first
approximation, is proportional to the
temperature rise in the sample and thus
proportional to the absorbed energy,
i.e. the pulse energy, (ii) for many
Figure 2. Principle of a photo-
acoustic experiment.
applications the selectivity of a PT
analysis, as with any other absorption
analysis, depends on the band-width of
the excitation wavelength.
Selected
applications
Quantification of soot
particles in diesel engine
exhaust gas
For analytical purposes, gas analysis is
the oldest application of PA spec-
troscopy (PAS). The components of
A.G. Bell’s set-up can all also be found
in today’s PAS gas analysers. A modu-
lated laser source, tuned to an absorp-
tion band of the analyte gas, replaces
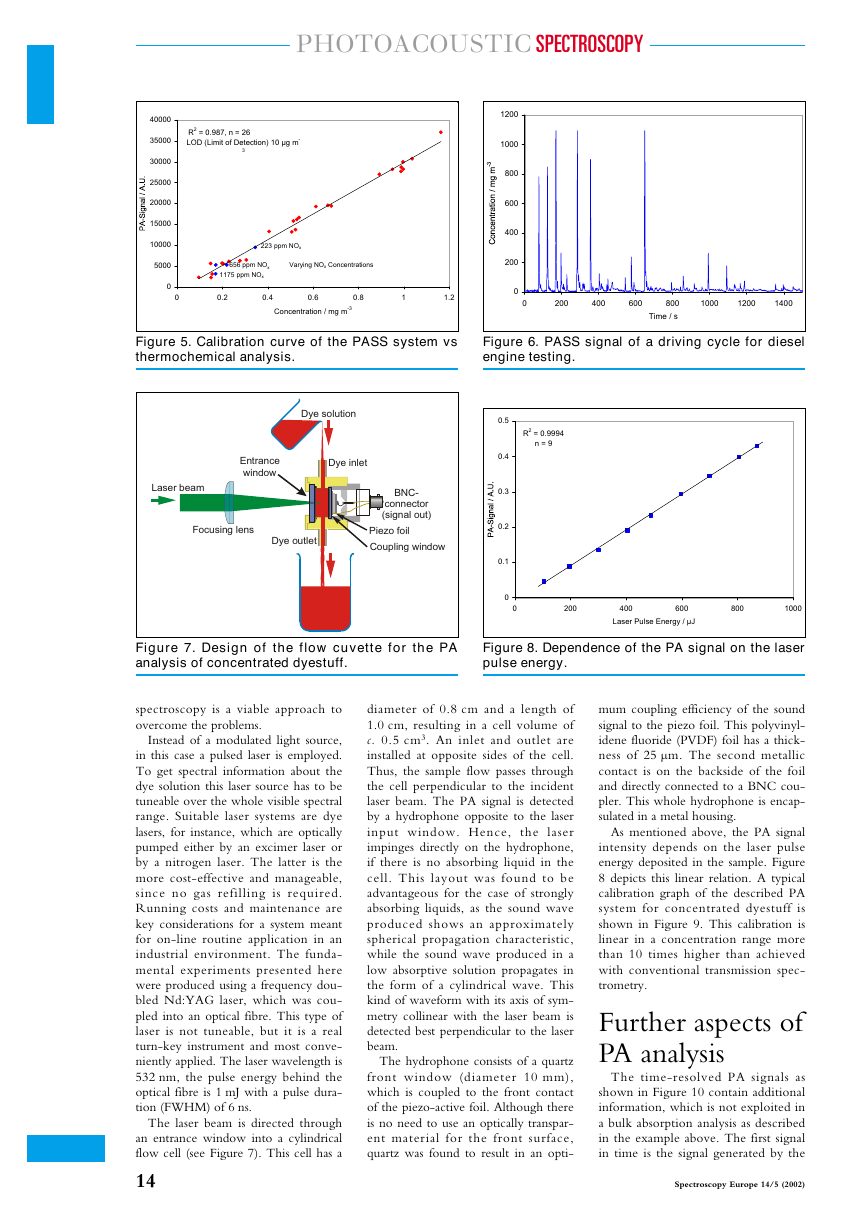
the sun as the light source (see Figure
3). Instead of the ear, a sensitive micro-
phone detects the sound signal. The
microphone signals are electronically
amplified and detected by a lock-in
amplifier. A lock-in amplifier is a fre-
quency and phase-sensitive data
recorder that picks up only signals with
the same frequency as a reference sig-
nal. This type of data recorder can be
used as an extremely narrow band-pass
Spectroscopy Europe 14/5 (2002)
�
PHOTOACOUSTIC SPECTROSCOPY
Acoustical
filter volumes
Sample gas in
Gas out
Resonator
Window
Microphone
Flow
controller
Fig. 3
Gas flow
Diode laser
<<< >>>
Designed by Haisch
Digital Delay Generator
PASS cell
Pump
Beam trap
Pre-amplifier
Made by
Main Aux.
W IDTH
W IDTH
100 ns
100 ns
^
<
>
1 2 3
4 5 6
7 8 9
.
0 #
Func.
C
E
Powe
5350 2390
5350 2390
1
1
1
1
1
1
1
1
1
1
ENTER
1
1
1
1
1
1
1
1
1
1
1
ST
Designed by
Lock-in
amplifier
Notebook
Figure 3. Experimental set of the PASS (photoacoustic soot sensor)
system.
filter. For PA spectroscopy with a
modulated light source, the modulation
frequency is taken as a reference signal,
since the PA signal has exactly the same
frequency as the excitation source.
The PA system presented here,
named PASS (photoacoustic soot sen-
sor), is optimised for the quantitative
detection of soot particle mass in the
exhaust gas of diesel engines, and serves
as an example for a variety of similar
PA gas sensors. The specific require-
ment for the soot detection was a
detection limit below 50 µg m–3 with a
time resolution of 1 Hz. The insensi-
tivity of PA spectroscopy to light-scat-
tering particles in the probe volume
compared to other techniques is espe-
cially favourable, as the exhaust gas
stream may contain a high amount of
liquid droplets, which can act as strong
light-scatterers. For the excitation a
diode laser with a wavelength of about
800 nm and an output power of 1 W
was chosen. Soot, or black carbon,
shows a wide absorption continuum
over the whole visible and near
infrared spectrum. To avoid cross sen-
sitivity with any potential trace gases in
the exhaust gas stream, e.g. NO or
water vapour, a limited wavelength
range around 800 nm is used.
To increase the PA signal, resonance
amplification of the acoustical wave is
applied. The absorption of the modu-
lated laser beam takes place in an
acoustical resonator tube, through
which the sample gas is sucked. Since
the intensity of the generated pressure
wave follows the modulation of the
exciting laser, they both have the same
frequency. Hence, the sound wave can
be tuned to match the resonance fre-
quency of the resonator by tuning the
12
modulation frequency of the laser. The
resulting resonance amplification can
reach values from 10 to more than
1000, depending on the design of the
resonator. The optimum resonance
amplification for a certain analytical
application is not necessarily the high-
est, because higher resonance amplifi-
cation, i.e. a higher resonance profile
always corresponds to a more narrow
profile shape. The resonance frequency
depends both on the shape of the res-
onator and on the velocity of sound of
the gas within the resonator. If this
velocity changes, e.g. due to changing
gas temperatures or humidity, a narrow
profile leads to significantly reduced
amplification, and, as a consequence, to
signal fluctuations. As the conditions of
the exhaust gas being investigated can
change drastically over on experiment,
a relatively low resonance amplification
of around 20 was chosen. At each end
of the resonator tube is a cylindrical
buffer volume, which acts as an
acoustical filter. Their length measures
about half the length of the resonator.
The destructive interferences in these
buffers filter external noise with the
resonance frequency of the laser. Noise
sources with other frequencies are less
relevant as they are not amplified, nei-
ther by the resonator nor by the lock-
in amplifier.
A gas handling system completes the
PASS system. It consists of an intake
tube which fits to standard exhaust gas
probes and leads directly into the PA
cell. After the cell the gas is filtered to
protect the mass flow controller. The
gas is sucked through this system by a
pump. After this pump the sampled gas
can either be released or fed back into
the exhaust gas stream, which is
Figure 4. Photograph of the
PASS (photoacoustic soot sen-
sor) system.
required for some exhaust gas probe
systems. In order to prevent condensa-
tion of water vapour in the PA cell, it
can be heated to 50°C. A picture of
the complete PASS sensor, without the
lock-in amplifier, is shown in Figure 4.
In Figure 5, the calibration of the
PASS system is illustrated. The system
is calibrated in soot mass per cubic
metre. Reference analysis is carried out
by sampling the soot on a filter fol-
lowed by thermochemical carbon
analysis. The calibration points labelled
in red were measured with strongly
varying NOx concentrations, which are
given on the graph. Clearly, no cross-
sensitivity of the soot measurement to
this gas, which is present in any exhaust
gas, can be observed. A typical applica-
tion of the PASS system is displayed in
Figure 6. Here, the PASS was
employed to analyse the soot mass con-
centration over a 30 min transient dri-
ving cycle. These test cycles at an
engine test stand simulate a truck dri-
ven through a city, on a highway and
on a motorway. They are used for
engine development and type approval
of new engines.
PA analysis of highly
concentrated textile dyes
The analysis of a highly concentrated
textile dyestuff is used as a second
example for demonstrating a specific
advantage of PA absorption spectrome-
try over conventional transmission
spectroscopy. The concentrations of
these dyes are in the range of more
than 5 g L–1, resulting in absorption
coefficients of 103 cm–1. Changes in the
concentrations are required to be mon-
itored during the dying process. An
additional problem is the continuously
increasing contamination of the dye
solution by fuzz from the textile. This
combination of extremely high absorp-
tion and scattering particles in the dye
solution makes a classical transmission
spectroscopic analysis impossible. PA
Spectroscopy Europe 14/5 (2002)
�
PHOTOACOUSTIC SPECTROSCOPY
40000
35000
30000
25000
20000
15000
10000
5000
0
0
R2 = 0.987, n = 26
LOD (Limit of Detection) 10 µg m-
3
223 ppm NOx
656 ppm NOx
Varying NOx Concentrations
1175 ppm NOx
0.2
0.4
0.6
0.8
1
1.2
Concentration / mg m-3
1200
1000
800
600
400
200
0
0
200
400
600
800
1000
1200
1400
Time / s
Figure 5. Calibration curve of the PASS system vs
thermochemical analysis.
Figure 6. PASS signal of a driving cycle for diesel
engine testing.
Dye solution
Entrance
window
Dye inlet
Laser beam
Focusing lens
Dye outlet
0.5
0.4
0.3
0.2
0.1
0
0
BNC-
connector
(signal out)
Piezo foil
Coupling window
R2 = 0.9994
n = 9
200
400
600
800
1000
Laser Pulse Energy / µJ
Figure 7. Design of the flow cuvette for the PA
analysis of concentrated dyestuff.
Figure 8. Dependence of the PA signal on the laser
pulse energy.
spectroscopy is a viable approach to
overcome the problems.
Instead of a modulated light source,
in this case a pulsed laser is employed.
To get spectral information about the
dye solution this laser source has to be
tuneable over the whole visible spectral
range. Suitable laser systems are dye
lasers, for instance, which are optically
pumped either by an excimer laser or
by a nitrogen laser. The latter is the
more cost-effective and manageable,
since no gas refilling is required.
Running costs and maintenance are
key considerations for a system meant
for on-line routine application in an
industrial environment. The funda-
mental experiments presented here
were produced using a frequency dou-
bled Nd:YAG laser, which was cou-
pled into an optical fibre. This type of
laser is not tuneable, but it is a real
turn-key instrument and most conve-
niently applied. The laser wavelength is
532 nm, the pulse energy behind the
optical fibre is 1 mJ with a pulse dura-
tion (FWHM) of 6 ns.
The laser beam is directed through
an entrance window into a cylindrical
flow cell (see Figure 7). This cell has a
14
diameter of 0.8 cm and a length of
1.0 cm, resulting in a cell volume of
c. 0.5 cm3. An inlet and outlet are
installed at opposite sides of the cell.
Thus, the sample flow passes through
the cell perpendicular to the incident
laser beam. The PA signal is detected
by a hydrophone opposite to the laser
input window. Hence, the laser
impinges directly on the hydrophone,
if there is no absorbing liquid in the
cell. This layout was found to be
advantageous for the case of strongly
absorbing liquids, as the sound wave
produced shows an approximately
spherical propagation characteristic,
while the sound wave produced in a
low absorptive solution propagates in
the form of a cylindrical wave. This
kind of waveform with its axis of sym-
metry collinear with the laser beam is
detected best perpendicular to the laser
beam.
The hydrophone consists of a quartz
front window (diameter 10 mm),
which is coupled to the front contact
of the piezo-active foil. Although there
is no need to use an optically transpar-
ent material for the front surface,
quartz was found to result in an opti-
mum coupling efficiency of the sound
signal to the piezo foil. This polyvinyl-
idene fluoride (PVDF) foil has a thick-
ness of 25 µm. The second metallic
contact is on the backside of the foil
and directly connected to a BNC cou-
pler. This whole hydrophone is encap-
sulated in a metal housing.
As mentioned above, the PA signal
intensity depends on the laser pulse
energy deposited in the sample. Figure
8 depicts this linear relation. A typical
calibration graph of the described PA
system for concentrated dyestuff is
shown in Figure 9. This calibration is
linear in a concentration range more
than 10 times higher than achieved
with conventional transmission spec-
trometry.
Further aspects of
PA analysis
The time-resolved PA signals as
shown in Figure 10 contain additional
information, which is not exploited in
a bulk absorption analysis as described
in the example above. The first signal
in time is the signal generated by the
Spectroscopy Europe 14/5 (2002)
�
PHOTOACOUSTIC SPECTROSCOPY
R2 = 0.995
n = 9
25
20
15
10
5
0
0.6
0.4
0.2
0
0
-0.2
-0.4
-0.6
-0.8
10 g/L
25 g/L
2
4
6
8
10
12
Transmitted light
absorbed by the
piezodetector
Light absorbed in the cuvette,
soundwave propagated through
the cuvette
0
5
10
15
20
25
Concentration / g L-1
Time / µs
Figure 9. Calibration of the PA sensor system for
textile dyestuff.
Figure 10. PA signal of two different concentrations
of textile dyestuff in water.
light that is transmitted through the
sample and impinges directly on the
hydrophone. The second signal stems
from the light absorbed in the sample
liquid. Due to the high absorption in
the sample the electromagnetic ener-
gy is deposited mostly directly on the
front side of the cuvette. The pressure
wave generated there propagates
through the cuvette and is detected
after a delay. This delay is the time
(~7 µs) the sound needs to propagate
the length of the cuvette (1 cm), (the
speed of sound in water ~1500 m s–1).
For a non-homogeneous sample a
depth-resolved absorption measure-
ment can be carried out in this way.
Each delay corresponds to a certain
depth in the sample. This simple
example is included to give an idea of
an interesting field of application or
PA analysis. Of course, the design of
such a sensor system would be differ-
ent, for example, the hydrophone
could be placed on the same side as
the laser. However, the description of
depth resolved analysis by PA spec-
troscopy is beyond the scope of this
short article.
References
1.
(a) A.G. Bell, Phil. Mag. 11, 510
(1881).
2. A. Rosencwaig and A. Gersho,
“Theory of the Photoacoustic
Effect in Solids”, J. Appl. Phys. 47,
64–69 (1976).
Spectroscopy Europe 14/5 (2002)
15
�


 2023年江西萍乡中考道德与法治真题及答案.doc
 2012年重庆南川中考生物真题及答案.doc
 2013年江西师范大学地理学综合及文艺理论基础考研真题.doc
 2020年四川甘孜小升初语文真题及答案I卷.doc
 2020年注册岩土工程师专业基础考试真题及答案.doc
 2023-2024学年福建省厦门市九年级上学期数学月考试题及答案.doc
 2021-2022学年辽宁省沈阳市大东区九年级上学期语文期末试题及答案.doc
 2022-2023学年北京东城区初三第一学期物理期末试卷及答案.doc
 2018上半年江西教师资格初中地理学科知识与教学能力真题及答案.doc
 2012年河北国家公务员申论考试真题及答案-省级.doc
 2020-2021学年江苏省扬州市江都区邵樊片九年级上学期数学第一次质量检测试题及答案.doc
 2022下半年黑龙江教师资格证中学综合素质真题及答案.doc