logo资料库

关于奇异谱分析的教材.pdf

第1页 / 共125页
第2页 / 共125页
第3页 / 共125页
第4页 / 共125页
第5页 / 共125页
第6页 / 共125页
第7页 / 共125页
第8页 / 共125页
资料共125页,剩余部分请下载后查看
Singular Spectrum Analysisfor Time Series
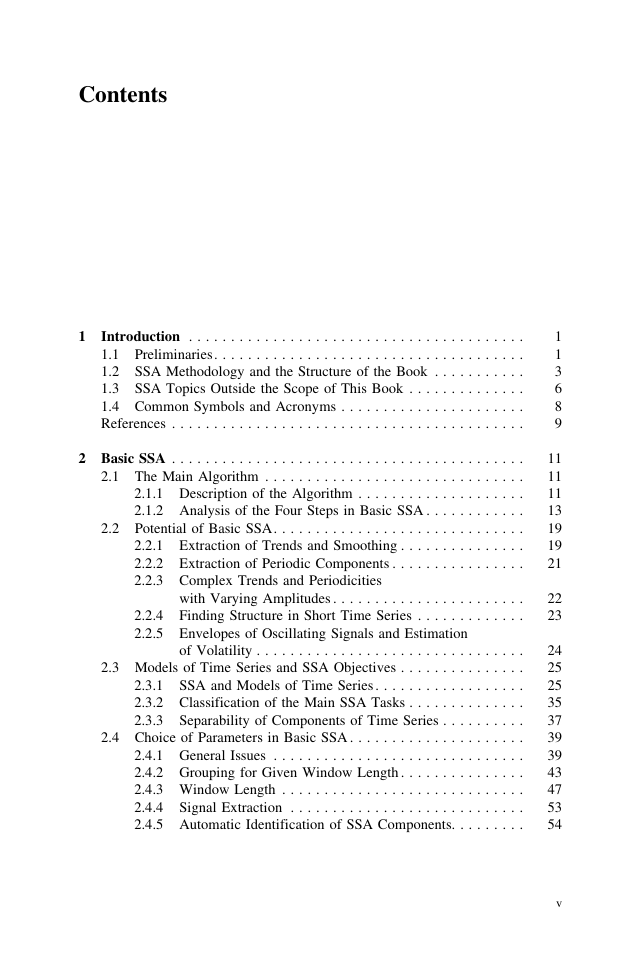
Contents
1 Introduction
1.1 Preliminaries
1.2 SSA Methodology and the Structure of the Book
1.3 SSA Topics Outside the Scope of This Book
1.4 Common Symbols and Acronyms
References
2 Basic SSA
2.1 The Main Algorithm
2.1.1 Description of the Algorithm
2.1.2 Analysis of the Four Steps in Basic SSA
2.2 Potential of Basic SSA
2.2.1 Extraction of Trends and Smoothing
2.2.2 Extraction of Periodic Components
2.2.3 Complex Trends and Periodicities with Varying Amplitudes
2.2.4 Finding Structure in Short Time Series
2.2.5 Envelopes of Oscillating Signals and Estimation of Volatility
2.3 Models of Time Series and SSA Objectives
2.3.1 SSA and Models of Time Series
2.3.2 Classification of the Main SSA Tasks
2.3.3 Separability of Components of Time Series
2.4 Choice of Parameters in Basic SSA
2.4.1 General Issues
2.4.2 Grouping for Given Window Length
2.4.3 Window Length
2.4.4 Signal Extraction
2.4.5 Automatic Identification of SSA Components
2.5 Some Variations of Basic SSA
2.5.1 Preprocessing
2.5.2 Centering in SSA
2.5.3 Stationary Series and Toeplitz SSA
2.5.4 Rotations for Separability: SSA--ICA
2.5.5 Sequential SSA
2.5.6 Computer Implementation of SSA
2.5.7 Replacing the SVD with Other Procedures
References
3 SSA for Forecasting, Interpolation, Filtration and Estimation
3.1 SSA Forecasting Algorithms
3.1.1 Main Ideas and Notation
3.1.2 Formal Description of the Algorithms
3.1.3 SSA Forecasting Algorithms: Similarities and Dissimilarities
3.1.4 Appendix: Vectors in a Subspace
3.2 LRR and Associated Characteristic Polynomials
3.2.1 Basic Facts
3.2.2 Roots of the Characteristic Polynomials
3.2.3 Min-Norm LRR
3.3 Recurrent Forecasting as Approximate Continuation
3.3.1 Approximate Separability and Forecasting Errors
3.3.2 Approximate Continuation and the Characteristic Polynomials
3.4 Confidence Bounds for the Forecast
3.4.1 Monte Carlo and Bootstrap Confidence Intervals
3.4.2 Confidence Intervals: Comparison of Forecasting Methods
3.5 Summary and Recommendations on Forecasting Parameters
3.6 Case Study: `Fortified Wine'
3.6.1 Linear Recurrence Relation Governing the Time Series
3.6.2 Choice of Forecasting Methods and Parameters
3.7 Missing Value Imputation
3.7.1 SSA for Time Series with Missing Data: Algorithm
3.7.2 Discussion
3.7.3 Example
3.8 Subspace-Based Methods and Estimation of Signal Parameters
3.8.1 Basic Facts
3.8.2 ESPRIT
3.8.3 Overview of Other Subspace-Based Methods
3.8.4 Cadzow Iterations
3.9 SSA and Filters
3.9.1 Linear Filters and Their Characteristics
3.9.2 SSA Reconstruction as a Linear Filter
3.9.3 Middle Point Filter
3.9.4 Last Point Filter and Forecasting
3.9.5 Causal SSA (Last-Point SSA)
References

SpringerBriefs in Statistics For further volumes: http://www.springer.com/series/8921
Nina Golyandina • Anatoly Zhigljavsky Singular Spectrum Analysis for Time Series 123
Nina Golyandina Department of Mathematics St. Petersburg University St. Petersburg Russia Anatoly Zhigljavsky School of Mathematics Cardiff University Cardiff UK ISSN 2191-544X ISBN 978-3-642-34912-6 DOI 10.1007/978-3-642-34913-3 Springer Heidelberg New York Dordrecht London ISSN 2191-5458 (electronic) ISBN 978-3-642-34913-3 (eBook) Library of Congress Control Number: 2012953018 Ó The Author(s) 2013 This work is subject to copyright. All rights are reserved by the Publisher, whether the whole or part of the material is concerned, specifically the rights of translation, reprinting, reuse of illustrations, recitation, broadcasting, reproduction on microfilms or in any other physical way, and transmission or information storage and retrieval, electronic adaptation, computer software, or by similar or dissimilar methodology now known or hereafter developed. Exempted from this legal reservation are brief excerpts in connection with reviews or scholarly analysis or material supplied specifically for the purpose of being entered and executed on a computer system, for exclusive use by the purchaser of the work. Duplication of this publication or parts thereof is permitted only under the provisions of the Copyright Law of the Publisher’s location, in its current version, and permission for use must always be obtained from Springer. Permissions for use may be obtained through RightsLink at the Copyright Clearance Center. Violations are liable to prosecution under the respective Copyright Law. The use of general descriptive names, registered names, trademarks, service marks, etc. in this publication does not imply, even in the absence of a specific statement, that such names are exempt from the relevant protective laws and regulations and therefore free for general use. While the advice and information in this book are believed to be true and accurate at the date of publication, neither the authors nor the editors nor the publisher can accept any legal responsibility for any errors or omissions that may be made. The publisher makes no warranty, express or implied, with respect to the material contained herein. Printed on acid-free paper Springer is part of Springer Science+Business Media (www.springer.com)
Contents 1 Introduction . . . . . . . . . . . . . . . . . . . . . . . . . . . . . . . . . . . . . . . . 1.1 Preliminaries . . . . . . . . . . . . . . . . . . . . . . . . . . . . . . . . . . . . . 1.2 SSA Methodology and the Structure of the Book . . . . . . . . . . . 1.3 SSA Topics Outside the Scope of This Book . . . . . . . . . . . . . . 1.4 Common Symbols and Acronyms . . . . . . . . . . . . . . . . . . . . . . References . . . . . . . . . . . . . . . . . . . . . . . . . . . . . . . . . . . . . . . . . . 2 Basic SSA . . . . . . . . . . . . . . . . . . . . . . . . . . . . . . . . . . . . . . . . . . 2.1 The Main Algorithm . . . . . . . . . . . . . . . . . . . . . . . . . . . . . . . 2.1.1 Description of the Algorithm . . . . . . . . . . . . . . . . . . . . 2.1.2 Analysis of the Four Steps in Basic SSA . . . . . . . . . . . . 2.2 Potential of Basic SSA. . . . . . . . . . . . . . . . . . . . . . . . . . . . . . 2.2.1 Extraction of Trends and Smoothing . . . . . . . . . . . . . . . 2.2.2 Extraction of Periodic Components . . . . . . . . . . . . . . . . 2.2.3 Complex Trends and Periodicities with Varying Amplitudes . . . . . . . . . . . . . . . . . . . . . . . 2.2.4 Finding Structure in Short Time Series . . . . . . . . . . . . . 2.2.5 Envelopes of Oscillating Signals and Estimation of Volatility . . . . . . . . . . . . . . . . . . . . . . . . . . . . . . . . 2.3 Models of Time Series and SSA Objectives . . . . . . . . . . . . . . . 2.3.1 SSA and Models of Time Series . . . . . . . . . . . . . . . . . . 2.3.2 Classification of the Main SSA Tasks . . . . . . . . . . . . . . 2.3.3 Separability of Components of Time Series . . . . . . . . . . 2.4 Choice of Parameters in Basic SSA . . . . . . . . . . . . . . . . . . . . . 2.4.1 General Issues . . . . . . . . . . . . . . . . . . . . . . . . . . . . . . 2.4.2 Grouping for Given Window Length . . . . . . . . . . . . . . . 2.4.3 Window Length . . . . . . . . . . . . . . . . . . . . . . . . . . . . . 2.4.4 Signal Extraction . . . . . . . . . . . . . . . . . . . . . . . . . . . . 2.4.5 Automatic Identification of SSA Components. . . . . . . . . 1 1 3 6 8 9 11 11 11 13 19 19 21 22 23 24 25 25 35 37 39 39 43 47 53 54 v
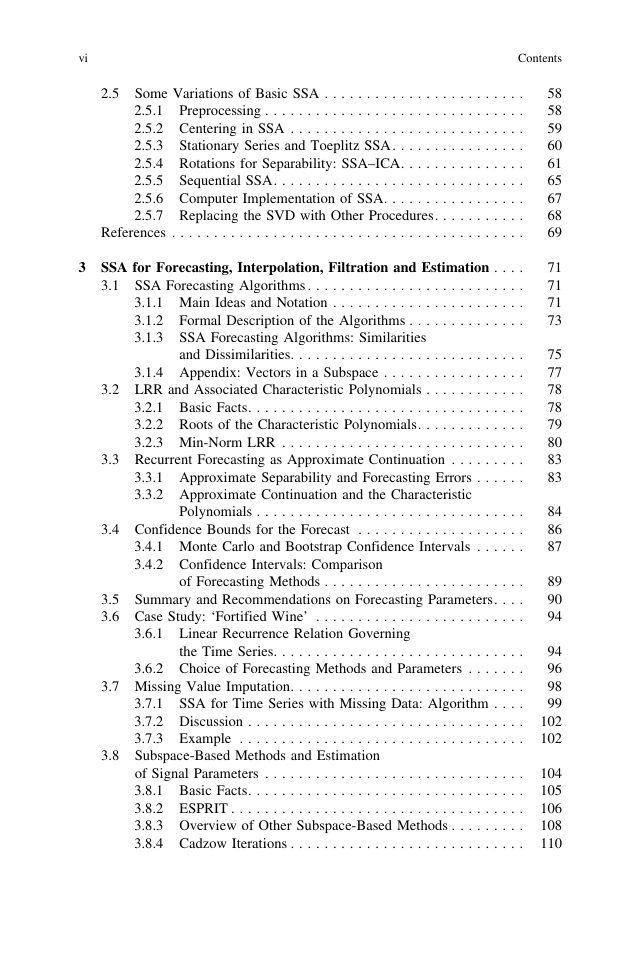
vi Contents 2.5 Some Variations of Basic SSA . . . . . . . . . . . . . . . . . . . . . . . . 2.5.1 Preprocessing . . . . . . . . . . . . . . . . . . . . . . . . . . . . . . . 2.5.2 Centering in SSA . . . . . . . . . . . . . . . . . . . . . . . . . . . . 2.5.3 Stationary Series and Toeplitz SSA. . . . . . . . . . . . . . . . 2.5.4 Rotations for Separability: SSA–ICA. . . . . . . . . . . . . . . 2.5.5 Sequential SSA. . . . . . . . . . . . . . . . . . . . . . . . . . . . . . 2.5.6 Computer Implementation of SSA. . . . . . . . . . . . . . . . . 2.5.7 Replacing the SVD with Other Procedures. . . . . . . . . . . References . . . . . . . . . . . . . . . . . . . . . . . . . . . . . . . . . . . . . . . . . . 3 SSA for Forecasting, Interpolation, Filtration and Estimation . . . . 3.1 SSA Forecasting Algorithms . . . . . . . . . . . . . . . . . . . . . . . . . . 3.1.1 Main Ideas and Notation . . . . . . . . . . . . . . . . . . . . . . . 3.1.2 Formal Description of the Algorithms . . . . . . . . . . . . . . 3.1.3 SSA Forecasting Algorithms: Similarities and Dissimilarities. . . . . . . . . . . . . . . . . . . . . . . . . . . . 3.1.4 Appendix: Vectors in a Subspace . . . . . . . . . . . . . . . . . 3.2 LRR and Associated Characteristic Polynomials . . . . . . . . . . . . 3.2.1 Basic Facts. . . . . . . . . . . . . . . . . . . . . . . . . . . . . . . . . 3.2.2 Roots of the Characteristic Polynomials. . . . . . . . . . . . . 3.2.3 Min-Norm LRR . . . . . . . . . . . . . . . . . . . . . . . . . . . . . 3.3 Recurrent Forecasting as Approximate Continuation . . . . . . . . . 3.3.1 Approximate Separability and Forecasting Errors . . . . . . 3.3.2 Approximate Continuation and the Characteristic 3.4 Confidence Bounds for the Forecast Polynomials . . . . . . . . . . . . . . . . . . . . . . . . . . . . . . . . . . . . . . . . . . . . . . . . . . . . 3.4.1 Monte Carlo and Bootstrap Confidence Intervals . . . . . . 3.4.2 Confidence Intervals: Comparison of Forecasting Methods . . . . . . . . . . . . . . . . . . . . . . . . 3.5 Summary and Recommendations on Forecasting Parameters. . . . 3.6 Case Study: ‘Fortified Wine’ . . . . . . . . . . . . . . . . . . . . . . . . . 3.6.1 Linear Recurrence Relation Governing the Time Series. . . . . . . . . . . . . . . . . . . . . . . . . . . . . . 3.6.2 Choice of Forecasting Methods and Parameters . . . . . . . 3.7 Missing Value Imputation. . . . . . . . . . . . . . . . . . . . . . . . . . . . 3.7.1 SSA for Time Series with Missing Data: Algorithm . . . . 3.7.2 Discussion . . . . . . . . . . . . . . . . . . . . . . . . . . . . . . . . . 3.7.3 Example . . . . . . . . . . . . . . . . . . . . . . . . . . . . . . . . . . 3.8 Subspace-Based Methods and Estimation of Signal Parameters . . . . . . . . . . . . . . . . . . . . . . . . . . . . . . . 3.8.1 Basic Facts. . . . . . . . . . . . . . . . . . . . . . . . . . . . . . . . . 3.8.2 ESPRIT . . . . . . . . . . . . . . . . . . . . . . . . . . . . . . . . . . . 3.8.3 Overview of Other Subspace-Based Methods . . . . . . . . . 3.8.4 Cadzow Iterations . . . . . . . . . . . . . . . . . . . . . . . . . . . . 58 58 59 60 61 65 67 68 69 71 71 71 73 75 77 78 78 79 80 83 83 84 86 87 89 90 94 94 96 98 99 102 102 104 105 106 108 110
Contents 3.9 SSA and Filters . . . . . . . . . . . . . . . . . . . . . . . . . . . . . . . . . . . 3.9.1 Linear Filters and Their Characteristics . . . . . . . . . . . . . 3.9.2 SSA Reconstruction as a Linear Filter . . . . . . . . . . . . . . 3.9.3 Middle Point Filter . . . . . . . . . . . . . . . . . . . . . . . . . . . 3.9.4 Last Point Filter and Forecasting . . . . . . . . . . . . . . . . . 3.9.5 Causal SSA (Last-Point SSA). . . . . . . . . . . . . . . . . . . . References . . . . . . . . . . . . . . . . . . . . . . . . . . . . . . . . . . . . . . . . . . vii 111 111 112 113 115 116 118
Chapter 1 Introduction 1.1 Preliminaries Singular spectrum analysis (SSA) is a technique of time series analysis and forecasting. It combines elements of classical time series analysis, multivariate sta- tistics, multivariate geometry, dynamical systems and signal processing. SSA aims at decomposing the original series into a sum of a small number of interpretable com- ponents such as a slowly varying trend, oscillatory components and a ‘structureless’ noise. It is based on the singular value decomposition (SVD) of a specific matrix constructed upon the time series. Neither a parametric model nor stationarity-type conditions have to be assumed for the time series. This makes SSA a model-free method and hence enables SSA to have a very wide range of applicability. The present book is fully devoted to the methodology of SSA. It exhibits the huge potential of SSA and shows how to use SSA both safely and with maximum effect. Potential readers of the book. (a) Professional statisticians and econometricians; (b) specialists in any discipline where problems of time series analysis and forecast- ing occur; (c) specialists in signal processing and those needed to extract signals from noisy data; (d) PhD students working on topics related to time series analy- sis; (e) students taking appropriate MSc courses on applied time series analysis; (f) anyone interested in the interdisciplinarity of statistics and mathematics. Historical remarks. The first publication, which can be considered as one of the origins of SSA (and more generally of the subspace-based methods of signal processing), can be traced back to the eighteenth century [28]. The commencement of SSA is usually associated with publication in 1986 of the papers [4, 5] by Broomhead and King. Since then SSA has received a fair amount of attention in literature. Additionally to [4, 5] the list of most cited papers on SSA published in the 1980s and 1990s includes [2, 10, 32, 33]. There are three books fully devoted to SSA, [8, 9, 14]. The book [9] is well written but it only provides a very elementary introduction to SSA. The volume [8] is a collection of papers written entirely by statisticians based at that time at St.Petersburg university. All these papers are devoted to the so-called ‘Caterpillar’ N. Golyandina and A. Zhigljavsky, Singular Spectrum Analysis for Time Series, SpringerBriefs in Statistics, DOI: 10.1007/978-3-642-34913-3_1, © The Author(s) 2013 1
2 1 Introduction methodology (the words ‘Caterpillar’ or ‘Gusenitsa’ is due to the association with the moving window). This methodology is a version of SSA that was developed in the former Soviet Union independently (the ‘iron curtain effect’) of the mainstream SSA. The work on the ‘Caterpillar’ methodology has started long after publication of [28] but well before 1986, the year of publication of [4] and [5]. The main difference between the main-stream SSA of [2, 4, 5, 10, 32, 33] and the ‘Caterpillar’ SSA is not in the algorithmic details but rather in the assumptions and in the emphasis in the study of SSA properties. To apply the mainstream SSA, one often needs to assume some kind of stationarity of the time series and think in terms of the ‘signal plus noise’ model (where the noise is often assumed to be ‘red’). In the ‘Caterpillar’ SSA, the main methodological stress is on separability (of one component of the series from another one) and neither the assumption of stationarity nor the model in the form ‘signal plus noise’ are required. The main methodological principles described in [8] have been further developed in the monograph [14]. The publication of [14] has helped to attract much wider atten- tion to SSA from the statistical circles as well as many other scientific communities. During the last 10 years much new SSA-related research has been done and many new successful applications of SSA have been reported. A recent special issue of ‘Statistics and Its Interface’ [35] gives an indication of how much progress in the- oretical and methodological developments of SSA, as well as its applications, has been achieved in recent years. The SSA community regularly organizes international workshops on SSA. The latest SSA workshop was held in Beijing in May 2012, see http://www.cefs.ac.cn/express/SSA.html. The research on the theory and methodology of SSA performed in the last two decades has resulted in a rather pleasing state of affairs: (i) the existence of an active SSA community and (ii) the existence of a general methodology of SSA rather than simply a collection of many different SSA algorithms. This methodology unifies different versions of SSA into a very powerful tool of time series analysis and forecasting. Description of SSA methodology is the sole purpose of the present book. Correspondence between the present book and [14]. Some entirely new topics are included (for example, Sect. 3.7–3.9) but a few topics thoroughly described in [14] are not considered at all (see, for example, [14, Chap. 3]). This volume is fully devoted to the methodology of SSA unlike [14], where many theoretical issues were also considered. The material is correspondingly revised in view of the new objectives. The main aim of [14] is to establish SSA as a serious subject. There is no need to do it now and the aspiration of this book is to show the power and beauty of SSA to as wide audience as possible. Several reasons why SSA is still not very popular among statisticians. First reason is tradition: SSA is not a classical statistical method, and therefore many people are simply not aware of it. Second, SSA demands more computing power than the traditional methods.Third, many people prefer model-based statistical techniques where calculations are automatic and do not require the computer-analyst interaction. Finally, SSA is sometimes too flexible (especially when analyzing multivariate series) and therefore has too many options which are difficult to formalize.
分享到:
收藏