Berkshire’s Performance vs. the S&P 500
Year
1965 . . . . . . . . . . . . . . . . . . . . . . . . . . . . . . . . . . . . . . . . . . . . . . . . .
1966 . . . . . . . . . . . . . . . . . . . . . . . . . . . . . . . . . . . . . . . . . . . . . . . . .
1967 . . . . . . . . . . . . . . . . . . . . . . . . . . . . . . . . . . . . . . . . . . . . . . . . .
1968 . . . . . . . . . . . . . . . . . . . . . . . . . . . . . . . . . . . . . . . . . . . . . . . . .
1969 . . . . . . . . . . . . . . . . . . . . . . . . . . . . . . . . . . . . . . . . . . . . . . . . .
1970 . . . . . . . . . . . . . . . . . . . . . . . . . . . . . . . . . . . . . . . . . . . . . . . . .
1971 . . . . . . . . . . . . . . . . . . . . . . . . . . . . . . . . . . . . . . . . . . . . . . . . .
1972 . . . . . . . . . . . . . . . . . . . . . . . . . . . . . . . . . . . . . . . . . . . . . . . . .
1973 . . . . . . . . . . . . . . . . . . . . . . . . . . . . . . . . . . . . . . . . . . . . . . . . .
1974 . . . . . . . . . . . . . . . . . . . . . . . . . . . . . . . . . . . . . . . . . . . . . . . . .
1975 . . . . . . . . . . . . . . . . . . . . . . . . . . . . . . . . . . . . . . . . . . . . . . . . .
1976 . . . . . . . . . . . . . . . . . . . . . . . . . . . . . . . . . . . . . . . . . . . . . . . . .
1977 . . . . . . . . . . . . . . . . . . . . . . . . . . . . . . . . . . . . . . . . . . . . . . . . .
1978 . . . . . . . . . . . . . . . . . . . . . . . . . . . . . . . . . . . . . . . . . . . . . . . . .
1979 . . . . . . . . . . . . . . . . . . . . . . . . . . . . . . . . . . . . . . . . . . . . . . . . .
1980 . . . . . . . . . . . . . . . . . . . . . . . . . . . . . . . . . . . . . . . . . . . . . . . . .
1981 . . . . . . . . . . . . . . . . . . . . . . . . . . . . . . . . . . . . . . . . . . . . . . . . .
1982 . . . . . . . . . . . . . . . . . . . . . . . . . . . . . . . . . . . . . . . . . . . . . . . . .
1983 . . . . . . . . . . . . . . . . . . . . . . . . . . . . . . . . . . . . . . . . . . . . . . . . .
1984 . . . . . . . . . . . . . . . . . . . . . . . . . . . . . . . . . . . . . . . . . . . . . . . . .
1985 . . . . . . . . . . . . . . . . . . . . . . . . . . . . . . . . . . . . . . . . . . . . . . . . .
1986 . . . . . . . . . . . . . . . . . . . . . . . . . . . . . . . . . . . . . . . . . . . . . . . . .
1987 . . . . . . . . . . . . . . . . . . . . . . . . . . . . . . . . . . . . . . . . . . . . . . . . .
1988 . . . . . . . . . . . . . . . . . . . . . . . . . . . . . . . . . . . . . . . . . . . . . . . . .
1989 . . . . . . . . . . . . . . . . . . . . . . . . . . . . . . . . . . . . . . . . . . . . . . . . .
1990 . . . . . . . . . . . . . . . . . . . . . . . . . . . . . . . . . . . . . . . . . . . . . . . . .
1991 . . . . . . . . . . . . . . . . . . . . . . . . . . . . . . . . . . . . . . . . . . . . . . . . .
1992 . . . . . . . . . . . . . . . . . . . . . . . . . . . . . . . . . . . . . . . . . . . . . . . . .
1993 . . . . . . . . . . . . . . . . . . . . . . . . . . . . . . . . . . . . . . . . . . . . . . . . .
1994 . . . . . . . . . . . . . . . . . . . . . . . . . . . . . . . . . . . . . . . . . . . . . . . . .
1995 . . . . . . . . . . . . . . . . . . . . . . . . . . . . . . . . . . . . . . . . . . . . . . . . .
1996 . . . . . . . . . . . . . . . . . . . . . . . . . . . . . . . . . . . . . . . . . . . . . . . . .
1997 . . . . . . . . . . . . . . . . . . . . . . . . . . . . . . . . . . . . . . . . . . . . . . . . .
1998 . . . . . . . . . . . . . . . . . . . . . . . . . . . . . . . . . . . . . . . . . . . . . . . . .
1999 . . . . . . . . . . . . . . . . . . . . . . . . . . . . . . . . . . . . . . . . . . . . . . . . .
2000 . . . . . . . . . . . . . . . . . . . . . . . . . . . . . . . . . . . . . . . . . . . . . . . . .
2001 . . . . . . . . . . . . . . . . . . . . . . . . . . . . . . . . . . . . . . . . . . . . . . . . .
2002 . . . . . . . . . . . . . . . . . . . . . . . . . . . . . . . . . . . . . . . . . . . . . . . . .
2003 . . . . . . . . . . . . . . . . . . . . . . . . . . . . . . . . . . . . . . . . . . . . . . . . .
2004 . . . . . . . . . . . . . . . . . . . . . . . . . . . . . . . . . . . . . . . . . . . . . . . . .
2005 . . . . . . . . . . . . . . . . . . . . . . . . . . . . . . . . . . . . . . . . . . . . . . . . .
2006 . . . . . . . . . . . . . . . . . . . . . . . . . . . . . . . . . . . . . . . . . . . . . . . . .
2007 . . . . . . . . . . . . . . . . . . . . . . . . . . . . . . . . . . . . . . . . . . . . . . . . .
2008 . . . . . . . . . . . . . . . . . . . . . . . . . . . . . . . . . . . . . . . . . . . . . . . . .
2009 . . . . . . . . . . . . . . . . . . . . . . . . . . . . . . . . . . . . . . . . . . . . . . . . .
2010 . . . . . . . . . . . . . . . . . . . . . . . . . . . . . . . . . . . . . . . . . . . . . . . . .
2011 . . . . . . . . . . . . . . . . . . . . . . . . . . . . . . . . . . . . . . . . . . . . . . . . .
2012 . . . . . . . . . . . . . . . . . . . . . . . . . . . . . . . . . . . . . . . . . . . . . . . . .
2013 . . . . . . . . . . . . . . . . . . . . . . . . . . . . . . . . . . . . . . . . . . . . . . . . .
2014 . . . . . . . . . . . . . . . . . . . . . . . . . . . . . . . . . . . . . . . . . . . . . . . . .
2015 . . . . . . . . . . . . . . . . . . . . . . . . . . . . . . . . . . . . . . . . . . . . . . . . .
2016 . . . . . . . . . . . . . . . . . . . . . . . . . . . . . . . . . . . . . . . . . . . . . . . . .
2017 . . . . . . . . . . . . . . . . . . . . . . . . . . . . . . . . . . . . . . . . . . . . . . . . .
2018 . . . . . . . . . . . . . . . . . . . . . . . . . . . . . . . . . . . . . . . . . . . . . . . . .
Compounded Annual Gain – 1965-2018 . . . . . . . . . . . . . . . . . . . . .
Overall Gain – 1964-2018 . . . . . . . . . . . . . . . . . . . . . . . . . . . . . . . .
in Per-Share
Book Value of
Berkshire
Annual Percentage Change
in Per-Share
Market Value of
Berkshire
in S&P 500
with Dividends
Included
23.8
20.3
11.0
19.0
16.2
12.0
16.4
21.7
4.7
5.5
21.9
59.3
31.9
24.0
35.7
19.3
31.4
40.0
32.3
13.6
48.2
26.1
19.5
20.1
44.4
7.4
39.6
20.3
14.3
13.9
43.1
31.8
34.1
48.3
0.5
6.5
(6.2)
10.0
21.0
10.5
6.4
18.4
11.0
(9.6)
19.8
13.0
4.6
14.4
18.2
8.3
6.4
10.7
23.0
0.4
18.7%
1,091,899%
49.5
(3.4)
13.3
77.8
19.4
(4.6)
80.5
8.1
(2.5)
(48.7)
2.5
129.3
46.8
14.5
102.5
32.8
31.8
38.4
69.0
(2.7)
93.7
14.2
4.6
59.3
84.6
(23.1)
35.6
29.8
38.9
25.0
57.4
6.2
34.9
52.2
(19.9)
26.6
6.5
(3.8)
15.8
4.3
0.8
24.1
28.7
(31.8)
2.7
21.4
(4.7)
16.8
32.7
27.0
(12.5)
23.4
21.9
2.8
20.5%
2,472,627%
10.0
(11.7)
30.9
11.0
(8.4)
3.9
14.6
18.9
(14.8)
(26.4)
37.2
23.6
(7.4)
6.4
18.2
32.3
(5.0)
21.4
22.4
6.1
31.6
18.6
5.1
16.6
31.7
(3.1)
30.5
7.6
10.1
1.3
37.6
23.0
33.4
28.6
21.0
(9.1)
(11.9)
(22.1)
28.7
10.9
4.9
15.8
5.5
(37.0)
26.5
15.1
2.1
16.0
32.4
13.7
1.4
12.0
21.8
(4.4)
9.7%
15,019%
Note: Data are for calendar years with these exceptions: 1965 and 1966, year ended 9/30; 1967, 15 months ended 12/31. Starting in 1979, accounting rules
required insurance companies to value the equity securities they hold at market rather than at the lower of cost or market, which was previously the requirement.
In this table, Berkshire’s results through 1978 have been restated to conform to the changed rules. In all other respects, the results are calculated using the
numbers originally reported. The S&P 500 numbers are pre-tax whereas the Berkshire numbers are after-tax. If a corporation such as Berkshire were simply
to have owned the S&P 500 and accrued the appropriate taxes, its results would have lagged the S&P 500 in years when that index showed a positive return,
but would have exceeded the S&P 500 in years when the index showed a negative return. Over the years, the tax costs would have caused the aggregate lag to
be substantial.
2
�
BERKSHIRE HATHAWAY INC.
To the Shareholders of Berkshire Hathaway Inc.:
Berkshire earned $4.0 billion in 2018 utilizing generally accepted accounting principles (commonly called
“GAAP”). The components of that figure are $24.8 billion in operating earnings, a $3.0 billion non-cash loss from an
impairment of intangible assets (arising almost entirely from our equity interest in Kraft Heinz), $2.8 billion in realized
capital gains from the sale of investment securities and a $20.6 billion loss from a reduction in the amount of unrealized
capital gains that existed in our investment holdings.
A new GAAP rule requires us to include that last item in earnings. As I emphasized in the 2017 annual report,
neither Berkshire’s Vice Chairman, Charlie Munger, nor I believe that rule to be sensible. Rather, both of us have
consistently thought that at Berkshire this mark-to-market change would produce what I described as “wild and
capricious swings in our bottom line.”
The accuracy of that prediction can be suggested by our quarterly results during 2018. In the first and fourth
quarters, we reported GAAP losses of $1.1 billion and $25.4 billion respectively. In the second and third quarters, we
reported profits of $12 billion and $18.5 billion. In complete contrast to these gyrations, the many businesses that
Berkshire owns delivered consistent and satisfactory operating earnings in all quarters. For the year, those earnings
exceeded their 2016 high of $17.6 billion by 41%.
Wide swings in our quarterly GAAP earnings will inevitably continue. That’s because our huge equity
portfolio – valued at nearly $173 billion at the end of 2018 – will often experience one-day price fluctuations of $2
billion or more, all of which the new rule says must be dropped immediately to our bottom line. Indeed, in the fourth
quarter, a period of high volatility in stock prices, we experienced several days with a “profit” or “loss” of more than
$4 billion.
Our advice? Focus on operating earnings, paying little attention to gains or losses of any variety. My saying
that in no way diminishes the importance of our investments to Berkshire. Over time, Charlie and I expect them to
deliver substantial gains, albeit with highly irregular timing.
* * * * * * * * * * * *
Long-time readers of our annual reports will have spotted the different way in which I opened this letter. For
nearly three decades, the initial paragraph featured the percentage change in Berkshire’s per-share book value. It’s
now time to abandon that practice.
The fact is that the annual change in Berkshire’s book value – which makes its farewell appearance on page
2 – is a metric that has lost the relevance it once had. Three circumstances have made that so. First, Berkshire has
gradually morphed from a company whose assets are concentrated in marketable stocks into one whose major value
resides in operating businesses. Charlie and I expect that reshaping to continue in an irregular manner. Second, while
our equity holdings are valued at market prices, accounting rules require our collection of operating companies to be
included in book value at an amount far below their current value, a mismark that has grown in recent years. Third, it
is likely that – over time – Berkshire will be a significant repurchaser of its shares, transactions that will take place at
prices above book value but below our estimate of intrinsic value. The math of such purchases is simple: Each
transaction makes per-share intrinsic value go up, while per-share book value goes down. That combination causes
the book-value scorecard to become increasingly out of touch with economic reality.
3
�
In future tabulations of our financial results, we expect to focus on Berkshire’s market price. Markets can be
extremely capricious: Just look at the 54-year history laid out on page 2. Over time, however, Berkshire’s stock price
will provide the best measure of business performance.
* * * * * * * * * * * *
Before moving on, I want to give you some good news – really good news – that is not reflected in our
financial statements. It concerns the management changes we made in early 2018, when Ajit Jain was put in charge
of all insurance activities and Greg Abel was given authority over all other operations. These moves were overdue.
Berkshire is now far better managed than when I alone was supervising operations. Ajit and Greg have rare talents,
and Berkshire blood flows through their veins.
Now let’s take a look at what you own.
Focus on the Forest – Forget the Trees
Investors who evaluate Berkshire sometimes obsess on the details of our many and diverse businesses – our
economic “trees,” so to speak. Analysis of that type can be mind-numbing, given that we own a vast array of
specimens, ranging from twigs to redwoods. A few of our trees are diseased and unlikely to be around a decade from
now. Many others, though, are destined to grow in size and beauty.
Fortunately, it’s not necessary to evaluate each tree individually to make a rough estimate of Berkshire’s
intrinsic business value. That’s because our forest contains five “groves” of major importance, each of which can be
appraised, with reasonable accuracy, in its entirety. Four of those groves are differentiated clusters of businesses and
financial assets that are easy to understand. The fifth – our huge and diverse insurance operation – delivers great value
to Berkshire in a less obvious manner, one I will explain later in this letter.
Before we look more closely at the first four groves, let me remind you of our prime goal in the deployment
of your capital: to buy ably-managed businesses, in whole or part, that possess favorable and durable economic
characteristics. We also need to make these purchases at sensible prices.
Sometimes we can buy control of companies that meet our tests. Far more often, we find the attributes we
seek in publicly-traded businesses, in which we normally acquire a 5% to 10% interest. Our two-pronged approach to
huge-scale capital allocation is rare in corporate America and, at times, gives us an important advantage.
In recent years, the sensible course for us to follow has been clear: Many stocks have offered far more for
our money than we could obtain by purchasing businesses in their entirety. That disparity led us to buy about $43
billion of marketable equities last year, while selling only $19 billion. Charlie and I believe the companies in which
we invested offered excellent value, far exceeding that available in takeover transactions.
Despite our recent additions to marketable equities, the most valuable grove in Berkshire’s forest remains the
many dozens of non-insurance businesses that Berkshire controls (usually with 100% ownership and never with less
than 80%). Those subsidiaries earned $16.8 billion last year. When we say “earned,” moreover, we are describing what
remains after all
interest payments, managerial compensation (whether cash or stock-based),
restructuring expenses, depreciation, amortization and home-office overhead.
income taxes,
That brand of earnings is a far cry from that frequently touted by Wall Street bankers and corporate CEOs.
Too often, their presentations feature “adjusted EBITDA,” a measure that redefines “earnings” to exclude a variety of
all-too-real costs.
4
�
For example, managements sometimes assert that their company’s stock-based compensation shouldn’t be
counted as an expense. (What else could it be – a gift from shareholders?) And restructuring expenses? Well, maybe
last year’s exact rearrangement won’t recur. But restructurings of one sort or another are common in business –
Berkshire has gone down that road dozens of times, and our shareholders have always borne the costs of doing so.
Abraham Lincoln once posed the question: “If you call a dog’s tail a leg, how many legs does it have?” and
then answered his own query: “Four, because calling a tail a leg doesn’t make it one.” Abe would have felt lonely on
Wall Street.
Charlie and I do contend that our acquisition-related amortization expenses of $1.4 billion (detailed on page
K-84) are not a true economic cost. We add back such amortization “costs” to GAAP earnings when we are evaluating
both private businesses and marketable stocks.
In contrast, Berkshire’s $8.4 billion depreciation charge understates our true economic cost. In fact, we need
to spend more than this sum annually to simply remain competitive in our many operations. Beyond those
“maintenance” capital expenditures, we spend large sums in pursuit of growth. Overall, Berkshire invested a record
$14.5 billion last year in plant, equipment and other fixed assets, with 89% of that spent in America.
Berkshire’s runner-up grove by value is its collection of equities, typically involving a 5% to 10% ownership
position in a very large company. As noted earlier, our equity investments were worth nearly $173 billion at yearend,
an amount far above their cost. If the portfolio had been sold at its yearend valuation, federal income tax of about
$14.7 billion would have been payable on the gain. In all likelihood, we will hold most of these stocks for a long time.
Eventually, however, gains generate taxes at whatever rate prevails at the time of sale.
Our investees paid us dividends of $3.8 billion last year, a sum that will increase in 2019. Far more important
than the dividends, though, are the huge earnings that are annually retained by these companies. Consider, as an
indicator, these figures that cover only our five largest holdings.
Company
American Express
Apple
Bank of America
Coca-Cola
Wells Fargo
Total
Yearend
Ownership
17.9%
5.4%
9.5%
9.4%
9.8%
Berkshire’s Share in $ millions of
Dividends(1)
Retained Earnings(2)
$ 237
745
551
624
809
$2,966
$ 997
2,502
2,096
(21)
1,263
$6,837
(1) Based on current annual rate.
(2) Based on 2018 earnings minus common and preferred dividends paid.
GAAP – which dictates the earnings we report – does not allow us to include the retained earnings of
investees in our financial accounts. But those earnings are of enormous value to us: Over the years, earnings retained
by our investees (viewed as a group) have eventually delivered capital gains to Berkshire that totaled more than one
dollar for each dollar these companies reinvested for us.
All of our major holdings enjoy excellent economics, and most use a portion of their retained earnings to
repurchase their shares. We very much like that: If Charlie and I think an investee’s stock is underpriced, we rejoice
when management employs some of its earnings to increase Berkshire’s ownership percentage.
5
�
Here’s one example drawn from the table above: Berkshire’s holdings of American Express have remained
unchanged over the past eight years. Meanwhile, our ownership increased from 12.6% to 17.9% because of
repurchases made by the company. Last year, Berkshire’s portion of the $6.9 billion earned by American Express was
$1.2 billion, about 96% of the $1.3 billion we paid for our stake in the company. When earnings increase and shares
outstanding decrease, owners – over time – usually do well.
A third category of Berkshire’s business ownership is a quartet of companies in which we share control with
other parties. Our portion of the after-tax operating earnings of these businesses – 26.7% of Kraft Heinz, 50% of
Berkadia and Electric Transmission Texas, and 38.6% of Pilot Flying J – totaled about $1.3 billion in 2018.
In our fourth grove, Berkshire held $112 billion at yearend in U.S. Treasury bills and other cash equivalents,
and another $20 billion in miscellaneous fixed-income instruments. We consider a portion of that stash to be
untouchable, having pledged to always hold at least $20 billion in cash equivalents to guard against external calamities.
We have also promised to avoid any activities that could threaten our maintaining that buffer.
Berkshire will forever remain a financial fortress. In managing, I will make expensive mistakes of
commission and will also miss many opportunities, some of which should have been obvious to me. At times, our
stock will tumble as investors flee from equities. But I will never risk getting caught short of cash.
In the years ahead, we hope to move much of our excess liquidity into businesses that Berkshire will
permanently own. The immediate prospects for that, however, are not good: Prices are sky-high for businesses
possessing decent long-term prospects.
That disappointing reality means that 2019 will likely see us again expanding our holdings of marketable
equities. We continue, nevertheless, to hope for an elephant-sized acquisition. Even at our ages of 88 and 95 – I’m the
young one – that prospect is what causes my heart and Charlie’s to beat faster. (Just writing about the possibility of a
huge purchase has caused my pulse rate to soar.)
My expectation of more stock purchases is not a market call. Charlie and I have no idea as to how stocks will
behave next week or next year. Predictions of that sort have never been a part of our activities. Our thinking, rather,
is focused on calculating whether a portion of an attractive business is worth more than its market price.
I believe Berkshire’s intrinsic value can be approximated by summing the values of our four asset-laden
groves and then subtracting an appropriate amount for taxes eventually payable on the sale of marketable securities.
* * * * * * * * * * * *
You may ask whether an allowance should not also be made for the major tax costs Berkshire would incur if
we were to sell certain of our wholly-owned businesses. Forget that thought: It would be foolish for us to sell any of
our wonderful companies even if no tax would be payable on its sale. Truly good businesses are exceptionally hard to
find. Selling any you are lucky enough to own makes no sense at all.
The interest cost on all of our debt has been deducted as an expense in calculating the earnings at Berkshire’s
non-insurance businesses. Beyond that, much of our ownership of the first four groves is financed by funds generated
from Berkshire’s fifth grove – a collection of exceptional insurance companies. We call those funds “float,” a source
of financing that we expect to be cost-free – or maybe even better than that – over time. We will explain the
characteristics of float later in this letter.
Finally, a point of key and lasting importance: Berkshire’s value is maximized by our having assembled the
five groves into a single entity. This arrangement allows us to seamlessly and objectively allocate major amounts of
capital, eliminate enterprise risk, avoid insularity, fund assets at exceptionally low cost, occasionally take advantage
of tax efficiencies, and minimize overhead.
At Berkshire, the whole is greater – considerably greater – than the sum of the parts.
6
�
Repurchases and Reporting
Earlier I mentioned that Berkshire will from time to time be repurchasing its own stock. Assuming that we
buy at a discount to Berkshire’s intrinsic value – which certainly will be our intention – repurchases will benefit both
those shareholders leaving the company and those who stay.
True, the upside from repurchases is very slight for those who are leaving. That’s because careful buying by
us will minimize any impact on Berkshire’s stock price. Nevertheless, there is some benefit to sellers in having an
extra buyer in the market.
For continuing shareholders, the advantage is obvious: If the market prices a departing partner’s interest at,
say, 90¢ on the dollar, continuing shareholders reap an increase in per-share intrinsic value with every repurchase by
the company. Obviously, repurchases should be price-sensitive: Blindly buying an overpriced stock is value-
destructive, a fact lost on many promotional or ever-optimistic CEOs.
When a company says that it contemplates repurchases, it’s vital that all shareholder-partners be given the
information they need to make an intelligent estimate of value. Providing that information is what Charlie and I try to
do in this report. We do not want a partner to sell shares back to the company because he or she has been misled or
inadequately informed.
Some sellers, however, may disagree with our calculation of value and others may have found investments
that they consider more attractive than Berkshire shares. Some of that second group will be right: There are
unquestionably many stocks that will deliver far greater gains than ours.
In addition, certain shareholders will simply decide it’s time for them or their families to become net
consumers rather than continuing to build capital. Charlie and I have no current interest in joining that group. Perhaps
we will become big spenders in our old age.
For 54 years our managerial decisions at Berkshire have been made from the viewpoint of the shareholders
who are staying, not those who are leaving. Consequently, Charlie and I have never focused on current-quarter results.
* * * * * * * * * * * *
Berkshire, in fact, may be the only company in the Fortune 500 that does not prepare monthly earnings reports
or balance sheets. I, of course, regularly view the monthly financial reports of most subsidiaries. But Charlie and I
learn of Berkshire’s overall earnings and financial position only on a quarterly basis.
Furthermore, Berkshire has no company-wide budget (though many of our subsidiaries find one useful). Our
lack of such an instrument means that the parent company has never had a quarterly “number” to hit. Shunning the
use of this bogey sends an important message to our many managers, reinforcing the culture we prize.
Over the years, Charlie and I have seen all sorts of bad corporate behavior, both accounting and operational,
induced by the desire of management to meet Wall Street expectations. What starts as an “innocent” fudge in order to
not disappoint “the Street” – say, trade-loading at quarter-end, turning a blind eye to rising insurance losses, or drawing
down a “cookie-jar” reserve – can become the first step toward full-fledged fraud. Playing with the numbers “just this
once” may well be the CEO’s intent; it’s seldom the end result. And if it’s okay for the boss to cheat a little, it’s easy
for subordinates to rationalize similar behavior.
At Berkshire, our audience is neither analysts nor commentators: Charlie and I are working for our
shareholder-partners. The numbers that flow up to us will be the ones we send on to you.
7
�
Non-Insurance Operations – From Lollipops to Locomotives
Let’s now look further at Berkshire’s most valuable grove – our collection of non-insurance businesses –
keeping in mind that we do not wish to unnecessarily hand our competitors information that might be useful to them.
Additional details about individual operations can be found on pages K-5 – K-22 and pages K-40 – K-51.
Viewed as a group, these businesses earned pre-tax income in 2018 of $20.8 billion, a 24% increase over
2017. Acquisitions we made in 2018 delivered only a trivial amount of that gain.
I will stick with pre-tax figures in this discussion. But our after-tax gain in 2018 from these businesses was
far greater – 47% – thanks in large part to the cut in the corporate tax rate that became effective at the beginning of
that year. Let’s look at why the impact was so dramatic.
Begin with an economic reality: Like it or not, the U.S. Government “owns” an interest in Berkshire’s
earnings of a size determined by Congress. In effect, our country’s Treasury Department holds a special class of our
stock – call this holding the AA shares – that receives large “dividends” (that is, tax payments) from Berkshire. In
2017, as in many years before, the corporate tax rate was 35%, which meant that the Treasury was doing very well
with its AA shares. Indeed, the Treasury’s “stock,” which was paying nothing when we took over in 1965, had evolved
into a holding that delivered billions of dollars annually to the federal government.
Last year, however, 40% of the government’s “ownership” (14/35ths) was returned to Berkshire – free of
charge – when the corporate tax rate was reduced to 21%. Consequently, our “A” and “B” shareholders received a
major boost in the earnings attributable to their shares.
This happening materially increased the intrinsic value of the Berkshire shares you and I own. The same
dynamic, moreover, enhanced the intrinsic value of almost all of the stocks Berkshire holds.
Those are the headlines. But there are other factors to consider that tempered our gain. For example, the tax
benefits garnered by our large utility operation get passed along to its customers. Meanwhile, the tax rate applicable
to the substantial dividends we receive from domestic corporations is little changed at about 13%. (This lower rate has
long been logical because our investees have already paid tax on the earnings that they pay to us.) Overall, however,
the new law made our businesses and the stocks we own considerably more valuable.
Which suggests that we return to the performance of our non-insurance businesses. Our two towering redwoods
in this grove are BNSF and Berkshire Hathaway Energy (90.9% owned). Combined, they earned $9.3 billion before tax
last year, up 6% from 2017. You can read more about these businesses on pages K-5 – K-10 and pages K-40 – K-45.
Our next five non-insurance subsidiaries, as ranked by earnings (but presented here alphabetically), Clayton
Homes, International Metalworking, Lubrizol, Marmon and Precision Castparts, had aggregate pre-tax income in 2018
of $6.4 billion, up from the $5.5 billion these companies earned in 2017.
The next five, similarly ranked and listed (Forest River, Johns Manville, MiTek, Shaw and TTI) earned $2.4
billion pre-tax last year, up from $2.1 billion in 2017.
The remaining non-insurance businesses that Berkshire owns – and there are many – had pre-tax income of
$3.6 billion in 2018 vs. $3.3 billion in 2017.
8
�
Insurance, “Float,” and the Funding of Berkshire
Our property/casualty (“P/C”) insurance business – our fifth grove – has been the engine propelling
Berkshire’s growth since 1967, the year we acquired National Indemnity and its sister company, National Fire &
Marine, for $8.6 million. Today, National Indemnity is the largest property/casualty company in the world as measured
by net worth.
One reason we were attracted to the P/C business was the industry’s business model: P/C insurers receive
premiums upfront and pay claims later. In extreme cases, such as claims arising from exposure to asbestos, or severe
workplace accidents, payments can stretch over many decades.
This collect-now, pay-later model leaves P/C companies holding large sums – money we call “float” – that
will eventually go to others. Meanwhile, insurers get to invest this float for their own benefit. Though individual
policies and claims come and go, the amount of float an insurer holds usually remains fairly stable in relation to
premium volume. Consequently, as our business grows, so does our float. And how it has grown, as the following
table shows:
Year
1970
1980
1990
2000
2010
2018
Float (in millions)*
$
39
237
1,632
27,871
65,832
122,732
*
Includes float arising from life, annuity and health insurance businesses.
We may in time experience a decline in float. If so, the decline will be very gradual – at the outside no more
than 3% in any year. The nature of our insurance contracts is such that we can never be subject to immediate or near-
term demands for sums that are of significance to our cash resources. That structure is by design and is a key
component in the unequaled financial strength of our insurance companies. That strength will never be compromised.
If our premiums exceed the total of our expenses and eventual losses, our insurance operation registers an
underwriting profit that adds to the investment income the float produces. When such a profit is earned, we enjoy the
use of free money – and, better yet, get paid for holding it.
Unfortunately, the wish of all insurers to achieve this happy result creates intense competition, so vigorous
indeed that it sometimes causes the P/C industry as a whole to operate at a significant underwriting loss. That loss, in
effect, is what the industry pays to hold its float. Competitive dynamics almost guarantee that the insurance industry,
despite the float income all its companies enjoy, will continue its dismal record of earning subnormal returns on
tangible net worth as compared to other American businesses.
Nevertheless, I like our own prospects. Berkshire’s unrivaled financial strength allows us far more flexibility
in investing our float than that generally available to P/C companies. The many alternatives available to us are always
an advantage and occasionally offer major opportunities. When other insurers are constrained, our choices expand.
Moreover, our P/C companies have an excellent underwriting record. Berkshire has now operated at an
underwriting profit for 15 of the past 16 years, the exception being 2017, when our pre-tax loss was $3.2 billion. For
the entire 16-year span, our pre-tax gain totaled $27 billion, of which $2 billion was recorded in 2018.
9
�


 2025年软考高级信息系统项目管理师金色考点
 软考高项三色笔记
 镇安县双鑫矿业月河年处理15万吨尾渣综合加工利用项目水土保持报告表
  红杉资本:生成式AI最新市场格局.pdf
 wireshark 使用教程.pdf
 【2021年-贝佐斯致股东的信】.pdf
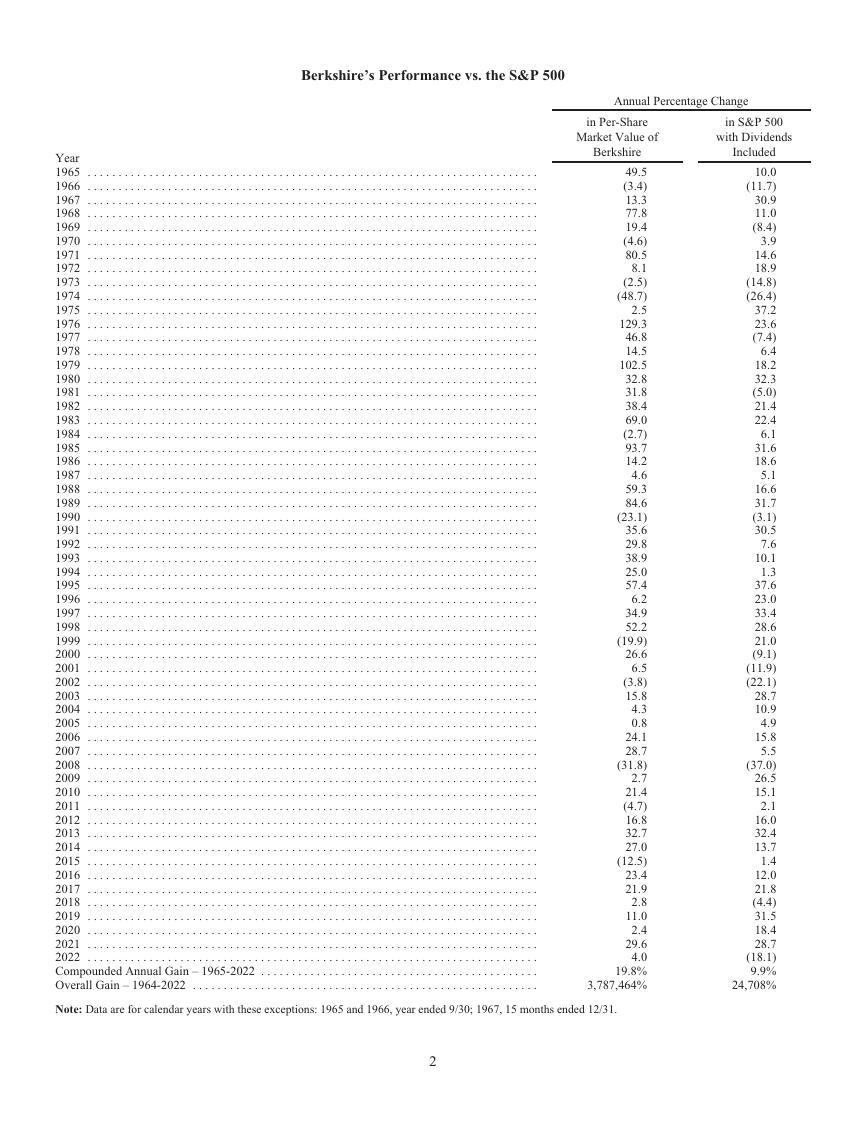 巴菲特致股东的公开信 - 2022.pdf
 MySQL 8.1 参考手册.pdf
 世界银行报告下载:激进政策缩紧浪潮不足遏制通胀 全球经济衰退迫在眉睫(Is a Global Recession Imminent?).pdf
 红杉资本报告:适应与忍耐(Adapting to Endure).pdf
 高保真音响系统设计制作-毕业论文.doc
 一种自适应互补滤波姿态估计算法.pdf