Bookcase
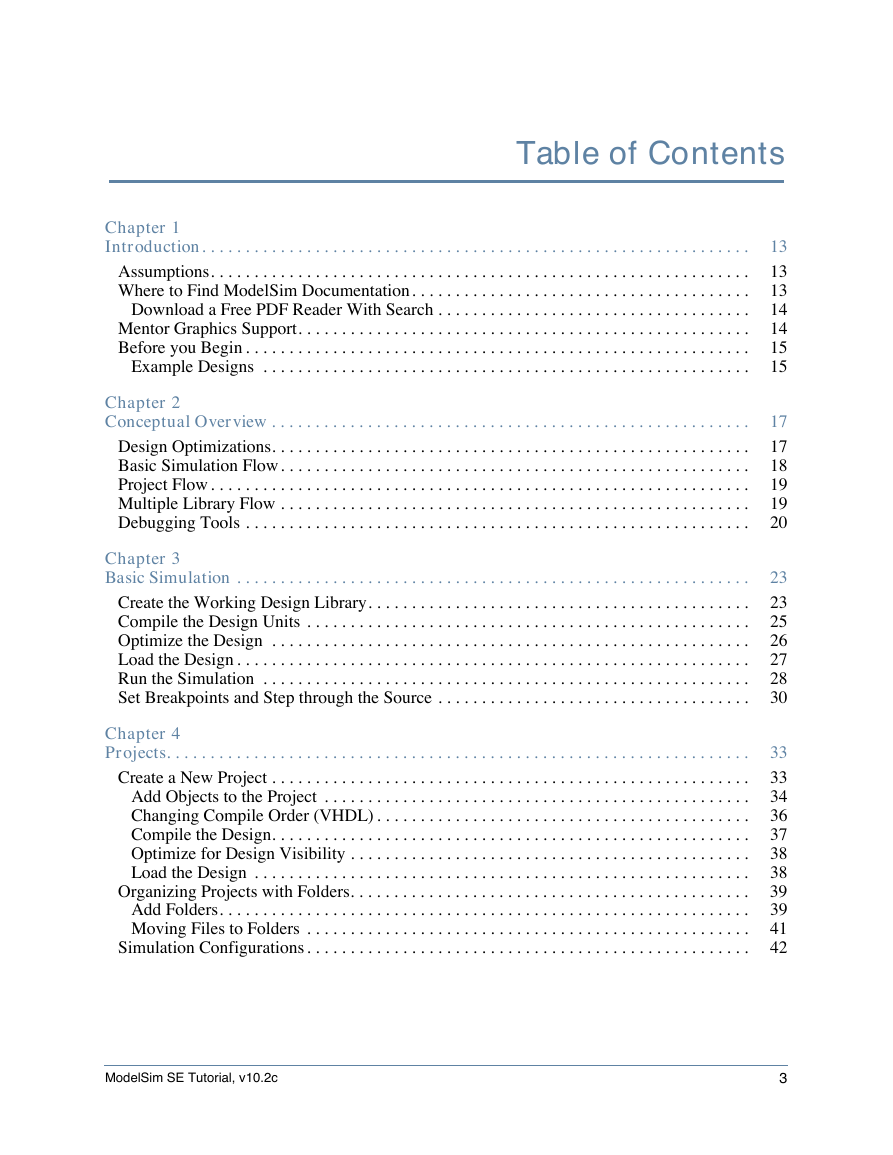
Table of Contents
List of Figures
List of Tables
Chapter 1 Introduction
Assumptions
Where to Find ModelSim Documentation
Download a Free PDF Reader With Search
Mentor Graphics Support
Before you Begin
Example Designs
Chapter 2 Conceptual Overview
Design Optimizations
Basic Simulation Flow
Project Flow
Multiple Library Flow
Debugging Tools
Chapter 3 Basic Simulation
Create the Working Design Library
Compile the Design Units
Optimize the Design
Load the Design
Run the Simulation
Set Breakpoints and Step through the Source
Chapter 4 Projects
Create a New Project
Add Objects to the Project
Changing Compile Order (VHDL)
Compile the Design
Optimize for Design Visibility
Load the Design
Organizing Projects with Folders
Add Folders
Moving Files to Folders
Simulation Configurations
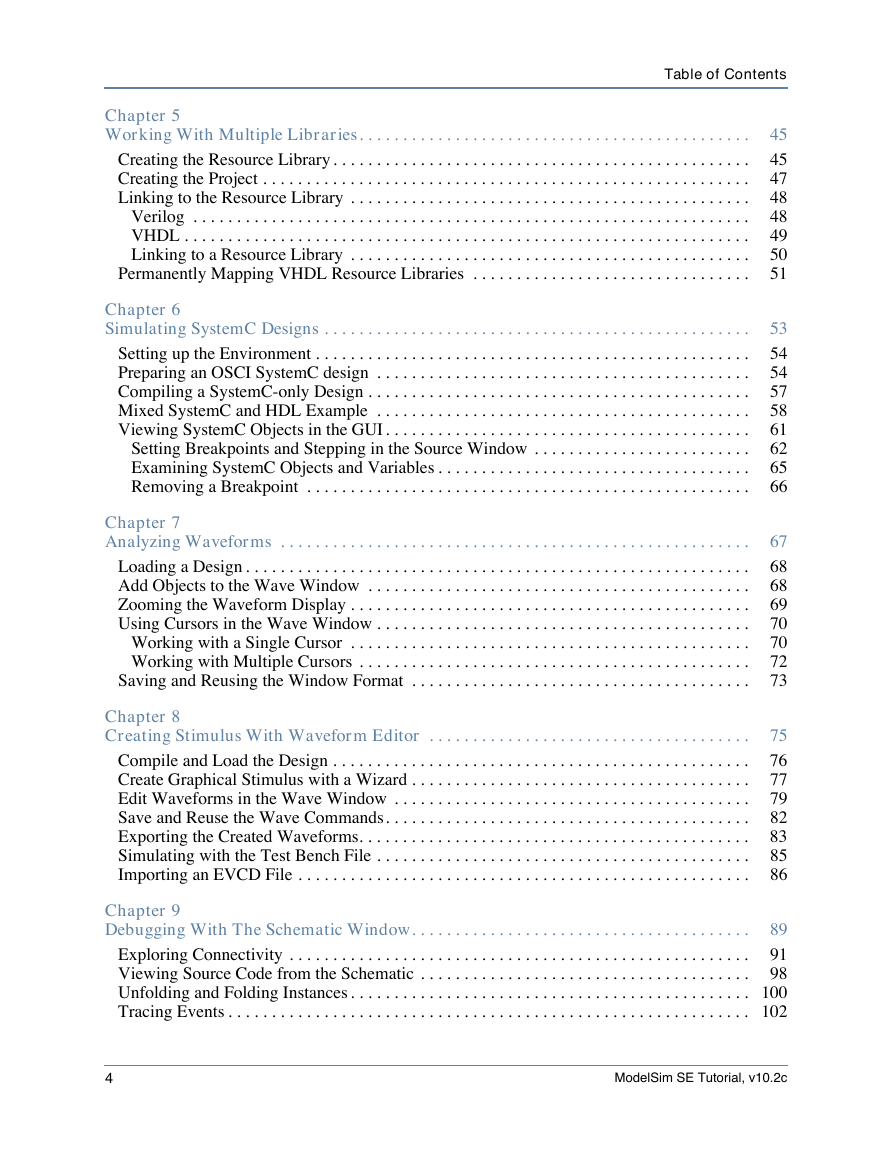
Chapter 5 Working With Multiple Libraries
Creating the Resource Library
Creating the Project
Linking to the Resource Library
Verilog
VHDL
Linking to a Resource Library
Permanently Mapping VHDL Resource Libraries
Chapter 6 Simulating SystemC Designs
Setting up the Environment
Preparing an OSCI SystemC design
Compiling a SystemC-only Design
Mixed SystemC and HDL Example
Viewing SystemC Objects in the GUI
Setting Breakpoints and Stepping in the Source Window
Examining SystemC Objects and Variables
Removing a Breakpoint
Chapter 7 Analyzing Waveforms
Loading a Design
Add Objects to the Wave Window
Zooming the Waveform Display
Using Cursors in the Wave Window
Working with a Single Cursor
Working with Multiple Cursors
Saving and Reusing the Window Format
Chapter 8 Creating Stimulus With Waveform Editor
Compile and Load the Design
Create Graphical Stimulus with a Wizard
Edit Waveforms in the Wave Window
Save and Reuse the Wave Commands
Exporting the Created Waveforms
Simulating with the Test Bench File
Importing an EVCD File
Chapter 9 Debugging With The Schematic Window
Exploring Connectivity
Viewing Source Code from the Schematic
Unfolding and Folding Instances
Tracing Events
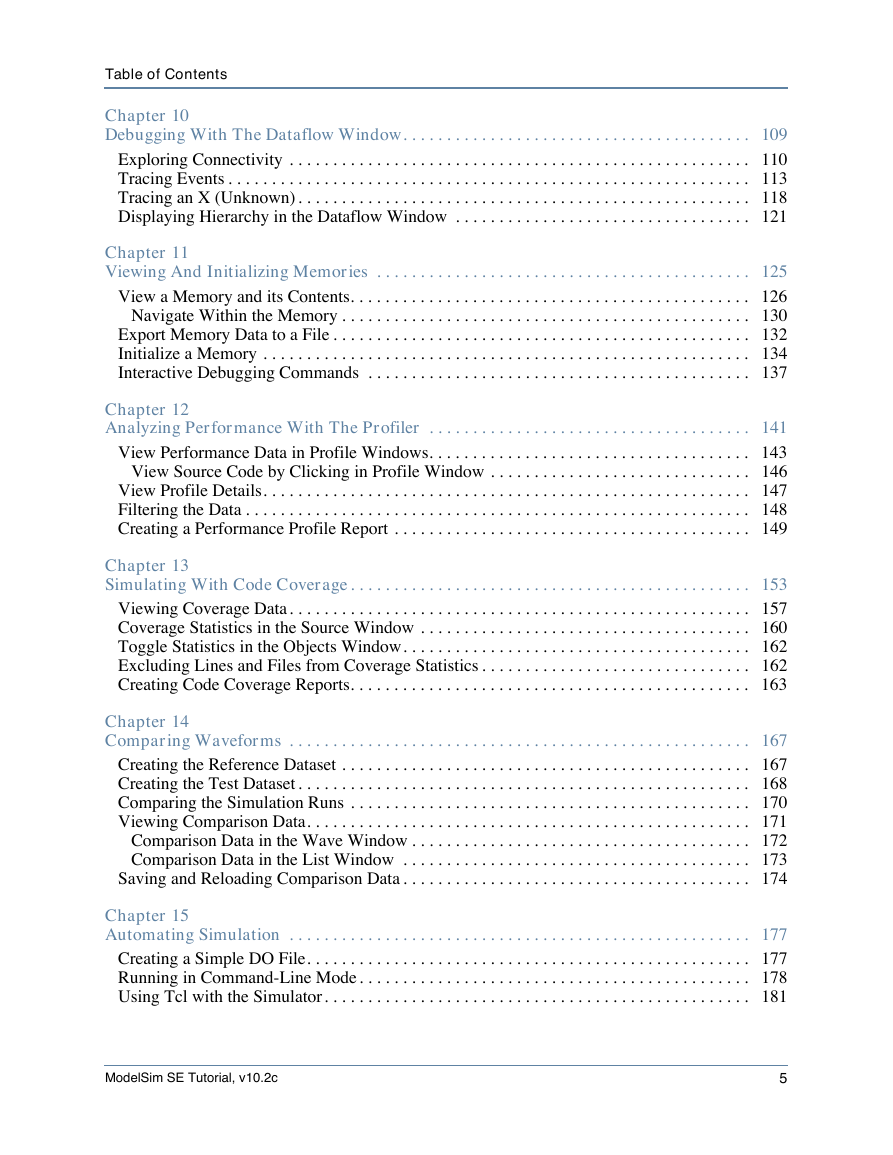
Chapter 10 Debugging With The Dataflow Window
Exploring Connectivity
Tracing Events
Tracing an X (Unknown)
Displaying Hierarchy in the Dataflow Window
Chapter 11 Viewing And Initializing Memories
View a Memory and its Contents
Navigate Within the Memory
Export Memory Data to a File
Initialize a Memory
Interactive Debugging Commands
Chapter 12 Analyzing Performance With The Profiler
View Performance Data in Profile Windows
View Source Code by Clicking in Profile Window
View Profile Details
Filtering the Data
Creating a Performance Profile Report
Chapter 13 Simulating With Code Coverage
Viewing Coverage Data
Coverage Statistics in the Source Window
Toggle Statistics in the Objects Window
Excluding Lines and Files from Coverage Statistics
Creating Code Coverage Reports
Chapter 14 Comparing Waveforms
Creating the Reference Dataset
Creating the Test Dataset
Comparing the Simulation Runs
Viewing Comparison Data
Comparison Data in the Wave Window
Comparison Data in the List Window
Saving and Reloading Comparison Data
Chapter 15 Automating Simulation
Creating a Simple DO File
Running in Command-Line Mode
Using Tcl with the Simulator
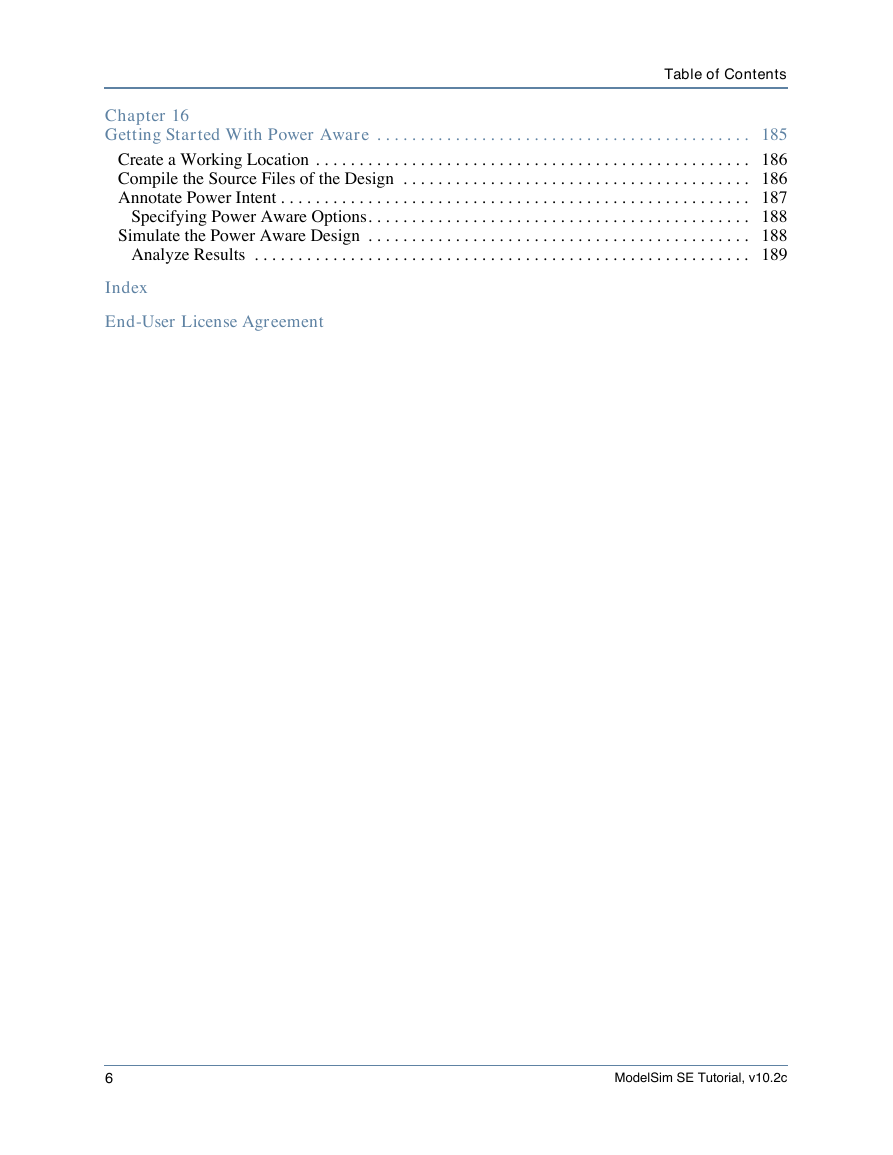
Chapter 16 Getting Started With Power Aware
Create a Working Location
Compile the Source Files of the Design
Annotate Power Intent
Specifying Power Aware Options
Simulate the Power Aware Design
Analyze Results
Results from Test 1 (power_down_normal)
Results from Test 2 (power_down_no_iso)
Results from Test 3 (power_down_no_clk_gate)
Results from Test 4 (sram_PWR)
Index
End-User License Agreement
Documentation Feedback



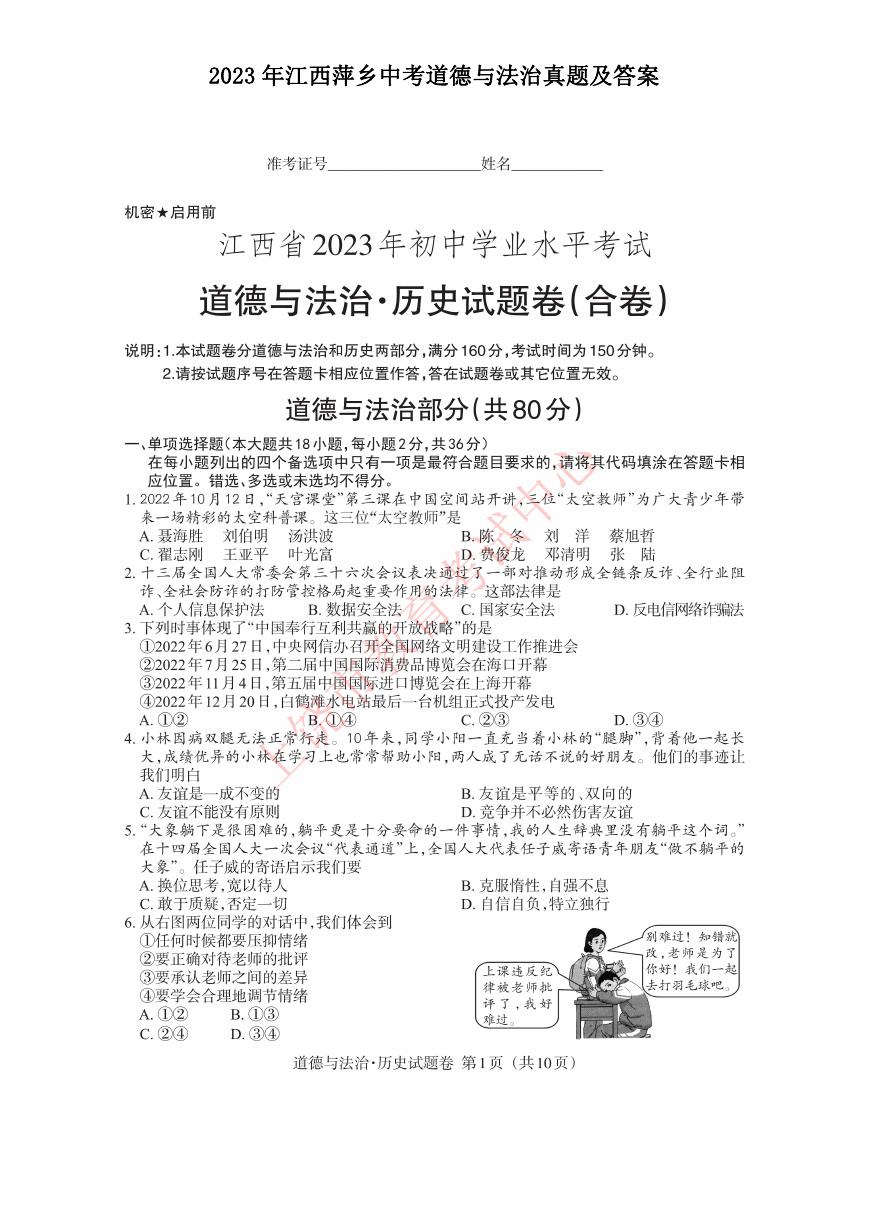 2023年江西萍乡中考道德与法治真题及答案.doc
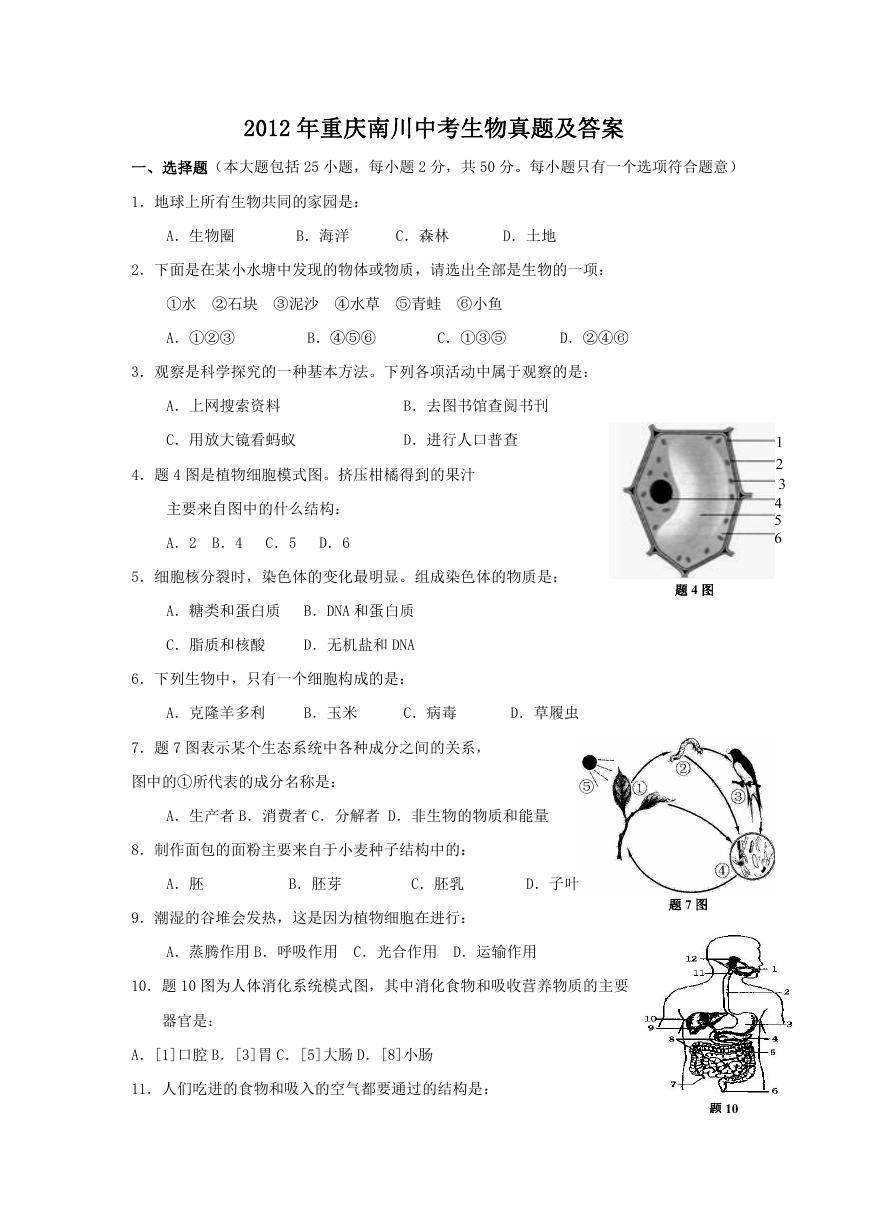 2012年重庆南川中考生物真题及答案.doc
 2013年江西师范大学地理学综合及文艺理论基础考研真题.doc
 2020年四川甘孜小升初语文真题及答案I卷.doc
 2020年注册岩土工程师专业基础考试真题及答案.doc
 2023-2024学年福建省厦门市九年级上学期数学月考试题及答案.doc
 2021-2022学年辽宁省沈阳市大东区九年级上学期语文期末试题及答案.doc
 2022-2023学年北京东城区初三第一学期物理期末试卷及答案.doc
 2018上半年江西教师资格初中地理学科知识与教学能力真题及答案.doc
 2012年河北国家公务员申论考试真题及答案-省级.doc
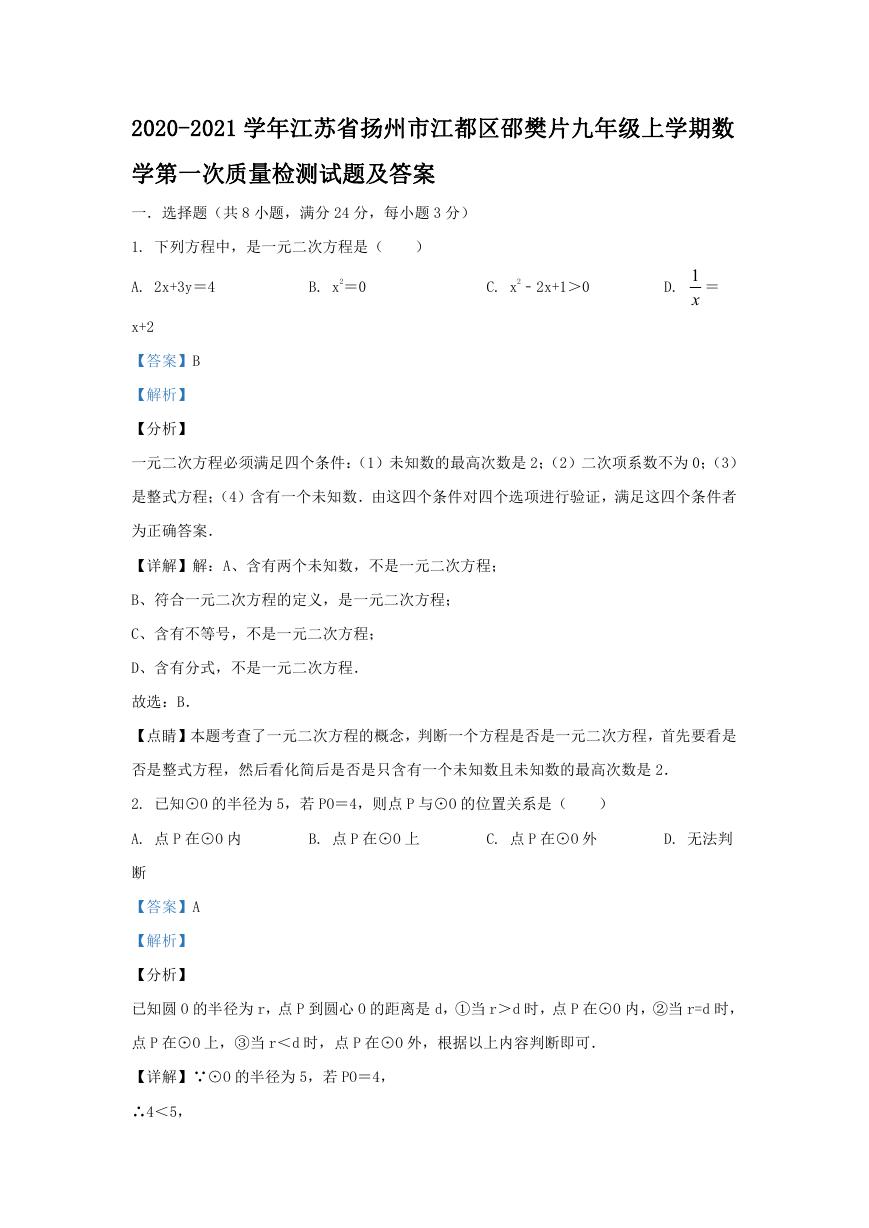 2020-2021学年江苏省扬州市江都区邵樊片九年级上学期数学第一次质量检测试题及答案.doc
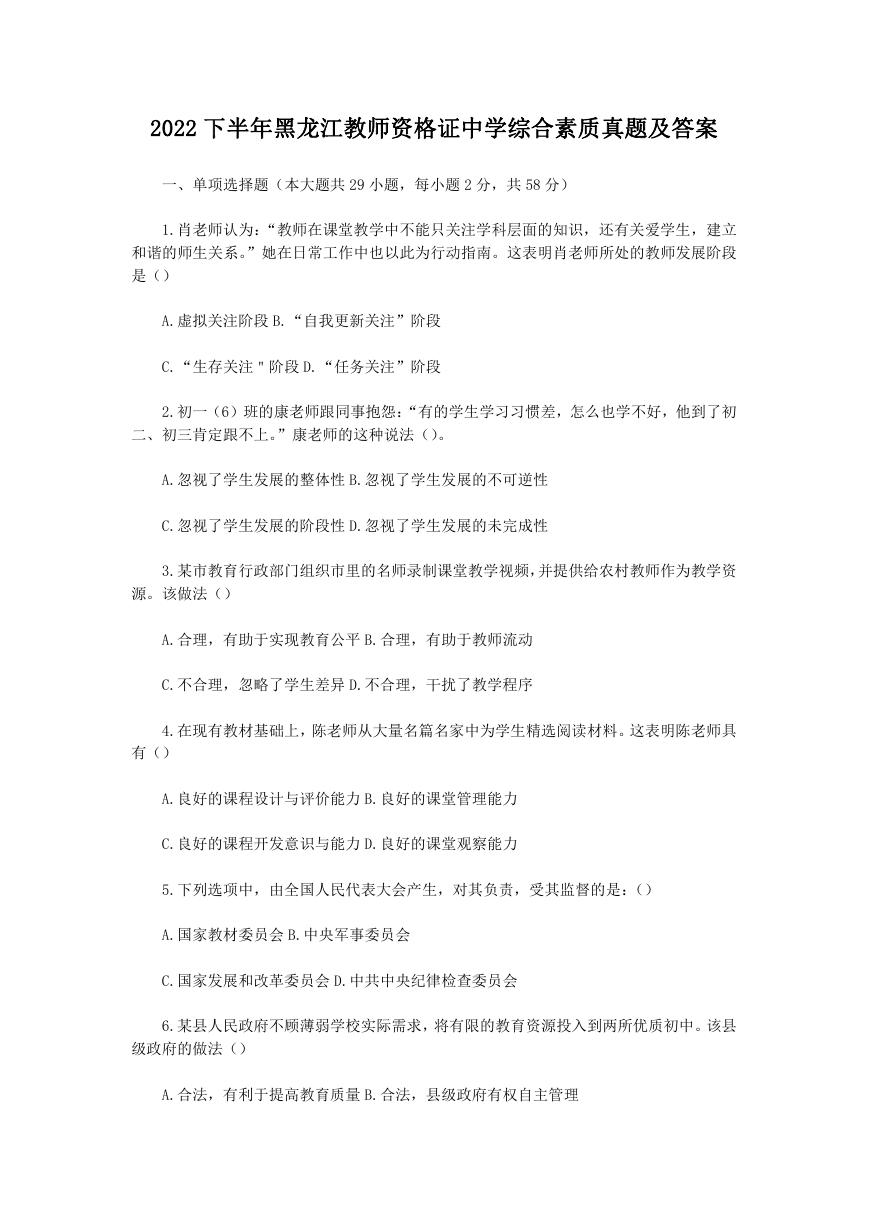 2022下半年黑龙江教师资格证中学综合素质真题及答案.doc