International Journal of Geosciences, 2017, 8, 1118-1132
http://www.scirp.org/journal/ijg
ISSN Online: 2156-8367
ISSN Print: 2156-8359
Analyzing the Mara River Basin Behaviour
through Rainfall-Runoff Modeling
Anne M. Birundu1, Benedict M. Mutua2*
1Murang’a University College, Nairobi, Kenya
2Deputy Vice-Chancellor (Planning, Partnerships, Research and Innovation), Kibabii University, Bungoma, Kenya
How to cite this paper: Birundu, A.M. and
Mutua, B.M. (2017) Analyzing the Mara
River Basin Behaviour
through Rain-
fall-Runoff Modeling. International Journal
of Geosciences, 8, 1118-1132.
https://doi.org/10.4236/ijg.2017.89064
Received: July 5, 2017
Accepted: September 19, 2017
Published: September 22, 2017
Copyright © 2017 by authors and
Scientific Research Publishing Inc.
This work is licensed under the Creative
Commons Attribution International
License (CC BY 4.0).
http://creativecommons.org/licenses/by/4.0/
Open Access
Abstract
Hydrological models are considered as necessary tools for water and envi-
ronmental resource management. However, modelling poorly gauged water-
sheds has been a challenge to hydrologists and hydraulic engineers. Research
done recently has shown the potential to overcome this challenge through in-
corporating satellite based hydrological and meteorological data in the meas-
ured data. This paper presents results for a study that used the semi-distributed
conceptual HBV Light Model to model the rainfall-runoff in the Mara River
Basin, Kenya. The model simulates runoff as a function of rainfall. It is built
on the basis established between satellite observed and in-situ rainfall, evapo-
ration, temperature and the measured runoff. The model’s performance and
reliability were evaluated over two sub-catchments namely: Nyangores and
Amala in the Mara River Basin using the Nash-Sutcliffe Efficiency which the
model referred to as Reff and the coefficient of determination (R2). The Reff for
Nyangores and Amala during the calibration and (validation) period were
0.65 (0.68) and 0.59 (0.62) respectively. The model showed good flow simula-
tions particularly during the recession flows, in the Nyangores sub-catchment
whereas it simulated poorly the short term fluctuations of the high-flow for
Amala sub-catchment. Results from this study can be used by water resources
managers to make informed decision on planning and management of water
resources.
Keywords
Hydrological Models, Satellite Data, HBV Light Model, Mara River Basin
1. Introduction
Kenya is characterized as water stressed country since the per capita water
DOI: 10.4236/ijg.2017.89064 Sep. 22, 2017
1118
International Journal of Geosciences
�
A. M. Birundu, B. M. Mutua
availability is at 792 m3 with a population of approximately 40 million people
[1]. With the increasing population, expanding urbanization, modernised life-
styles, climate changes and other global changes, the pressure for sustainable
planning and management of the finite water resources is more evident than
ever.
This paper focuses on a study that was carried out in the Mara River Basin
that cuts across Kenya and Tanzania. The Mara River Basin (MRB) covering a
drainage area of 13,750 km2 is one of the catchments of Lake Victoria and forms
part of the Upper Nile Basin. The Mara River (MR) which is about 395 km long
is one of the Rivers supplying water into Lake Victoria throughout the year. The
River originates from Mau Forest Complex which forms part of the upper basin.
The Mara River Basin (MRB) is characterized by the extensive cultivated land
and forested areas in the upper part, tropical savannah vegetation in the middle
of the basin and one of the world famous Mara-Serengeti ecosystem towards the
lower part of the Mara wetland form part of the extreme lower side of the Basin
on the Tanzania side where the River drains into Lake Victoria.
The Mara River Basin faces numerous interactions that require effective
management to ensure sustainability of its water resources since many liveli-
hoods depend on it. The basin has undergone several changes over the last 50
years as a result of increased human population [2].
The flow regime in the Mara River has changed over the years due to catch-
ment degradation. For instance, [3] in the study on Modelling the Impact of
Land-Cover and Rainfall Regime Change Scenarios on the Flow of Mara River
found out that there has been a decline in the dry season flow and increased
peak flood frequency in recent years. In another study by [4] where these re-
searchers applied the USGS Geospatial Stream Flow Model in studying the im-
pact of land use/cover on the hydrology of MRB, it was found out that forests
and savannah grasslands have been cleared and turned into agricultural lands. In
addition, the long-term monitoring also identified several areas of concern in the
upper catchment of the basin. For instance, the results showed that the Amala
sub-catchment has experienced higher decline in average monthly flow levels
over the last 15 years, transported higher sediment load per unit catchment area
and has generally lower water quality than the Nyangores sub-catchment, sug-
gesting land degradation in this sub-catchment may be responsible for declines
in water quantity and quality in the Mara River basin.
In order to effectively plan for the water resource use and to protect it under
the changing conditions, application of basin runoff models that can simulate
flow regimes under different scenarios of change [5] is required. However, the
availability of long term spatial and temporal quality hydro-meteorological data
has been a challenge in many river basins in Kenya. In order to overcome this
challenge, this study used the satellite observed rainfall products and the 30 m
resolution Shuttle Radar Topography Mission (SRTM) DEM which were derived
from open sources. The study applied a conceptual hydrological model, the Hy-
1119
International Journal of Geosciences
DOI: 10.4236/ijg.2017.89064
�
A. M. Birundu, B. M. Mutua
DOI: 10.4236/ijg.2017.89064
drologiska Byrans Vattenavdelning model (HBV Light Model) for run-off simu-
lation of the measured rainfall.
2. Materials and Methods
The Mara River Basin which is a trans-boundary basin covers approximately
13,750 km2. It lies between South Western Kenya and North Western Tanzania
at between longitudes 33˚47'E and 35˚47'E and Latitudes 0˚28'S and 1˚52'S. The
Napuiyapui swamp in the Mau Forest Complex, is the source for the Mara River
where it flows at an altitude of approximately 3000 metres above sea level
(m.a.s.l) South West before draining into Lake Victoria in Musoma Tanzania at
an altitude of 1134 metres above sea level [6]. The Nyangores and Amala Rivers
are the two main perennial tributaries of the Mara River and their respective
sub-basins form part of the Upper catchment. The other tributaries are; Talek,
Sand and Engare Ngobit rivers on the Kenyan side and the Bologonja River on
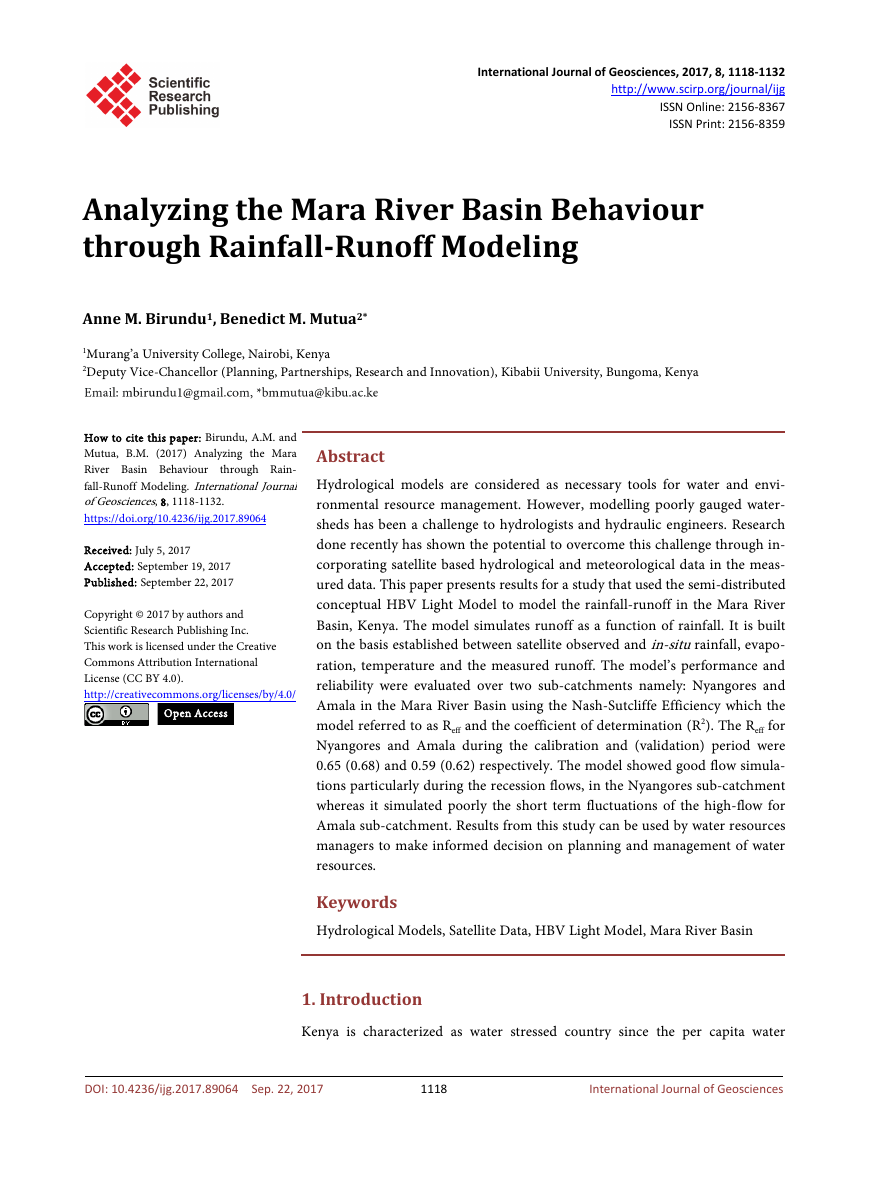
the Tanzania side (Figure 1). The amount of annual rainfall in the basin varies
from 1400 mm in the hills of the Mau Forest to 500 - 700 mm in the dry plains
of north-west Tanzania [7].
The study used the HBV model which simulates the daily discharge using in-
put variables of rainfall, temperature and potential evapotranspiration [8]. The
input data collected were checked for consistency as well as filling in the missing
data gaps for precipitation, discharge and temperature datasets. The main ap-
proach used was the correlations between the three hydro-meteorological sta-
tions (Narok, Kericho and Kisii) data. Thereafter, multiple linear regressions
were used to develop relationship equations which were then used to fill the
missing data gaps.
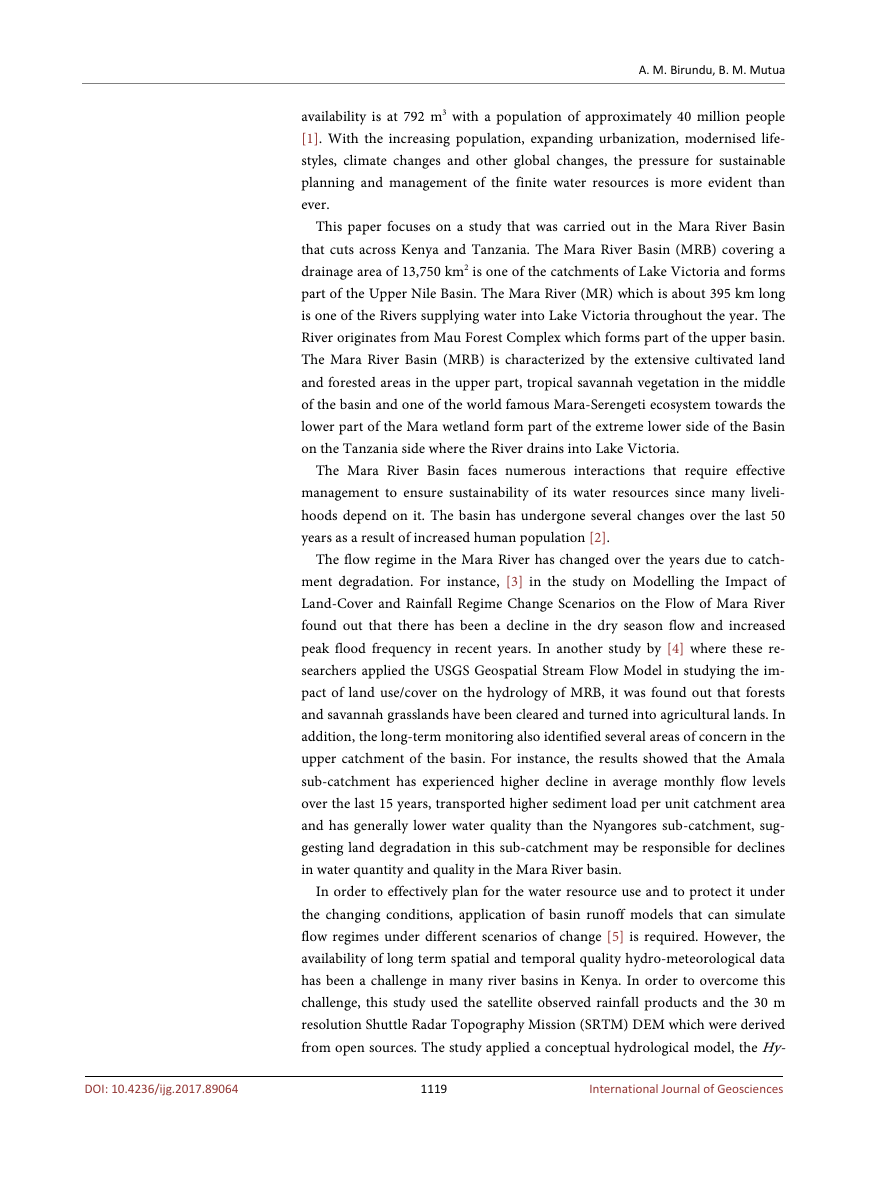
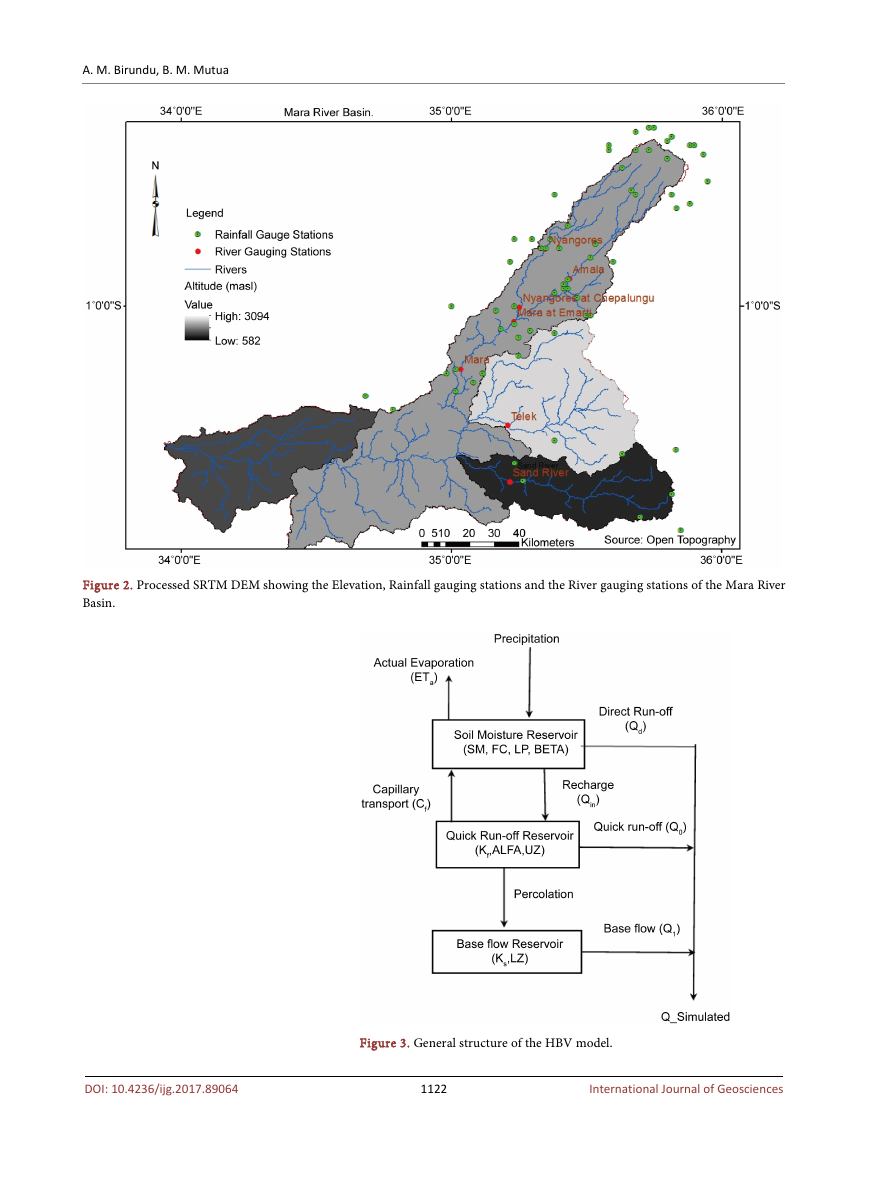
The records of only three out of the thirty six hydro-meteorological stations
on the Kenyan side as shown in Figure 2 were processed. The data was recorded
daily at 0900 hours and was expressed in millimetres per day (mm/day). The
area average precipitation Parea was calculated as weighted mean of precipitation
stations in and around the catchment. This was achieved through use of the
Thiessen polygons.
The temperature was calculated as weighted mean of the stations in and
around the catchment after the missing data was filled using multiple linear re-
gressions. The data was obtained from the Kenya Metrological Department.
Compared to other rivers within the Mara River basin, Nyangores and Amala
Rivers have long term daily discharge data records. Readings of water levels for
the two rivers were taken twice each day daily in the morning at 0600 hrs and in
the evening at 1800 hrs. Rating curves were then used to estimate daily average
discharges.
2.1. Application of Hydrologiska Byrans Vattenavdelning
(HBV Light) Model
The HBV light model which is a semi distributed conceptual model was selected
1120
International Journal of Geosciences
�
A. M. Birundu, B. M. Mutua
Figure 1. Site Map of the trans-boundary Mara River Basin, showing the Mara River with its tributaries. Source: (Melesse,
2012).
to simulate the rainfall runoff processes in the two sub-catchments. The model
was selected because of its suitability that has been demonstrated under different
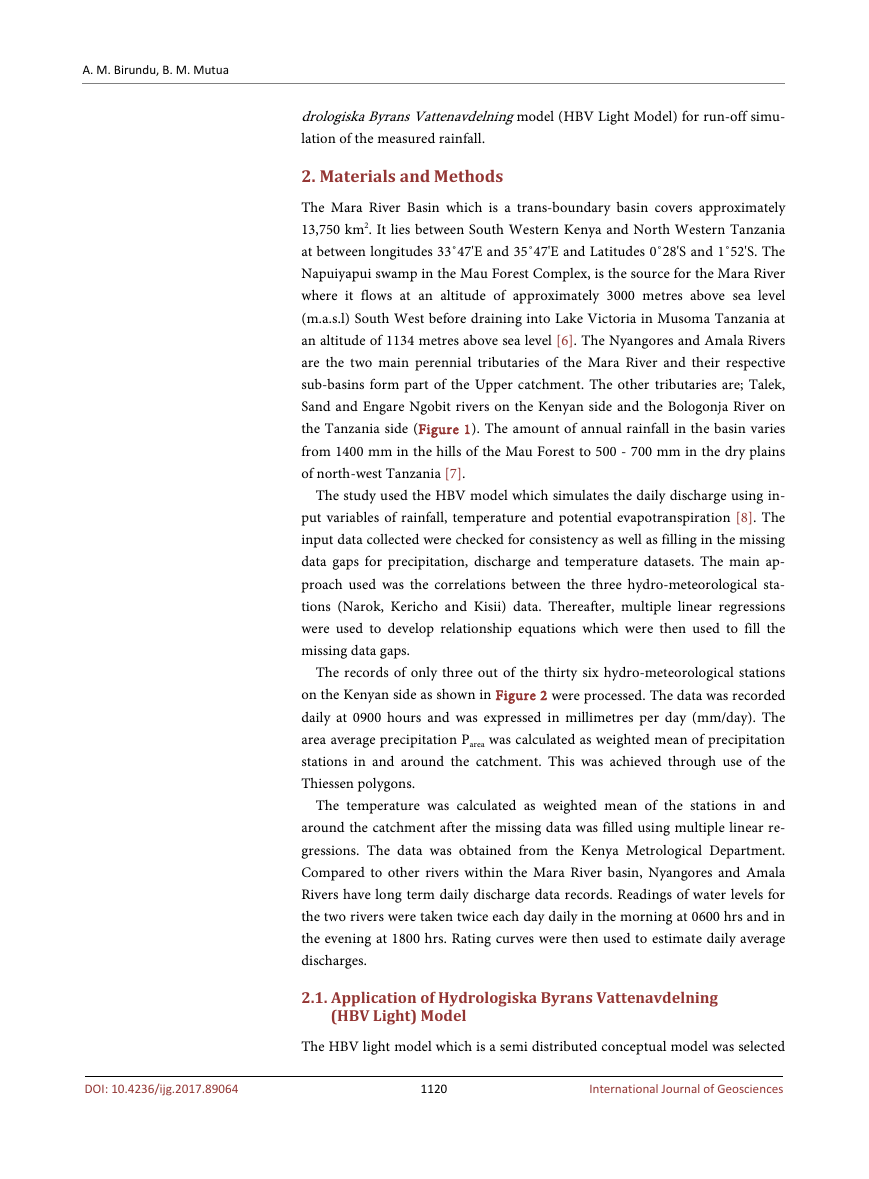
hydro climatic conditions in the world [9] [10]. The general structure and equa-
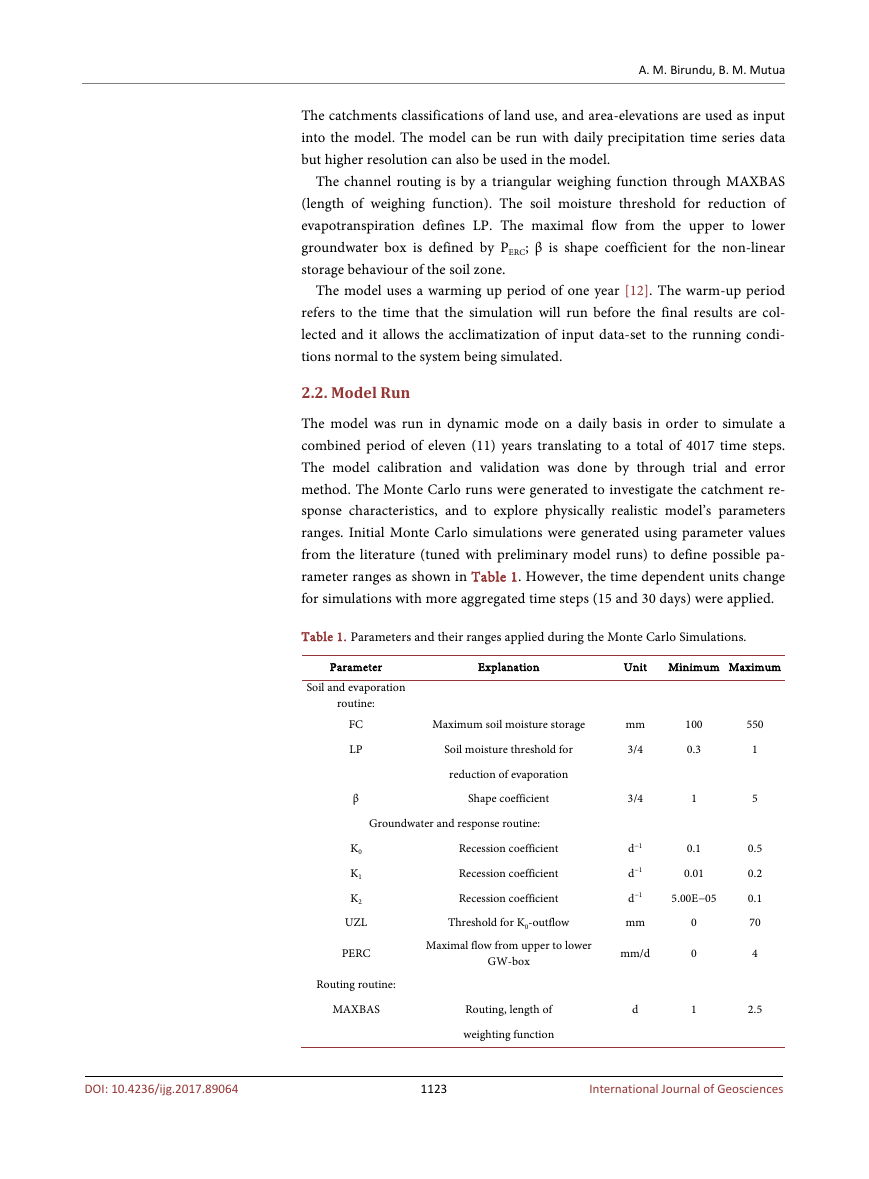
tions of HBV light model is summarized in Figure 3. The reservoirs are con-
nected to each other by means of exchange fluxes which define the amount of
water between the different zones. Equations (1) and (2) give the general water
balance. The HBV light model has four routines which include; the snow pack
(not used in this research), soil moisture, response function and routing routines
[11] as summarized in Figure 3.
S
∆
t
∆
=
Input Output
−
(1)
where; ∆S = Change in Storge and ∆t = Change over time
P E Q
− −
=
d
dt
(
SP SM UZ LZ lakes
+
+
+
+
)
(2)
where; P is precipitation, E is evaporation, Q is runoff, SP is the snow pack, and
SM is the soil moisture. The UZ and LZ are the upper and lower ground water
zones.
The HBV light model uses sub-catchments as the primary hydrological units.
1121
International Journal of Geosciences
DOI: 10.4236/ijg.2017.89064
�
A. M. Birundu, B. M. Mutua
Figure 2. Processed SRTM DEM showing the Elevation, Rainfall gauging stations and the River gauging stations of the Mara River
Basin.
DOI: 10.4236/ijg.2017.89064
Figure 3. General structure of the HBV model.
1122
International Journal of Geosciences
�
A. M. Birundu, B. M. Mutua
The catchments classifications of land use, and area-elevations are used as input
into the model. The model can be run with daily precipitation time series data
but higher resolution can also be used in the model.
The channel routing is by a triangular weighing function through MAXBAS
(length of weighing function). The soil moisture threshold for reduction of
evapotranspiration defines LP. The maximal flow from the upper to lower
groundwater box is defined by PERC; β is shape coefficient for the non-linear
storage behaviour of the soil zone.
The model uses a warming up period of one year [12]. The warm-up period
refers to the time that the simulation will run before the final results are col-
lected and it allows the acclimatization of input data-set to the running condi-
tions normal to the system being simulated.
2.2. Model Run
The model was run in dynamic mode on a daily basis in order to simulate a
combined period of eleven (11) years translating to a total of 4017 time steps.
The model calibration and validation was done by through trial and error
method. The Monte Carlo runs were generated to investigate the catchment re-
sponse characteristics, and to explore physically realistic model’s parameters
ranges. Initial Monte Carlo simulations were generated using parameter values
from the literature (tuned with preliminary model runs) to define possible pa-
rameter ranges as shown in Table 1. However, the time dependent units change
for simulations with more aggregated time steps (15 and 30 days) were applied.
Table 1. Parameters and their ranges applied during the Monte Carlo Simulations.
Explanation
Unit Minimum Maximum
Threshold for K0-outflow
Maximal flow from upper to lower
GW-box
mm
mm/d
Routing routine:
MAXBAS
Routing, length of
weighting function
d
0
0
1
DOI: 10.4236/ijg.2017.89064
1123
International Journal of Geosciences
Parameter
Soil and evaporation
routine:
FC
LP
β
Maximum soil moisture storage
Soil moisture threshold for
reduction of evaporation
Shape coefficient
Groundwater and response routine:
Recession coefficient
Recession coefficient
Recession coefficient
K0
K1
K2
UZL
PERC
mm
3/4
3/4
d−1
d−1
d−1
100
0.3
1
0.1
0.01
5.00E−05
550
1
5
0.5
0.2
0.1
70
4
2.5
�
A. M. Birundu, B. M. Mutua
Different parameter sets were produced by running more than 300,000 Monte
Carlo Simulations (MCS) for each catchment representation of the Nyangores
and Amala sub-catchments on daily time steps. The efficiency Reff value was used
for assessment of simulations by the HBV model. The Reff value compares the
prediction by the model with the simplest possible prediction, a constant value
of the observed mean value over the entire period. Several model parameter sets
with Reff comparable to the highest values were obtained.
3. Results and Discussions
The results show that in the Nyangores sub-catchment, a Reff > 0.65 was obtained
after running, 250,000 MCS. In the case of Amala sub-catchment, a Reff > 0.59
was obtained after running 100,000 simulations of the Monte Carlos. Based on
the Nash-Sutcliffe Efficiency criteria, the performance of the model was within
acceptable range as per the selected performance criteria.
In addition, to visual observation of the hydrographs and evaluation of low
flows (log Reff), the values of Reff > 0.65 and Reff > 0.59 were considered satisfac-
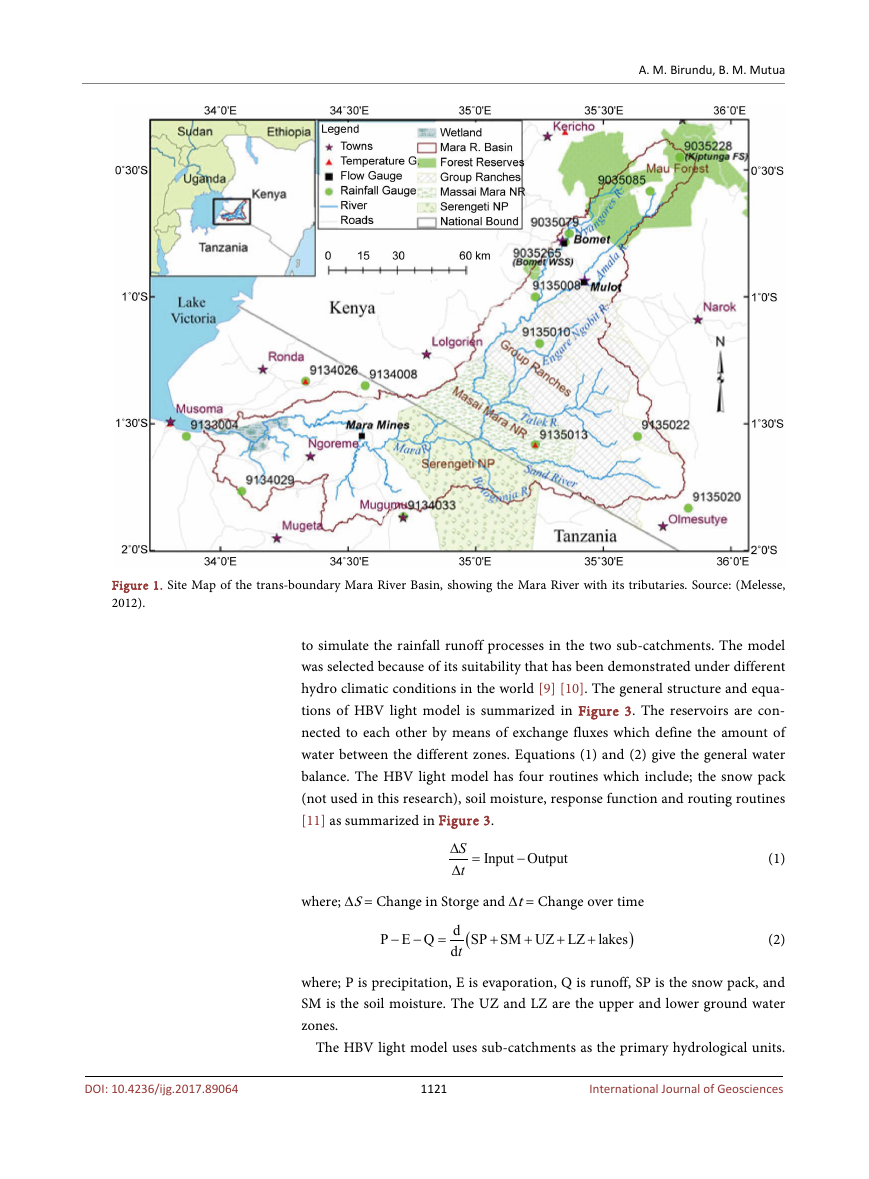
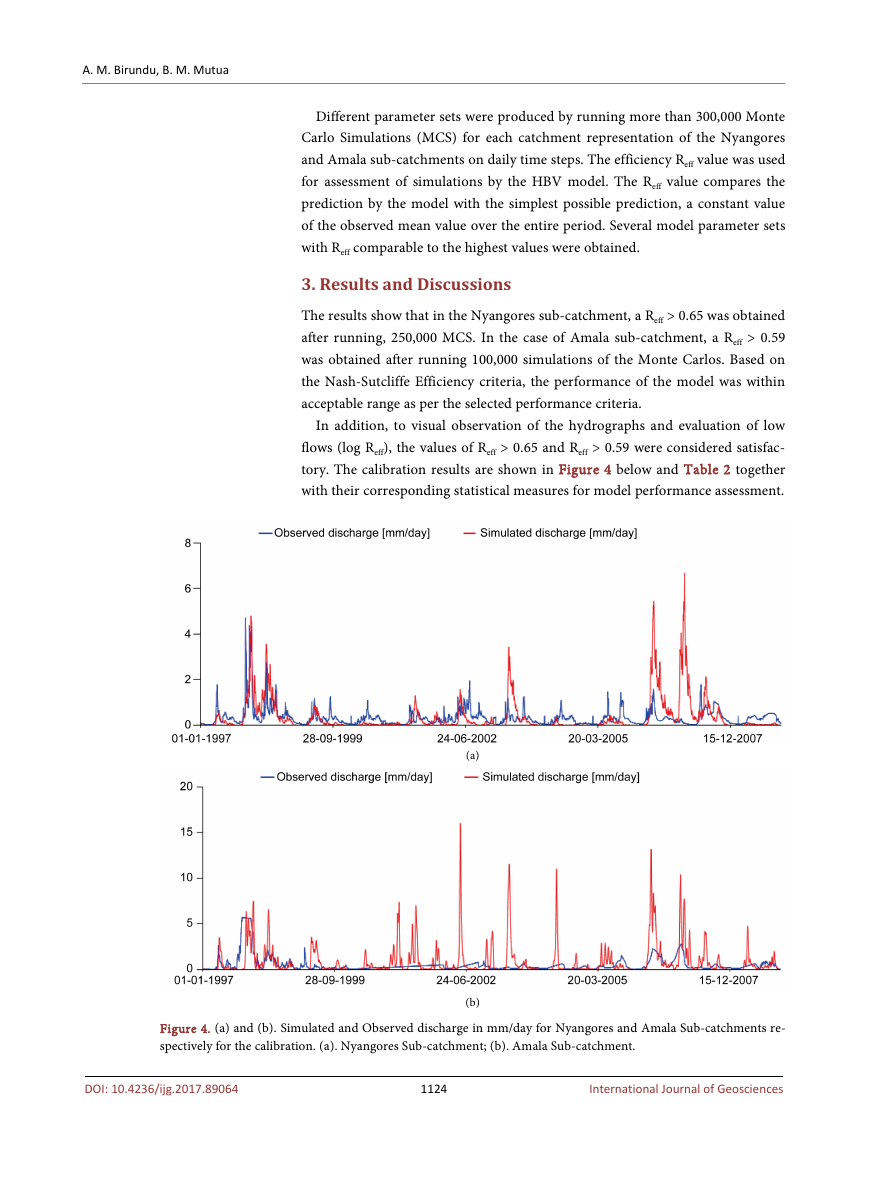
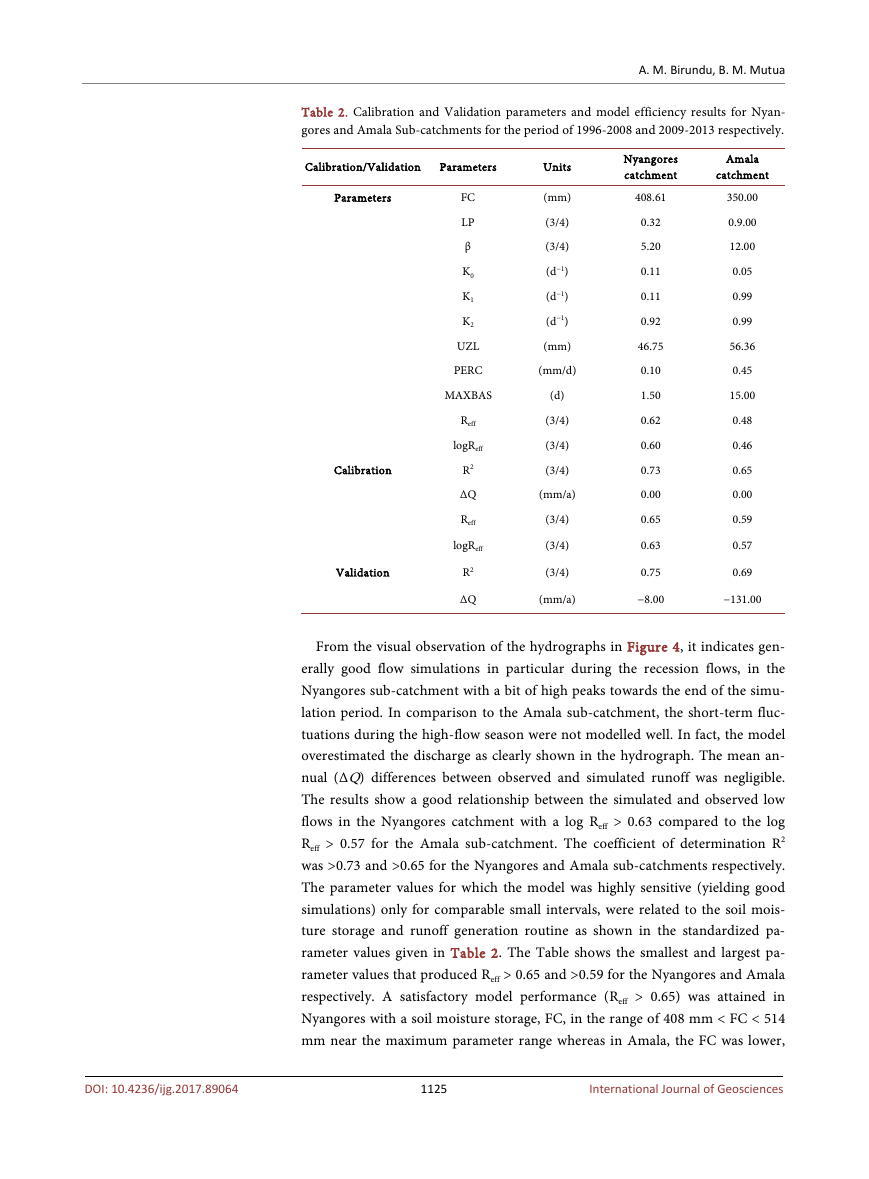
tory. The calibration results are shown in Figure 4 below and Table 2 together
with their corresponding statistical measures for model performance assessment.
(a)
(b)
Figure 4. (a) and (b). Simulated and Observed discharge in mm/day for Nyangores and Amala Sub-catchments re-
spectively for the calibration. (a). Nyangores Sub-catchment; (b). Amala Sub-catchment.
DOI: 10.4236/ijg.2017.89064
1124
International Journal of Geosciences
�
Table 2. Calibration and Validation parameters and model efficiency results for Nyan-
gores and Amala Sub-catchments for the period of 1996-2008 and 2009-2013 respectively.
A. M. Birundu, B. M. Mutua
Calibration/Validation
Parameters
Parameters
Calibration
Validation
FC
LP
β
K0
K1
K2
UZL
PERC
MAXBAS
Reff
logReff
R2
∆Q
Reff
logReff
R2
∆Q
Units
(mm)
(3/4)
(3/4)
(d−1)
(d−1)
(d−1)
(mm)
(mm/d)
(d)
(3/4)
(3/4)
(3/4)
(mm/a)
(3/4)
(3/4)
(3/4)
Nyangores
catchment
408.61
0.32
5.20
0.11
0.11
0.92
46.75
0.10
1.50
0.62
0.60
0.73
0.00
0.65
0.63
0.75
Amala
catchment
350.00
0.9.00
12.00
0.05
0.99
0.99
56.36
0.45
15.00
0.48
0.46
0.65
0.00
0.59
0.57
0.69
(mm/a)
−8.00
−131.00
From the visual observation of the hydrographs in Figure 4, it indicates gen-
erally good flow simulations in particular during the recession flows, in the
Nyangores sub-catchment with a bit of high peaks towards the end of the simu-
lation period. In comparison to the Amala sub-catchment, the short-term fluc-
tuations during the high-flow season were not modelled well. In fact, the model
overestimated the discharge as clearly shown in the hydrograph. The mean an-
nual (∆Q) differences between observed and simulated runoff was negligible.
The results show a good relationship between the simulated and observed low
flows in the Nyangores catchment with a log Reff > 0.63 compared to the log
Reff > 0.57 for the Amala sub-catchment. The coefficient of determination R2
was >0.73 and >0.65 for the Nyangores and Amala sub-catchments respectively.
The parameter values for which the model was highly sensitive (yielding good
simulations) only for comparable small intervals, were related to the soil mois-
ture storage and runoff generation routine as shown in the standardized pa-
rameter values given in Table 2. The Table shows the smallest and largest pa-
rameter values that produced Reff > 0.65 and >0.59 for the Nyangores and Amala
respectively. A satisfactory model performance (Reff > 0.65) was attained in
Nyangores with a soil moisture storage, FC, in the range of 408 mm < FC < 514
mm near the maximum parameter range whereas in Amala, the FC was lower,
1125
International Journal of Geosciences
DOI: 10.4236/ijg.2017.89064
�


 2023年江西萍乡中考道德与法治真题及答案.doc
 2012年重庆南川中考生物真题及答案.doc
 2013年江西师范大学地理学综合及文艺理论基础考研真题.doc
 2020年四川甘孜小升初语文真题及答案I卷.doc
 2020年注册岩土工程师专业基础考试真题及答案.doc
 2023-2024学年福建省厦门市九年级上学期数学月考试题及答案.doc
 2021-2022学年辽宁省沈阳市大东区九年级上学期语文期末试题及答案.doc
 2022-2023学年北京东城区初三第一学期物理期末试卷及答案.doc
 2018上半年江西教师资格初中地理学科知识与教学能力真题及答案.doc
 2012年河北国家公务员申论考试真题及答案-省级.doc
 2020-2021学年江苏省扬州市江都区邵樊片九年级上学期数学第一次质量检测试题及答案.doc
 2022下半年黑龙江教师资格证中学综合素质真题及答案.doc