Version 4.0
�
Contents
Articles
Introduction
About Paraview
Loading Data
Data Ingestion
Understanding Data
VTK Data Model
Information Panel
Statistics Inspector
Memory Inspector
Multi-block Inspector
Displaying Data
Views, Representations and Color Mapping
Filtering Data
Rationale
Filter Parameters
The Pipeline
Filter Categories
Best Practices
Custom Filters aka Macro Filters
Quantative Analysis
Drilling Down
Python Programmable Filter
Calculator
Python Calculator
Spreadsheet View
Selection
Querying for Data
Histogram
Plotting and Probing Data
1
1
9
9
13
13
23
27
28
32
35
35
70
70
70
72
76
79
82
85
85
85
92
94
99
102
111
115
116
�
Saving Data
Saving Data
Exporting Scenes
3D Widgets
Manipulating data in the 3D view
Annotation
Annotation
Animation
Animation View
Comparative Visualization
Comparative Views
Remote and Parallel Large Data Visualization
Parallel ParaView
Starting the Server(s)
Connecting to the Server
Distributing/Obtaining Server Connection Configurations
Parallel Rendering and Large Displays
About Parallel Rendering
Parallel Rendering
Tile Display Walls
CAVE Displays
Scripted Control
Interpreted ParaView
Python Scripting
Tools for Python Scripting
Batch Processing
In-Situ/CoProcessing
CoProcessing
C++ CoProcessing example
Python CoProcessing Example
118
118
121
123
123
130
130
141
141
149
149
156
156
159
164
168
172
172
172
178
180
188
188
188
210
212
217
217
229
236
�
Plugins
What are Plugins?
Included Plugins
Loading Plugins
Appendix
Command Line Arguments
Application Settings
List of Readers
List of Sources
List of Filters
List of Writers
How to build/compile/install
Building ParaView with Mesa3D
How to write parallel VTK readers
References
Article Sources and Contributors
Image Sources, Licenses and Contributors
Article Licenses
License
242
242
243
245
248
248
255
264
293
308
397
405
414
416
423
425
429
�
Introduction
About Paraview
1
What is ParaView?
ParaView is an open-source, multi-platform application for the visualization and analysis of scientific datasets,
primarily those that are defined natively in a two- or three-dimensional space including those that extend into the
temporal dimension.
The front end graphical user interface (GUI) has an open, flexible and intuitive user interface that still gives you
fine-grained and open-ended control of the data manipulation and display processing needed to explore and present
complex data as you see fit.
ParaView has extensive scripting and batch processing capabilities. The standard scripting interface uses the widely
used python programming language for scripted control. As with the GUI, the python scripted control is easy to
learn, including the ability to record actions in the GUI and save them out as succinct human readable python
programs. It is also powerful, with the ability to write scripted filters that run on the server that have access to every
bit of your data on a large parallel machine.
ParaView's data processing and rendering components are built upon a modular and scalable distributed-memory
parallel architecture in which many processors operate synchronously on different portions of the data. ParaView's
scalable architecture allows you to run ParaView directly on anything from a small netbook class machine up to the
world's largest supercomputer. However, the size of the datasets ParaView can handle in practice varies widely
depending on the size of the machine that ParaView's server components are run on. Thus people frequently do both,
taking advantage of ParaView's client/server architecture to connect to and control the supercomputer from the
netbook.
ParaView is meant to be easily extended and customized into new applications and be used by or make use of other
tools. Correspondingly there are a number of different interfaces to ParaView's data processing and visualization
engine, for example the web-based ParaViewWeb [1]. This book does not focus on these nor does it describe in great
detail the programmers' interface to the ParaView engine. The book instead focuses on understanding the standard
ParaView GUI based application.
�
About Paraview
2
User Interface
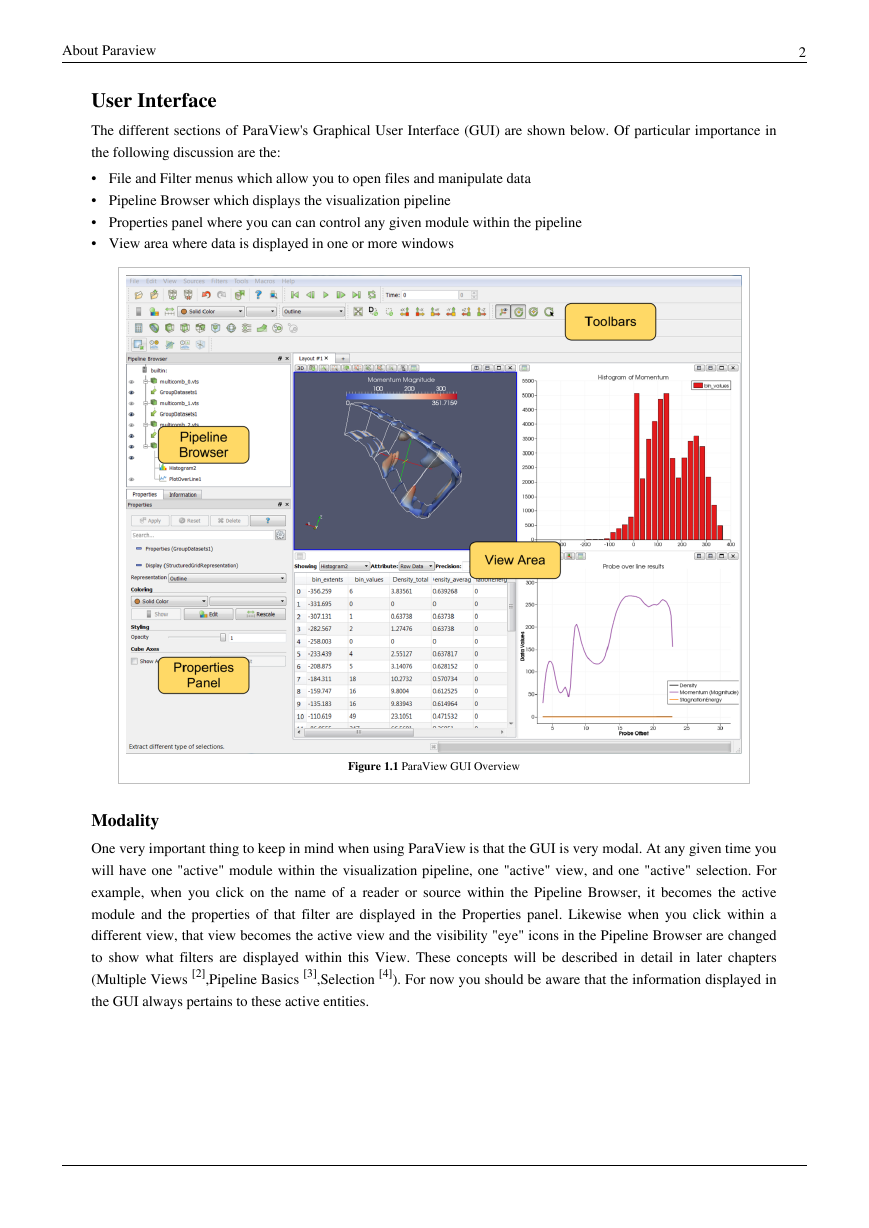
The different sections of ParaView's Graphical User Interface (GUI) are shown below. Of particular importance in
the following discussion are the:
• File and Filter menus which allow you to open files and manipulate data
• Pipeline Browser which displays the visualization pipeline
• Properties panel where you can can control any given module within the pipeline
• View area where data is displayed in one or more windows
Figure 1.1 ParaView GUI Overview
Modality
One very important thing to keep in mind when using ParaView is that the GUI is very modal. At any given time you
will have one "active" module within the visualization pipeline, one "active" view, and one "active" selection. For
example, when you click on the name of a reader or source within the Pipeline Browser, it becomes the active
module and the properties of that filter are displayed in the Properties panel. Likewise when you click within a
different view, that view becomes the active view and the visibility "eye" icons in the Pipeline Browser are changed
to show what filters are displayed within this View. These concepts will be described in detail in later chapters
(Multiple Views [2],Pipeline Basics [3],Selection [4]). For now you should be aware that the information displayed in
the GUI always pertains to these active entities.
�
About Paraview
3
Features
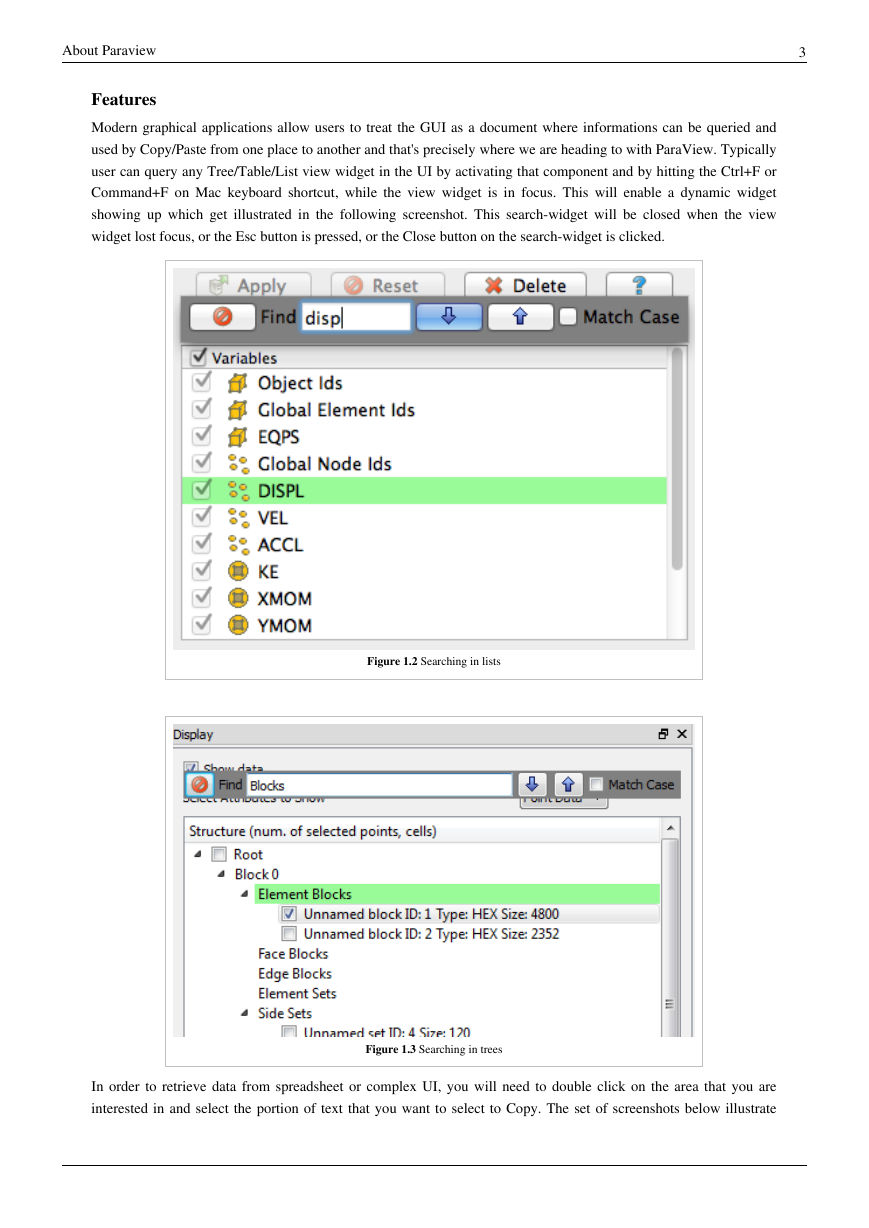
Modern graphical applications allow users to treat the GUI as a document where informations can be queried and
used by Copy/Paste from one place to another and that's precisely where we are heading to with ParaView. Typically
user can query any Tree/Table/List view widget in the UI by activating that component and by hitting the Ctrl+F or
Command+F on Mac keyboard shortcut, while the view widget is in focus. This will enable a dynamic widget
showing up which get illustrated in the following screenshot. This search-widget will be closed when the view
widget lost focus, or the Esc button is pressed, or the Close button on the search-widget is clicked.
Figure 1.2 Searching in lists
Figure 1.3 Searching in trees
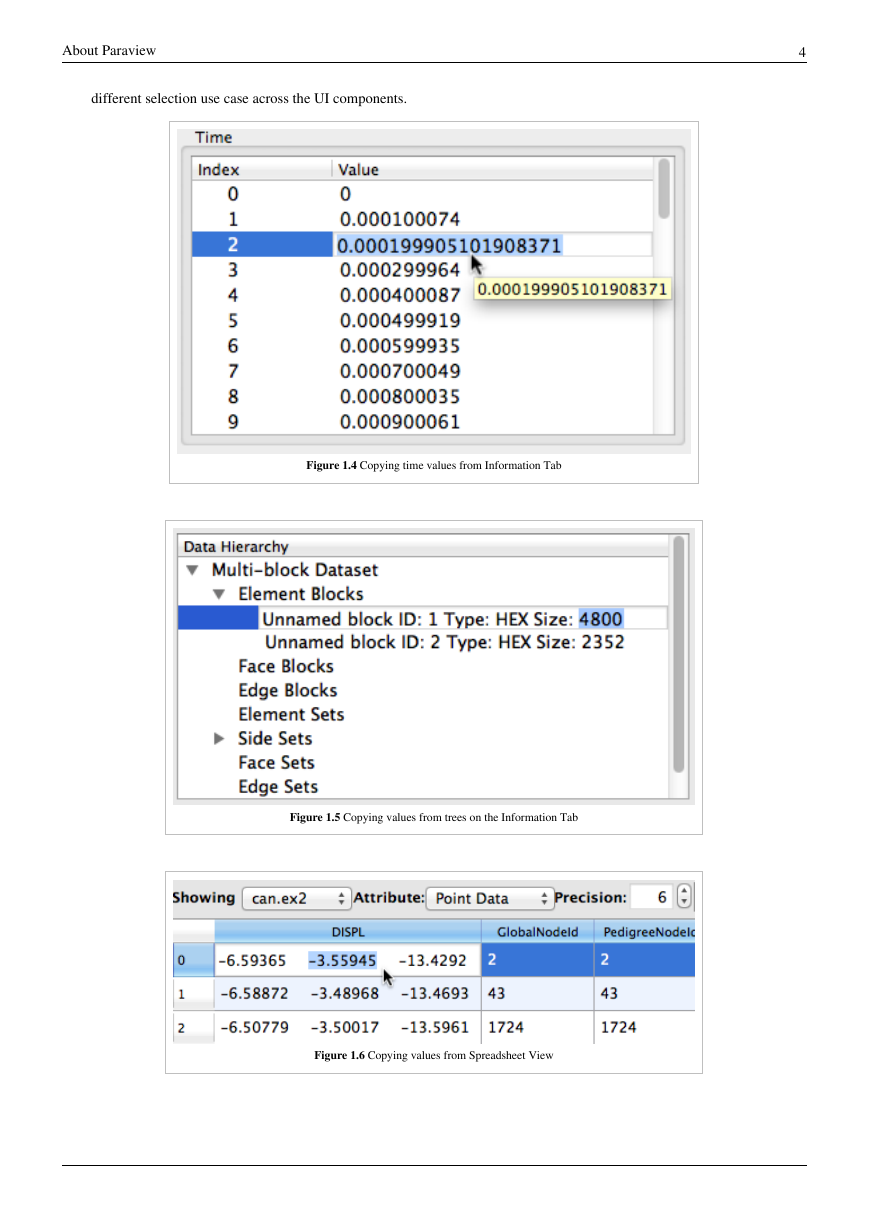
In order to retrieve data from spreadsheet or complex UI, you will need to double click on the area that you are
interested in and select the portion of text that you want to select to Copy. The set of screenshots below illustrate
�
About Paraview
different selection use case across the UI components.
4
Figure 1.4 Copying time values from Information Tab
Figure 1.5 Copying values from trees on the Information Tab
Figure 1.6 Copying values from Spreadsheet View
�



 2023年江西萍乡中考道德与法治真题及答案.doc
 2012年重庆南川中考生物真题及答案.doc
 2013年江西师范大学地理学综合及文艺理论基础考研真题.doc
 2020年四川甘孜小升初语文真题及答案I卷.doc
 2020年注册岩土工程师专业基础考试真题及答案.doc
 2023-2024学年福建省厦门市九年级上学期数学月考试题及答案.doc
 2021-2022学年辽宁省沈阳市大东区九年级上学期语文期末试题及答案.doc
 2022-2023学年北京东城区初三第一学期物理期末试卷及答案.doc
 2018上半年江西教师资格初中地理学科知识与教学能力真题及答案.doc
 2012年河北国家公务员申论考试真题及答案-省级.doc
 2020-2021学年江苏省扬州市江都区邵樊片九年级上学期数学第一次质量检测试题及答案.doc
 2022下半年黑龙江教师资格证中学综合素质真题及答案.doc