Manual
Computational Anatomy Toolbox - CAT12
Preprocessing Data
QUICK START GUIDE ......................................................................................................................... 3
INTRODUCTION AND OVERVIEW ...................................................................................................... 5
GETTING STARTED ............................................................................................................................ 5
5
Download and Installation
6
Starting the Toolbox
6
Basic VBM analysis (overview)
BASIC VBM ANALYSIS (DETAILED DESCRIPTION) ............................................................................... 9
9
9
First Module: Segment Data
11
Second Module: Display one slice for all images
11
Third Module: Check sample homogeneity
13
Fourth Module: Smooth
13
Fifth Module: Estimate Total Intracranial Volume (TIV)
14
15
Two-sample T-Test
16
Full Factorial Model (for a 2x2 Anova)
17
Multiple Regression (Linear)
18
Multiple Regression (Polynomial)
19
Full Factorial Model (Interaction)
20
Full Factorial Model (Polynomial Interaction)
Building the Statistical Model
1
�
CAT12 for longitudinal data
Adapting the workflows
Altered Workflows for VBM-analyses
21
Estimating the Statistical Model
21
Checking for Design Orthogonality
24
Defining Contrasts
SPECIAL CASES ................................................................................................................................ 28
28
30
Change Settings for Preprocessing
30
Preprocessing of Longitudinal Data
31
Statistical Analysis of Longitudinal Data in One Group
32
Statistical Analysis of Longitudinal Data in Two Groups
36
37
37
Customized Tissue Probability Maps
38
Customized DARTEL-template
OTHER VARIANTS OF COMPUTATIONAL MORPHOMETRY .............................................................. 40
40
41
44
ADDITIONAL INFORMATION ON NATIVE, NORMALIZED AND MODULATED VOLUMES .................... 46
NAMING CONVENTION OF OUTPUT FILES ....................................................................................... 48
CALLING CAT FROM THE UNIX COMMAND LINE ............................................................................. 50
TECHNICAL INFORMATION ............................................................................................................. 50
Deformation-based morphometry (DBM)
Surface-based morphometry (SBM)
Region of interest (ROI) analysis
2
�
o Use "Full factorial" for cross-sectional data
o Use "Flexible factorial" for longitudinal data
o Use TIV as covariate (confound) to correct for different brain sizes and select centering
with overall mean
Quick start guide
Errors during preprocessing
Please use the Report Error function if any errors during preprocessing occurred. You have to first
select the "err" directory that can be found in the folder of the failed data set and finally the indicated
zip-file in the mail should be attached manually.
Segment data using defaults (for longitudinal data use Segment longitudinal data).
Estimate total intracranial volume (TIV) in order to correct for different head size and volume.
VBM data
•
•
• Check data quality using Check sample homogeneity for VBM data.
•
•
Smooth data (suggested starting value 8mm).
Specify 2nd-level model:
o Select threshold masking with an absolute value of 0.1. This threshold can be increased
in the final analysis to 0.2 or even 0.25.
Estimate model.
•
• Check design orthogonality using the Review function in the SPM GUI. If you find a considerable
correlation between TIV and any other parameter of interest it is recommended to rather use
global scaling with TIV. Check the section “Building the statistical model” for more details.
• Optionally Transform SPM-maps to (log-scaled) p-maps or correlation maps and apply
thresholds.
• Optionally try Threshold-Free Cluster Enhancement (TFCE) using the SPM.mat file of the already
estimated statistical design.
• Optionally Overlay selected slices. If you use log-p scaled maps from Transform & Threshold
SPM-maps without any threshold use the following values as lower range for the colormap for
thresholding: 1.3 (P<0.05); 2 (P<0.01); 3 (P<0.001).
• Optionally estimate results for ROI analysis using Analyze ROIs. Here, the SPM.mat file of an
already estimated statistical design will be used. Please check the online help “Atlas creation and
ROI based analysis” for more information.
3
�
25mm for folding measures, use the default merging of hemispheres).
• Check data quality using Check Sample Homogeneity for surface data.
•
Specify 2nd-level model:
o Use "Full factorial" for cross-sectional data
o Use "Flexible factorial" for longitudinal data
o
Additional surface data
•
Segment data and additionally select "Surface and thickness estimation" in "Writing options" (for
longitudinal data use Segment longitudinal data).
• Optionally extract additional surface parameters (e.g. suclus depth, gyrification index, cortical
complexity).
• Resample & Smooth Surfaces (suggested starting value 15mm for cortical thickness and 20-
It is not necessary to use TIV as covariate (confound) because cortical thickness or
other surface values are usually not dependent on TIV.
It is not necessary to use any threshold masking.
o
Estimate Surface Model for (merged) hemispheres.
•
• Optionally Transform SPM-maps to (log-scaled) p-maps or correlation maps and apply
thresholds.
Optionally try Threshold-Free Cluster Enhancement (TFCE) using the SPM.mat file of the already
estimated statistical design.
• Optionally Display Surface Results for both hemispheres. Select results (preferably saved as log-p
maps using “Transform and threshold SPM-surfaces”) in order to show render views of your
results.
• Optionally Extract ROI-based Surface Values such as thickness, gyrification or fractal dimension
to provide ROI analysis.
• Optionally estimate results for ROI analysis using Analyze ROIs. Here, the SPM.mat file of an
already estimated statistical design will be used. Please check the online help “Atlas creation and
ROI based analysis” for more information.
4
�
Introduction and Overview
This manual is intended to help any user to perform a computational anatomy analysis using the
CAT12 Toolbox. Although it will mainly focus on voxel-based morphometry (VBM) other variants of
computational analysis such as deformation-based morphometry (DBM), surface-based morphometry
(SBM), and region of interest (ROI) morphometric analysis will be also introduced and can be applied
with a few changes.
Basically the manual may be divided into four main sections:
• Naturally, a quick guide of how to get started is given at the beginning. This section provides
information how to download and install the software and start the Toolbox. Furthermore, a short
overview on the steps of a VBM analysis is given.
• A detailed description of a basic VBM analysis is subsequently given, which will guide the user step
by step through the whole process – from preprocessing to the selection of contrasts. This
description should provide all necessary information to analyze most studies successfully.
• There are a few special cases of VBM analyses, for which the basic analysis workflow has to be
adapted. These cases are longitudinal studies and studies in children or special patient populations.
Relevant changes to a basic VBM analysis are described here and a description of how to apply
these changes is provided. Importantly, only the changes are described – steps like for example
quality control or smoothing are the same as in the basic analysis and not described a second time.
• The manual closes with information on native, normalized and modulated volumes, which
determines how the results may be interpreted. Furthermore an overview of the naming
conventions used as well as technical information is given.
Getting Started
DOWNLOAD AND INSTALLATION
•
search
path
before
The CAT12 Toolbox runs within SPM12. That is, SPM12 needs to be installed and added to your
Matlab
(see
http://www.fil.ion.ucl.ac.uk/spm/ and http://en.wikibooks.org/wiki/SPM).
installed
Toolbox
the
CAT12
can
be
• Download (http://dbm.neuro.uni-jena.de/cat12/) and unzip the CAT12 Toolbox. You will get a
folder named “cat12”, which contains various matlab files and compiled scripts. Copy the folder
“cat12” into the SPM12 “toolbox” folder.
5
�
STARTING THE TOOLBOX
•
•
•
Start Matlab
Start SPM12 (i.e., type “spm fmri”)
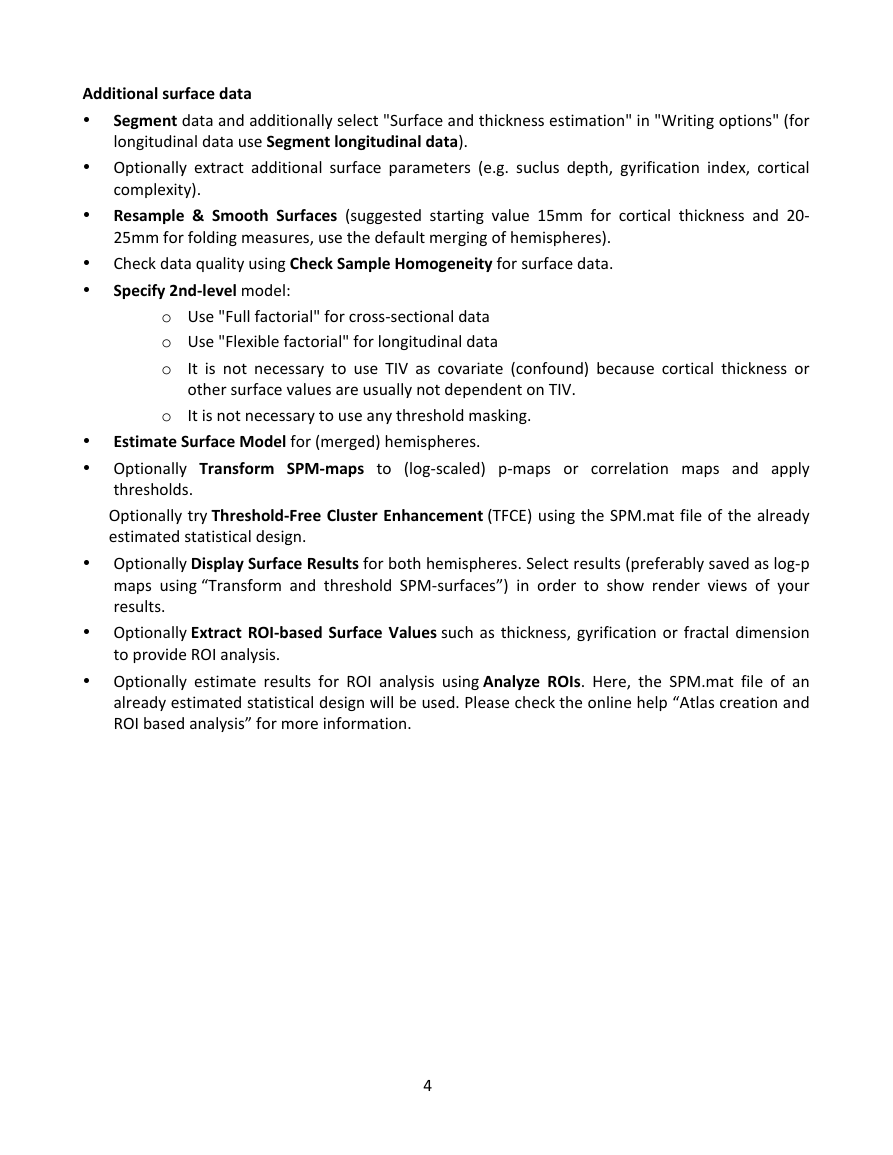
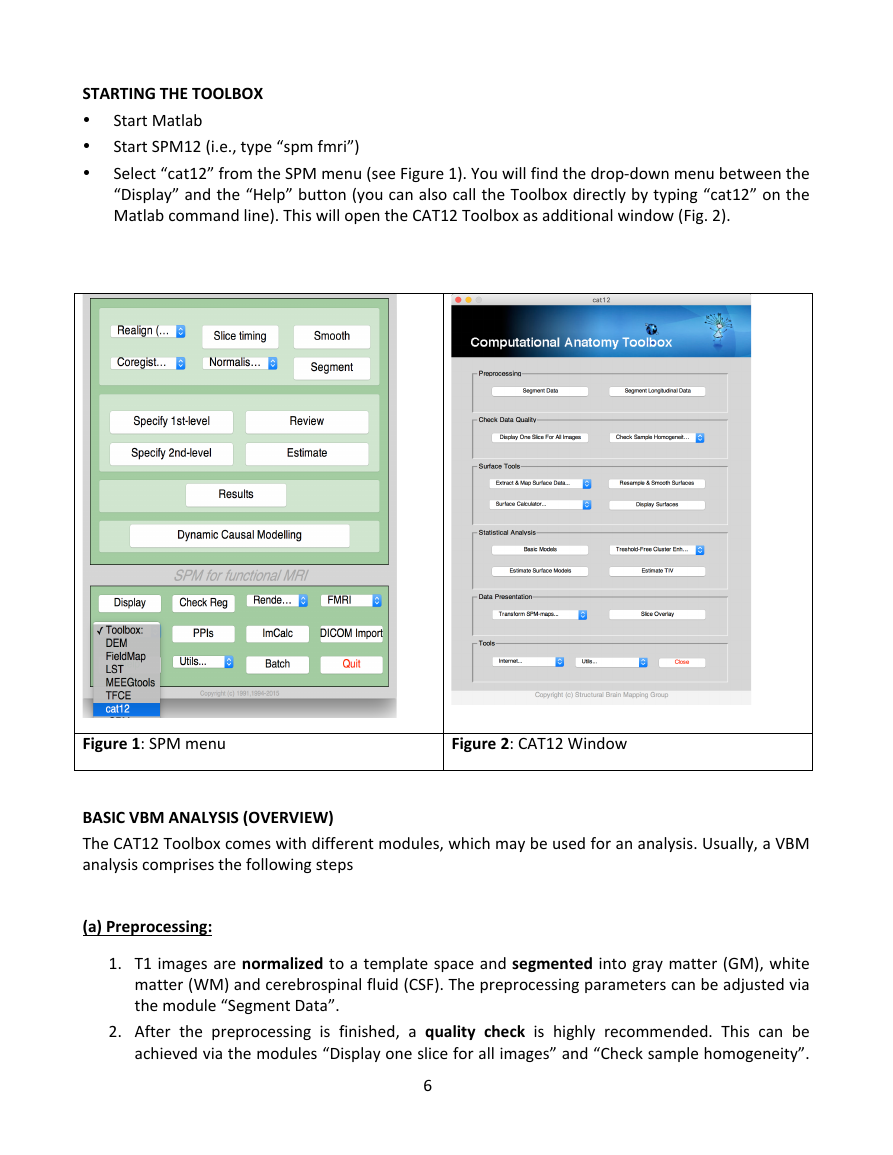
Select “cat12” from the SPM menu (see Figure 1). You will find the drop-down menu between the
“Display” and the “Help” button (you can also call the Toolbox directly by typing “cat12” on the
Matlab command line). This will open the CAT12 Toolbox as additional window (Fig. 2).
Figure 1: SPM menu
Figure 2: CAT12 Window
BASIC VBM ANALYSIS (OVERVIEW)
The CAT12 Toolbox comes with different modules, which may be used for an analysis. Usually, a VBM
analysis comprises the following steps
(a) Preprocessing:
1. T1 images are normalized to a template space and segmented into gray matter (GM), white
matter (WM) and cerebrospinal fluid (CSF). The preprocessing parameters can be adjusted via
the module “Segment Data”.
2. After the preprocessing is finished, a quality check is highly recommended. This can be
achieved via the modules “Display one slice for all images” and “Check sample homogeneity”.
6
�
Both options are located in the CAT12 window under “Check Data Quality”. Furthermore,
quality parameters are estimated and saved
in xml-files for each data set during
preprocessing. These quality parameters are also printed on the report PDF-page and can be
additionally used in the module “Check sample homogeneity”.
3. Before entering the GM images into a statistical model, image data need to be smoothed. Of
note, this step is not implemented into the CAT12 Toolbox but achieved via the standard SPM
module “Smooth”.
(b) Statistical analysis:
4. The smoothed GM images are entered into a statistical analysis. This requires building a
statistical model (e.g., T-Tests, ANOVAs, multiple regressions). This is done by the standard
SPM modules “Specify 2nd Level” or “Basic Models” in the CAT12 window covering the same
function.
5. The statistical model is estimated. This is done by the standard SPM module “Estimate”
(except for surface-based data where the function “Estimate Surface Models” should be used
instead.
6. If you have used total intracranial volume (TIV) as confound in your model to correct for
different brain sizes it is necessary to check whether TIV reveals a considerable correlation
with any other parameter of interest and rather use global scaling as alternative approach.
7. After estimating the statistical model, contrasts will be defined to get the results of the
analysis. This is done by the standard SPM module “Results”.
The sequence of “preprocessing à quality check à smoothing à statistical analysis” remains the
same for every VBM analysis, even when different steps are adapted (see “special cases”).
A few words about the Batch Editor…
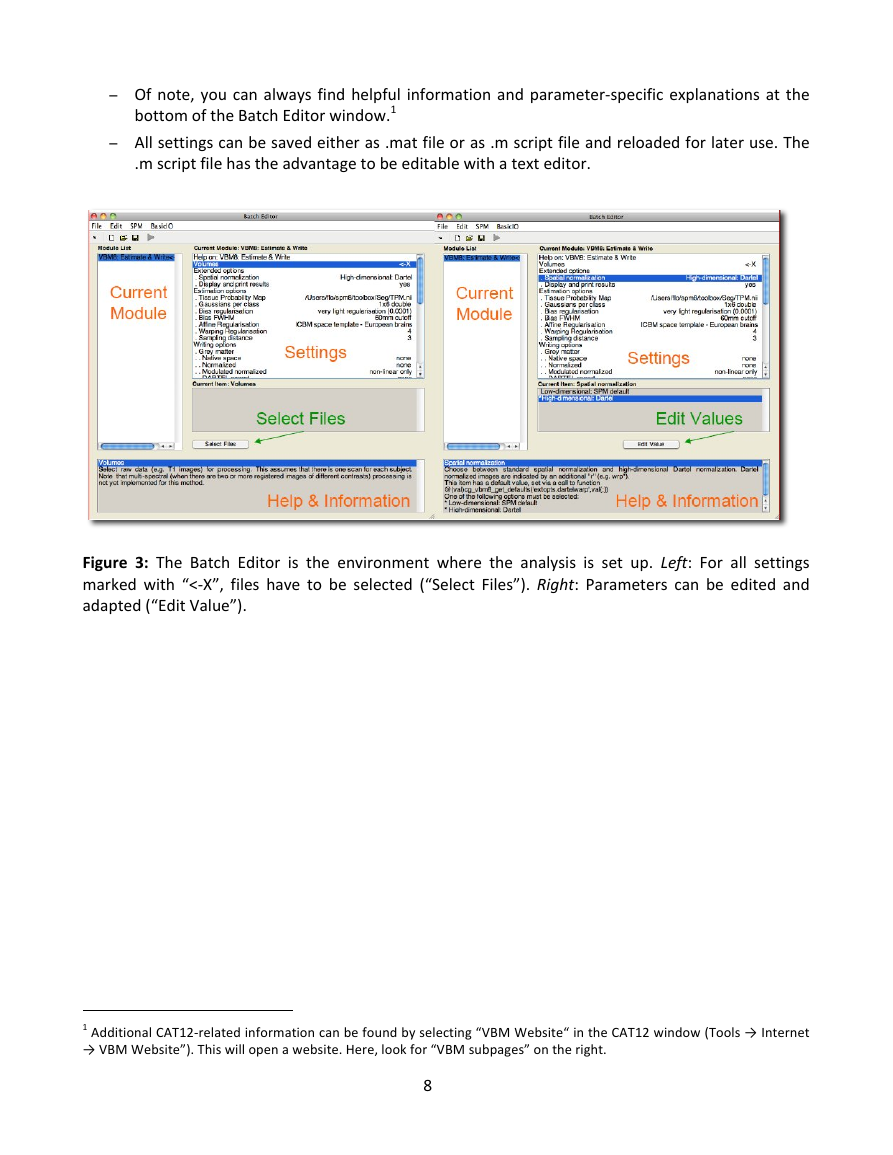
− As soon as you select a module from the CAT12 Toolbox menu, a new window (the Batch
Editor) will open. The Batch Editor is the environment where you will set up your analysis (see
Figure 3). For example, an “<-X” indicates where you need to select files (e.g., your image files,
the template, etc.). Other parameters have either default settings (which can be modified) or
require input (e.g., choosing between different options, providing text or numeric values, etc.).
− Once all missing parameters are set, a green arrow will appear on the top of the window (the
current snapshots in Figure 3 show the arrow still in gray). Click this arrow to run the module
or select “File à Run Batch”. It is very useful to save the settings before you run the batch
(click on the disk symbol or select “File à Save Batch”).
7
�
− Of note, you can always find helpful information and parameter-specific explanations at the
bottom of the Batch Editor window.1
− All settings can be saved either as .mat file or as .m script file and reloaded for later use. The
.m script file has the advantage to be editable with a text editor.
Figure 3: The Batch Editor is the environment where the analysis is set up. Left: For all settings
marked with “<-X”, files have to be selected (“Select Files”). Right: Parameters can be edited and
adapted (“Edit Value”).
1 Additional CAT12-related information can be found by selecting “VBM Website“ in the CAT12 window (Tools → Internet
→ VBM Website”). This will open a website. Here, look for “VBM subpages” on the right.
8
�





 2023年江西萍乡中考道德与法治真题及答案.doc
 2012年重庆南川中考生物真题及答案.doc
 2013年江西师范大学地理学综合及文艺理论基础考研真题.doc
 2020年四川甘孜小升初语文真题及答案I卷.doc
 2020年注册岩土工程师专业基础考试真题及答案.doc
 2023-2024学年福建省厦门市九年级上学期数学月考试题及答案.doc
 2021-2022学年辽宁省沈阳市大东区九年级上学期语文期末试题及答案.doc
 2022-2023学年北京东城区初三第一学期物理期末试卷及答案.doc
 2018上半年江西教师资格初中地理学科知识与教学能力真题及答案.doc
 2012年河北国家公务员申论考试真题及答案-省级.doc
 2020-2021学年江苏省扬州市江都区邵樊片九年级上学期数学第一次质量检测试题及答案.doc
 2022下半年黑龙江教师资格证中学综合素质真题及答案.doc