Chapter 1
1. In case of an accident, there is a high chance of getting lost. The transportation cost is very high each
time. However, if the infrastructure is set once, it will be very easy to use it repeatedly. Time for
wireless transmission is negligible as signals travel at the speed of light.
2. Advantages of bursty data communication
(a) Pulses are made very narrow, so multipaths are resolvable
(b) The transmission device needs to be switched on for less time.
Disadvantages
(a) Bandwidth required is very high
(b) Peak transmit power can be very high.
3. Pb = 10−12
2γ = 10−12
γ = 1012
1
2 = 5 × 10¹¹ (very high)
4. Geo: 35,786 Km above earth ⇒ RT T = 2×35786×103
= 0.2386s
Meo: 8,000- 20,000 Km above earth ⇒ RT T = 2×8000×103
Leo: 500- 2,000 Km above earth ⇒ RT T = 2×500×103
Only Leo satellites as delay = 3.3ms < 30ms
c
c
c
= 0.0033s
= 0.0533s
5.
6. optimum no. of data user = d
optimum no. of voice user = v
Three different cases:
Case 1: d=0, v=6
⇒ revenue = 60.80.2 = 0.96
Case 2: d=1, v=3
revenue = [prob. of having one data user]×(revenue of having one data user)
+ [prob. of having two data user]×(revenue of having two data user)
+ [prob. of having one voice user]×(revenue of having one voice user)
+ [prob. of having two voice user]×(revenue of having two voice user)
+ [prob. of having three or more voice user]×(revenue in this case)
⇒ 0.52
× $1 + 0.52 × $1 +
0.8 × 0.25 × $0.2 +
0.82 × 0.24 × $0.4+
0.8 × 0.25 × $0.2 −
0.82 × 0.24 × $0.4
× $0.6
2
1
1 −
6
1
6
2
6
1
6
2
⇒ $1.35
Case 3: d=2, v=0
revenue =2 × 0.5 = $1
So the best case is case 2, which is to allocate 60kHz to data and 60kHz to voice.
�
7.
8. 1. Hand-off becomes a big problem.
2. Inter-cell interference is very high and should be mitigated to get reasonable SINR.
3. Infrastructure cost is another problem.
9. Smaller the reuse distance, larger the number of users who can use the same system resource and so
10.
capacity (data rate per unit bandwidth) increases.
(a) 100 cells, 100 users/cell ⇒ 10,000 users
(b) 100 users/cell ⇒ 2500 cells required
100km2
Area/cell = 2500cells ⇒ Area
cell = .04km2
(c) From Rappaport or iteration of formula, we get that 100 channels
cell ⇒ 89 channels
cell @Pb = .02
Each subscriber generates 1
Thus, each cell can support 30 × 89 = 2670 subscribers
Macrocell: 2670 × 100 ⇒ 267, 000 subscribers
Microcell: 6,675,000 subscribers
30 of an Erlang of traffic.
(d) Macrocell: $50 M
Microcell: $1.25 B
(e) Macrocell: $13.35 M/month ⇒ 3.75 months approx 4 months to recoop
Microcell: $333.75 M/month ⇒ 3.75 months approx 4 months to recoop
11. One CDPD line : 19.2Kbps
average Wimax ∼ 40M bps
∴ number of CDPD lines ∼ 2 × 10³
�
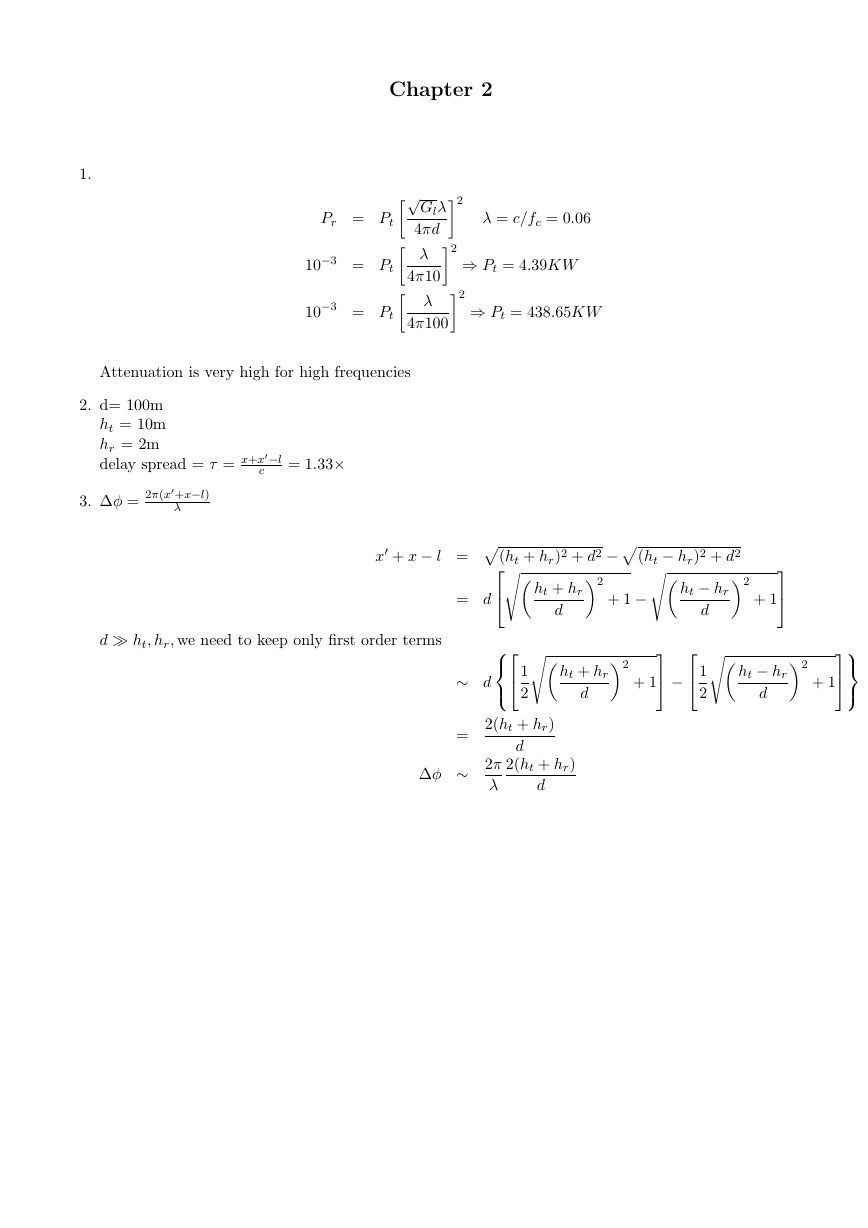
Chapter 2
1.
Pr = Pt
10−3 = Pt
10−3 = Pt
√
Glλ
4πd
λ
4π10
λ
4π100
λ = c/fc = 0.06
2
2 ⇒ Pt = 4.39KW
2 ⇒ Pt = 438.65KW
Attenuation is very high for high frequencies
2. d= 100m
ht = 10m
hr = 2m
delay spread = τ = x+x−l
c = 1.33×
3. ∆φ = 2π(x+x−l)
λ
x + x − l =
d ht, hr, we need to keep only first order terms
(ht + hr)2 + d2 −
2
= d
ht + hr
d
1
2
2(ht + hr)
∼ d
=
ht + hr
d
+ 1
+ 1
+ 1 −
2
(ht − hr)2 + d2
ht − hr
2
−
d
1
2
2
+ 1
ht − hr
d
∆φ ∼ 2π
λ
d
2(ht + hr)
d
�
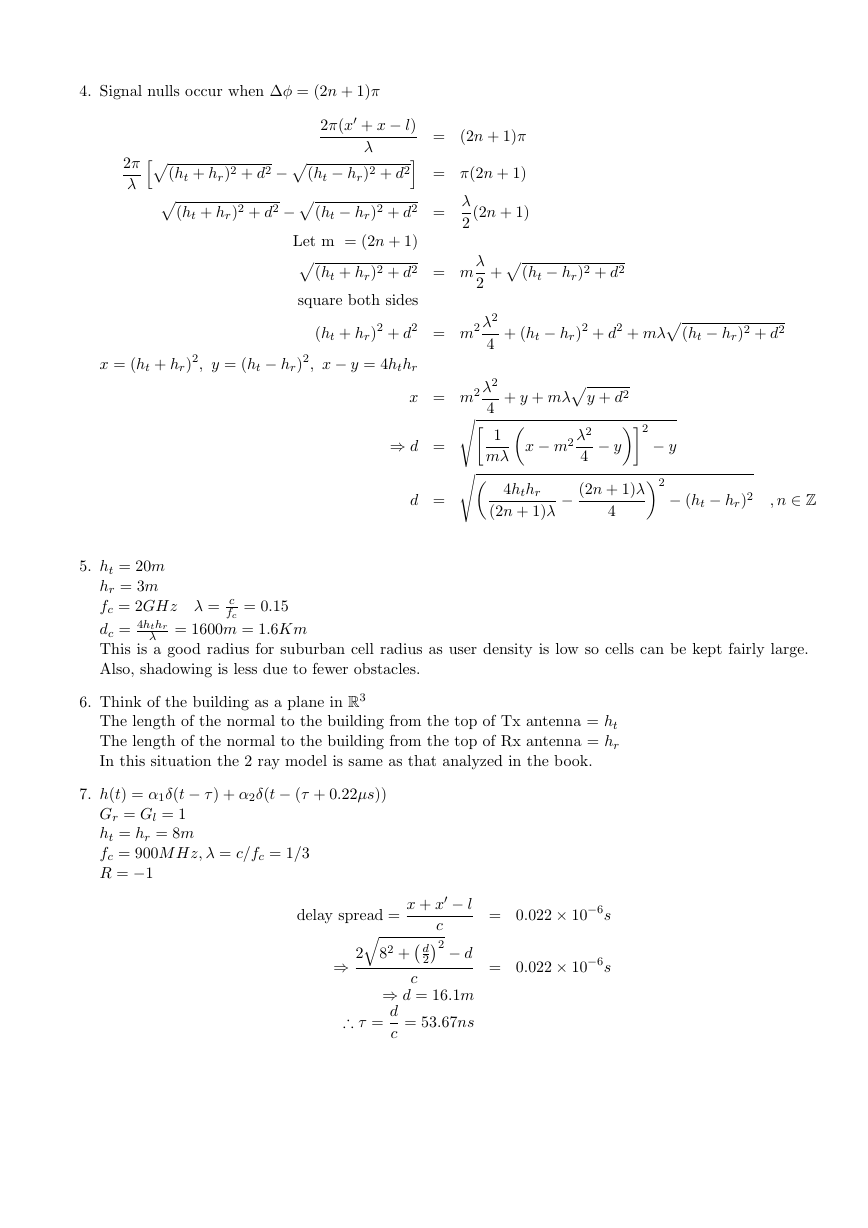
4. Signal nulls occur when ∆φ = (2n + 1)π
2π
λ
(ht + hr)2 + d2 −
(ht + hr)2 + d2 −
= (2n + 1)π
= π(2n + 1)
2π(x + x − l)
λ
(ht − hr)2 + d2
(ht − hr)2 + d2 = λ
2
Let m = (2n + 1)
(2n + 1)
λ
2
+
(ht + hr)2 + d2 = m
square both sides
(ht + hr)2 + d2 = m2 λ2
4
x = (ht + hr)2, y = (ht − hr)2, x − y = 4hthr
(ht − hr)2 + d2
+ (ht − hr)2 + d2 + mλ
(ht − hr)2 + d2
x = m2 λ2
4
1
mλ
⇒ d =
d =
+ y + mλ
y + d2
x − m2 λ2
4
− y
4hthr
(2n + 1)λ
− (2n + 1)λ
4
2 − y
2 − (ht − hr)2
, n ∈ Z
5. ht = 20m
hr = 3m
fc = 2GHz λ = c
fc
dc = 4hthr
This is a good radius for suburban cell radius as user density is low so cells can be kept fairly large.
Also, shadowing is less due to fewer obstacles.
λ = 1600m = 1.6Km
= 0.15
6. Think of the building as a plane in R3
The length of the normal to the building from the top of Tx antenna = ht
The length of the normal to the building from the top of Rx antenna = hr
In this situation the 2 ray model is same as that analyzed in the book.
7. h(t) = α1δ(t − τ) + α2δ(t − (τ + 0.22µs))
Gr = Gl = 1
ht = hr = 8m
fc = 900M Hz, λ = c/fc = 1/3
R = −1
delay spread = x + x − l
2 − d
⇒ 2
d
82 +
c
2
c
⇒ d = 16.1m
= 53.67ns
∴ τ = d
c
= 0.022 × 10⁻⁶s
= 0.022 × 10⁻⁶s
�
λ
4π
√
Gl
l
λ
4π
√
RGr
x + x
2
2
= 2.71 × 10−6
= 1.37 × 10⁻⁶
α1 =
α2 =
8. A program to plot the figures is shown below. The power versus distance curves and a plot of the
phase difference between the two paths is shown on the following page. From the plots it can be seen
that as Gr (gain of reflected path) is decreased, the asymptotic behavior of Pr tends toward d−2 from
d−4, which makes sense since the effect of reflected path is reduced and it is more like having only a
LOS path. Also the variation of power before and around dc is reduced because the strength of the
reflected path decreases as Gr decreases. Also note that the the received power actually increases with
distance up to some point. This is because for very small distances (i.e. d = 1), the reflected path is
approximately two times the LOS path, making the phase difference very small. Since R = -1, this
causes the two paths to nearly cancel each other out. When the phase difference becomes 180 degrees,
the first local maxima is achieved. Additionally, the lengths of both paths are initially dominated by
the difference between the antenna heights (which is 35 meters). Thus, the powers of both paths are
roughly constant for small values of d, and the dominant factor is the phase difference between the
paths.
clear all;
close all;
ht=50;
hr=15;
f=900e6;
c=3e8;
lambda=c/f;
GR=[1,.316,.1,.01];
Gl=1;
R=-1;
counter=1;
figure(1);
d=[1:1:100000];
l=(d.^2+(ht-hr)^2).^.5;
r=(d.^2+(ht+hr)^2).^.5;
phd=2*pi/lambda*(r-1);
dc=4*ht*hr/lambda;
dnew=[dc:1:100000];
for counter = 1:1:4,
Gr=GR(counter);
Vec=Gl./l+R*Gr./r.*exp(phd*sqrt(-1));
Pr=(lambda/4/pi)^2*(abs(Vec)).^2;
subplot(2,2,counter);
plot(10*log10(d),10*log10(Pr)-10*log10(Pr(1)));
hold on;
plot(10*log10(dnew),-20*log10(dnew));
plot(10*log10(dnew),-40*log10(dnew));
end
hold off
�
9. As indicated in the text, the power fall off with distance for the 10-ray model is d−2 for relatively large
Figure 1: Problem 8
(500/6)2 + 102 = 83.93m
distances
10. The delay spread is dictated by the ray reaching last d =
Total distance = 6d = 503.59m
τ0 = 503.59/c = 1.68µs
L.O.S ray d = 500m
τ0 = 500/c = 1.67µs
∴ delay spread = 0.01µs
11. fc = 900M Hz
λ = 1/3m
G = 1 radar cross section 20dBm2 = 10 log1 0σ ⇒ σ = 100
d=1 , s = s =
Path loss due to scattering
(0.5d)2 + (0.5d)2 = d
√
0.5 =
√
0.5
√
λ
Gσ
(4π)3/2ss
Path loss due to reflection (using 2 ray model)
Pr
Pt
=
2
√
R
G
s + s
Pr
Pt
=
2
2
λ
4π
= 0.0224 = −16.498dB
= 3.52 × 10−4 = −34.54dB
Pscattering = −56.5dB Pref lection = −54.54dB
d = 10
Pscattering = −96.5dB Pref lection = −74.54dB
d = 100
d = 1000 Pscattering = −136.5dB Pref lection = −94.54dB
Notice that scattered rays over long distances result in tremendous path loss
γ → simplified
2
2 → free space
d0
d
Pr = PtK
√
Pr = Pt
Gl
4π
λ
d
12.
0204060−150−100−5005010 * log10(Pr)10 * log10(d)Gr = 10204060−150−100−5005010 * log10(Pr)10 * log10(d)Gr = .3160204060−150−100−5005010 * log10(Pr)10 * log10(d)Gr = .10204060−150−100−5005010 * log10(Pr)10 * log10(d)Gr = .0102040600100200300400Phase (deg)10 * log10(d)�
√
2
∴ when K =
The two models are equal.
Gl
4π
and d0 = λ
13. Pnoise = −160dBm
fc = 1GHz, d0 = 1m, K = (λ/4πd0)2 = 5.7 × 10⁻⁴, λ = 0.3, γ = 4
We want SN Rrecd = 20dB = 100
∵ Noise power is 10−19
d0
d
γ
4
P = PtK
10−17 = 10K
0.3
d
d ≤ 260.7m
14. d = distance between cells with reused freq
p = transmit power of all the mobiles
uplink
S
I
≥ 20dB
(a) Min. S/I will result when main user is at A and Interferers are at B
√
2km dB = distance between B and base station
dA = distance between A and base station #1 =
#1 =
√
2km
S
I
2
2 = d2
B
2d2
A
=
P
2P
Gλ
4πdA
Gλ
4πdB
min
⇒ dmin − 1 = 20km ⇒ dmin = 21km since integer number of cells should be accommodated in
distance d ⇒ dmin = 22km
(dmin − 1)2
4
=
= 100
γ
S
I
=
min
=
1
2
γ
γ =
3
P k
d0
dA
2P k
dmin − 1√
2
d0
dB
= 100
(b)
(c)
γ ⇒
dmin − 1√
2
γ
γ
d0
dA
k
A
=
= k
Pγ
Pu
γ
d0
d
=
1
2
1
2
dB
dA
S
I
⇒ dmin = 9.27 ⇒ with the same argument ⇒ dmin = 10km
0.04
⇒ dmin = 2.41km ⇒ with the same argument dmin = 4km
d0
dB
2k
min
B
(dmin − 1)4
=
= 100
15. fc = 900M Hz, ht = 20m, hr = 5m, d = 100m
Large urban city P Llargecity = 353.52dB
small urban city P Lsmallcity = 325.99dB
P Lsuburb = 207.8769dB
suburb
rural area
P Lruralarea/countryside = 70.9278dB
As seen , path loss is higher in the presence of multiple reflectors, diffractors and scatterers
�
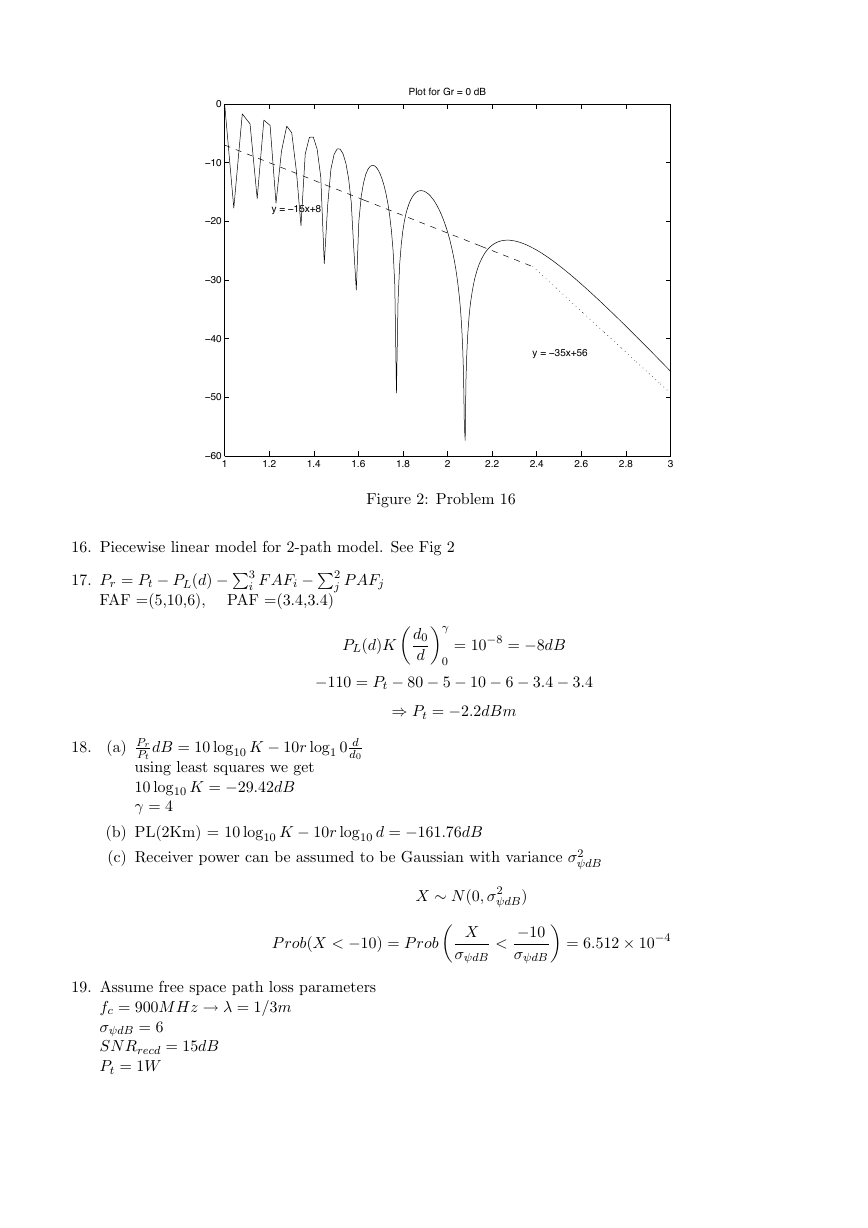
Figure 2: Problem 16
16. Piecewise linear model for 2-path model. See Fig 2
17. Pr = Pt − PL(d) −3
i F AFi −2
FAF =(5,10,6), PAF =(3.4,3.4)
j P AFj
γ
= 10−8 = −8dB
PL(d)K
d0
d
0
−110 = Pt − 80 − 5 − 10 − 6 − 3.4 − 3.4
⇒ Pt = −2.2dBm
18.
dB = 10 log10 K − 10r log1 0 d
(a) Pr
Pt
using least squares we get
10 log10 K = −29.42dB
γ = 4
d0
(b) PL(2Km) = 10 log10 K − 10r log10 d = −161.76dB
(c) Receiver power can be assumed to be Gaussian with variance σ2
X ∼ N(0, σ2
ψdB)
ψdB
P rob(X < −10) = P rob
X
σψdB
−10
σψdB
<
= 6.512 × 10⁻⁴
19. Assume free space path loss parameters
fc = 900M Hz → λ = 1/3m
σψdB = 6
SN Rrecd = 15dB
Pt = 1W
11.21.41.61.822.22.42.62.83−60−50−40−30−20−100Plot for Gr = 0 dBy = −15x+8 y = −35x+56 �


 2023年江西萍乡中考道德与法治真题及答案.doc
 2012年重庆南川中考生物真题及答案.doc
 2013年江西师范大学地理学综合及文艺理论基础考研真题.doc
 2020年四川甘孜小升初语文真题及答案I卷.doc
 2020年注册岩土工程师专业基础考试真题及答案.doc
 2023-2024学年福建省厦门市九年级上学期数学月考试题及答案.doc
 2021-2022学年辽宁省沈阳市大东区九年级上学期语文期末试题及答案.doc
 2022-2023学年北京东城区初三第一学期物理期末试卷及答案.doc
 2018上半年江西教师资格初中地理学科知识与教学能力真题及答案.doc
 2012年河北国家公务员申论考试真题及答案-省级.doc
 2020-2021学年江苏省扬州市江都区邵樊片九年级上学期数学第一次质量检测试题及答案.doc
 2022下半年黑龙江教师资格证中学综合素质真题及答案.doc