y = abs(x);
y = acos(x);
A a
abs 绝对值、模
acos 反余弦
acosh 反双曲余弦
acoth 反双曲余切
acsch 反双曲余割
asech 反双曲正割
asinh 反双曲正弦
atan2 四象限反正切
align 启动图形对象几何位置排列工具
x 可以取一个数、数组、向量
-1≤x≤1
acot 反余切
acsc 反余割
asec 反正割
asin 反正弦
atan 反正切
atanh 反双曲正切
syntax(语法)
align(HandleList,'HorizontalAlignment','VerticalAlignment')
Positions = align(HandleList, 'HorizontalAlignment', 'VerticalAlignment')
Positions = align(CurPositions, 'HorizontalAlignment', 'VerticalAlignment')
Horizontal
Alignment Definition
None
Left
Center
Right
Distribute
Fixed
Vertical
Alignment
None
Top
Middle
Bottom
Distribute
Fixed
No horizontal alignment
Shifts the objects' left edges to that of the first object selected
Shifts objects to center their positions to the average of
the extreme x-values of the group
Shifts the objects' right edges to that of the first object selected
Equalizes x-distances between all objects within the span of
the extreme x-values
Spaces objects to have a specified number of points between
them in the y-direction
Definition
No vertical alignment
Shifts the objects' top edges to that of the first object selected
Shifts objects to center their positions to the average of
the extreme y-values of the group
Shifts the objects' bottom edges to that of the first object selected
Equalizes y-distances between all objects within the span of
the extreme y-values
Spaces objects to have a specified number of points between them
in the x-direction
�
Example:
Create a UI containing three buttons, and use the align function to line up the buttons.
% Create a figure window and one button object:
f=figure;
u1 = uicontrol('Style','push', 'parent', f,'pos',...
[20 100 100 100],'string','button1');
% Create two more button objects, not aligned with
% each other or any part of the figure window:
u2 = uicontrol('Style','push', 'parent', f,'pos',...
[150 250 100 100],'string','button2');
u3 = uicontrol('Style','push', 'parent', f,'pos',...
[250 100 100 100],'string','button3');
% Align the button objects with the bottom of the first
% button object, equalizing the distance between the
% objects within the span of the extreme x-values:
align([u1 u2 u3],'distribute','bottom');
all 所有元素非零为真
B = all(A);
B = all(A,dim);
A — Input Arrayscalar | vector | matrix | multidimensional array
Input array, specified as a scalar, vector, matrix, or multidimensional array.
Data
Types: single | double | int8 | int16 | int32 | int64 | uint8 | uint16 | uint32 | uint64 | logic
al | char
Complex Number Support: Yes
dim — Dimension to operate along
positive integer scalar
Dimension to operate along, specified as a positive integer scalar. If no value is
specified, then the default is the first array dimension whose size does not equal 1.
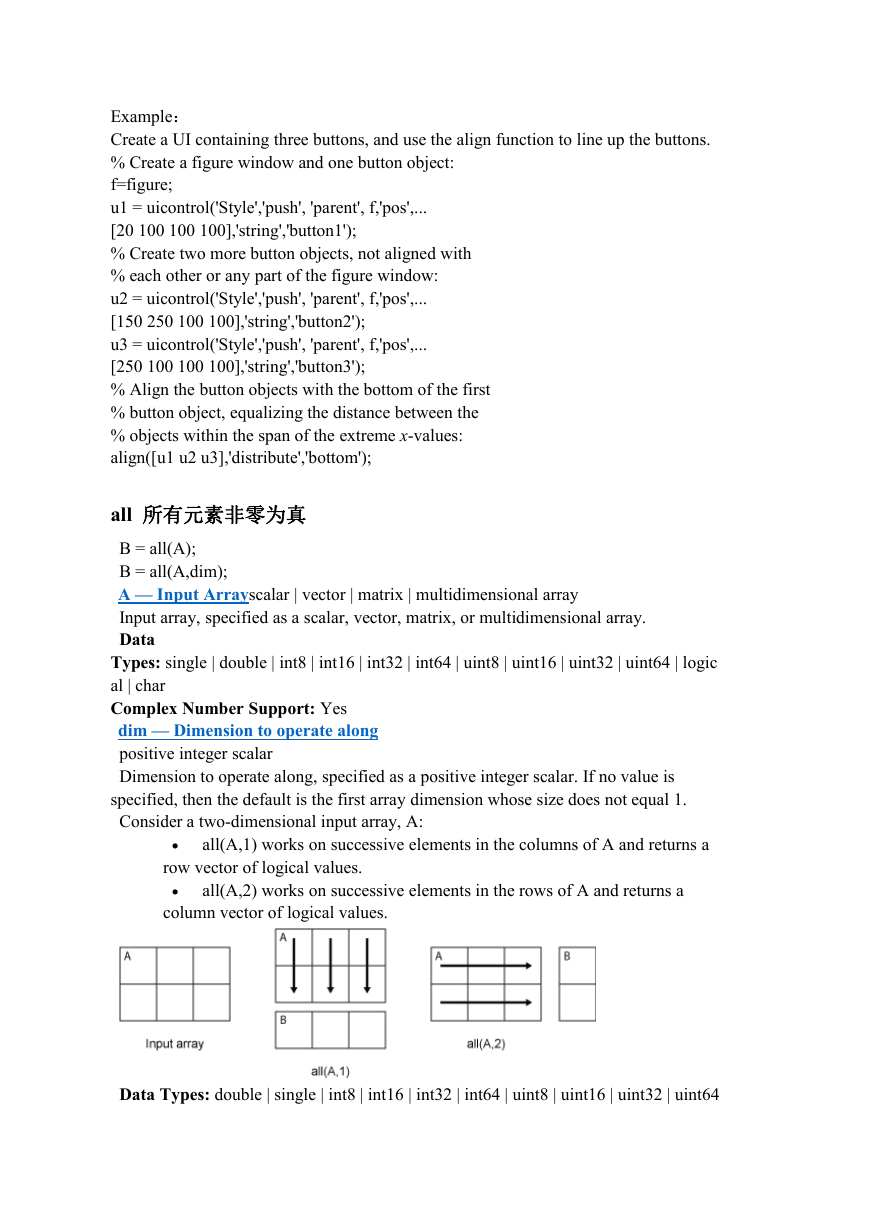
Consider a two-dimensional input array, A:
all(A,1) works on successive elements in the columns of A and returns a
row vector of logical values.
column vector of logical values.
all(A,2) works on successive elements in the rows of A and returns a
Data Types: double | single | int8 | int16 | int32 | int64 | uint8 | uint16 | uint32 | uint64
�
angle 相角
p = angle(Z);
P = angle(Z) returns the phase angles, in radians, for each element of complex
array Z. The angles lie between ±π.
For complex Z, the magnitude R and phase angle theta are given by
R = abs(Z)
theta = angle(Z)
and the statement
Z = R.*exp(i*theta)
converts back to the original complex Z.
ans 表达式计算结果的缺省变量名
any 所有元素非全零为真 –用法和 all 一样
area 面域图
area(Y)
area(X,Y)
area(...,basevalue)
area(...,'PropertyName',PropertyValue,...)
area(axes_handle,...)
h = area(...)
For vectors X and Y, area(X,Y) is the same as plot(X,Y) except that the
plots the vector Y or plots each column in matrix Y as a separate curve
An area graph displays elements in Y as one or more curves and fills the area beneath
each curve. When Y is a matrix,
the curves are stacked showing the relative
contribution of each row element to the total height of the curve at each x interval.
area(Y)
and stacks the curves. The x-axis automatically scales to 1:size(Y,1).
area(X,Y)
area between 0 and Y is filled.
When Y is a matrix, area(X,Y) plots the columns of Y as filled areas. For eachX, the
net result is the sum of corresponding values from the rows of Y.
If X is a vector, length(X) must equal length(Y).
If X is a matrix, size(X) must equal size(Y).
area(...,basevalue)
specifies the base value for the area fill. The default basevalue is 0.
area(...,'PropertyName',PropertyValue,...)
specifies property name and property value pairs for the patch graphics object created
by area.
area(axes_handle,...)
plots into the axes with the handle axes_handle instead of into the current axes (gca).
h = area(...) returns handles of area graphics objects.
�
Creating an area graph of an m-by-n matrix creates n area objects (that is, one per
column), whereas a 1-by-n vector creates one area object.
Some area object properties that you set on an individual area object set the values
for all area objects in the graph. See Area Properties for information on specific
properties.
argnames 函数 M 文件宗量名
Input argument names of cfit, sfit, or fittype object
args = argnames(fun)
returns the input argument (variable and coefficient) names of the cfit, sfit,
or fittype object fun as an n-by-1 cell array of strings args, where n = numargs(fun).
assignin 向变量赋值
assignin(ws, 'var', val)
assigns the value val to the variable var in the workspace ws. The var input must be
the array name only; it cannot contain array indices. If var does not exist in the
specified workspace, assignin creates it. ws can have a value of 'base' or 'caller' to
denote the MATLAB® base workspace or the workspace of the caller function.
错误的例子:
assignin does not assign to specific elements of an array. The following statement
generates an error:
X = 1:8;
assignin('base', 'X(3:5)', -1);
However, you can use the evalin function to do this:
evalin('base','X(3:5) = -1')
X = 1
-1
-1
-1
2
6
7
8
autumn 红黄调秋色图阵
axes 创建轴对象的低层指令
axes('PropertyName',propertyvalue,...)
axes(h)
h = axes(...)
axes('PropertyName',propertyvalue,...)
creates an axes object having the specified property values. For a description of the properties, see Axes
Properties. MATLAB uses default values for any properties that you do not explicitly define as arguments.
The axes function accepts property name/property value pairs, structure arrays, and cell arrays as input
arguments (see the setand get commands for examples of how to specify these data types). While the
�
basic purpose of an axes object is to provide a coordinate system for plotted data, axes properties provide
considerable control over the way MATLAB displays data.
axes(h)
makes existing axes h the current axes and brings the figure containing it into focus. It also makes h the
first axes listed in the figure's Children property and sets the figure'sCurrentAxes property to h.
The current axes is the target for functions that draw image, line, patch, rectangle, surface, and text
graphics objects.
If you want to make an axes the current axes without changing the state of the parent figure, set
the CurrentAxes property of the figure containing the axes:
set(figure_handle,'CurrentAxes',axes_handle)
This command is useful if you want a figure to remain minimized or stacked below other figures, but want
to specify the current axes.
h = axes(...) returns the handle of the created axes object.
Use the set function to modify the properties of an existing axes or the get function to query the
current values of axes properties. Use the gca command to obtain the handle of the current axes.
The axis (not axes) function provides simplified access to commonly used properties that control the
scaling and appearance of axes.
Set default axes properties on the figure and root levels:
set(groot,'DefaultAxesPropertyName',PropertyValue,...)
set(gcf,'DefaultAxesPropertyName',PropertyValue,...)
PropertyName is the name of the axes property and PropertyValue is the value you are specifying.
Use set and get to access axes properties.
axis 控制轴刻度和风格的高层指令
axis(limits)
axis style
axis mode
axis ydirection
axis visibility
lim = axis
[m,v,d] = axis('state')
___ = axis(ax,___)
limits — Axis limitsfour-element vector | six-element vector | eight-element vector
Axis limits, specified as a vector of four, six, or eight elements in one of these forms:
[xmin xmax ymin ymax] — Set the x-axis limits to range from xmin to xmax.
Set the y-axis limits to range from ymin to ymax.
�
[xmin xmax ymin ymax zmin zmax] — Additionally set the z-axis limits to
range from zmin to zmax.
[xmin xmax ymin ymax zmin zmax cmin cmax] — Additionally set the color
limits. cmin is the data value that maps to the first color in the
colormap. cmax is the data value that maps to the last color in the colormap.
Note: For partially automatic limits, use inf or -inf for the limits you want the axes
to choose automatically. For example, axis([-inf 10 0 inf]) lets the axes choose the
appropriate minimum x-axis limit and maximum y-axis limit. It uses the specified
values for the maximum x-axis limit and minimum y-axis limit.
If you specify the limits, then the XLim, YLim, ZLim, and CLim properties for the
axes change to the specified values. Additionally, the associated mode properties
change to 'manual'.
Example: [0 1 0 1]
Example: [0 1 0 1 0 1]
Data Types: single | double | int8 | int16 | int32 | int64 | uint8 | uint16 | uint32 | uint64
mode — Manual, automatic, or semiautomatic selection of axis
limitsmanual | auto | 'auto x' | 'auto y' | 'auto z' | 'auto xy' | 'auto xz' | 'auto yz'
Manual, automatic, or semiautomatic selection of axis limits, specified as one of the
values in this table.
Value Description
manual Freeze all axis limits at their
Axes Properties That Change
Sets XLimMode, YLimMode,
and ZLimMode to 'manual'.
Sets XLimMode, YLimMode,
and ZLimMode to 'auto'.
Sets XLimMode to 'auto'.
Sets YLimMode to 'auto'.
Sets ZLimMode to 'auto'.
auto
current values.
The axes automatically chooses
all axis limits.
'auto x' The axes automatically chooses
the x-axis limits.
'auto y' The axes automatically chooses
the y-axis limits.
'auto z' The axes automatically chooses
the z-axis limits.
The axes automatically chooses
the x-axis and y-axis limits.
The axes automatically chooses
the x-axis and z-axis limits.
The axes automatically chooses
the y-axis and z-axis limits.
'auto
xy'
'auto
xz'
'auto
yz'
style — Axis limits and scalingtight | fill | equal | image | square | vis3d | normal
Axis limits and scaling, specified as one of these values.
Value Description
Sets XLimMode and YLimMode to 'auto'
.
Sets XLimMode and ZLimMode to 'auto'
.
Sets YLimMode and ZLimMode to 'auto'
.
Axes Properties That Change
�
tight
Fit the axes box tightly
around the data by setting the
axis limits equal to the range
of the data.
equal Use the same length for the
data units along each axis.
image Use the same length for the
data units along each axis and
fit the axes box tightly around
the data.
square Use axis lines with equal
fill
lengths. Adjust the
increments between data units
accordingly.
Enable the "stretch-to-fill"
behavior (the default). The
lengths of each axis line fill
the position rectangle defined
in thePosition property of the
axes.
Freeze the aspect ratio
properties.
Restore the default behavior.
XLimMode, YLimMode,
and ZLimMode change to 'auto'. The limits
automatically update to incorporate new
data added to the axes. To keep the limits
from changing when using hold on, use axis
tight manual.
Sets DataAspectRatio to [1 1 1],
sets PlotBoxAspectRatioto [3 4 4], and sets
the associated mode properties to manual.
Disables the "stretch-to-fill" behavior.
Sets DataAspectRatio to [1 1 1]and sets the
associated mode property to manual.
Disables the "stretch-to-fill" behavior.
Sets PlotBoxAspectRatio to [1 1 1] and sets
the associated mode property to manual.
Disables the "stretch-to-fill" behavior.
Sets the plot box aspect ratio mode and data
aspect ratio mode properties to auto.
vis3d
Sets the plot box aspect ratio mode and data
aspect ratio mode properties to manual.
norma
Sets the plot box aspect ratio mode and data
l
aspect ratio mode properties to auto.
For more information on the plot box aspect ratio and the data aspect ratio, see
the PlotBoxAspectRatio and DataAspectRatio properties for the axes.
You can combine style options. The options are evaluated from left to right, so
subsequent options can overwrite properties set by prior ones.
ydirection — y-axis directionxy (default) | ij
y-axis direction, specified as one of these values:
xy — Default direction. For axes with a 2-D view, the y-axis is vertical with
values increasing from bottom to top.
ij — Reverse direction. For axes with a 2-D view, the y-axis is vertical with
values increasing from top to bottom.
visibility — Axes lines and background visibilityon (default) | off
Axes lines and background visibility, specified as either on or off. Specifying the
visibility sets the Visible property of the axes to the same value.
ax — Axes objectsscalar | vector
�
Axes objects, specified as a scalar or a vector. If you do not specify an axes,
then axis sets the limits for the current axes (gca).
When you specify an axes, use single quotes around other input arguments that are
character strings.
Example: axis(ax,'tight')
Example: axis(ax,limits)
Example: axis(ax,'manual')
B b
creates a bar graph with one bar for each element in y. If y is a matrix, then bar groups
the bars according to the rows in y.
bar 二维直方图
bar(y)
bar(x,y)
bar(___,width)
bar(___,style)
bar(___,color)
draws the bars at the locations specified by x.
sets the relative bar width, which controls the separation of bars within a group.
Specify width as a scalar value. Use this option with any of the input argument
combinations in the previous syntaxes.
specifies the style of the bar groups. For example, use 'stacked' to display each group
as one multicolored bar.
sets the color for all the bars. For example, use 'r' for red bars.
bar(___,Name,Value)
sets bar series properties using one or more Name,Value pair arguments. The settings
apply to all bars plotted. For example, use 'EdgeColor','black' to outline all the bars in
black.
bar(ax,___)
plots into the axes specified by ax instead of into the current axes (gca). The option ax
can precede any of the input argument combinations in the previous syntaxes.
b = bar(___)
returns one or more bar series objects. If y is a vector, then bar creates one bar series
object. If y is a matrix, then bar creates a bar series object for each column. Use b to
make future modifications to the bars after they are created.
Input Arguments
x — x valuesvector | matrix
x values, specified as a vector or a matrix. If x and y are both vectors, then they must
be equal length. If x and y are both matrices, then they must be equal size. If x is a
vector and y is a matrix, then the length of x must equal the number of rows in y.
�


 2023年江西萍乡中考道德与法治真题及答案.doc
 2012年重庆南川中考生物真题及答案.doc
 2013年江西师范大学地理学综合及文艺理论基础考研真题.doc
 2020年四川甘孜小升初语文真题及答案I卷.doc
 2020年注册岩土工程师专业基础考试真题及答案.doc
 2023-2024学年福建省厦门市九年级上学期数学月考试题及答案.doc
 2021-2022学年辽宁省沈阳市大东区九年级上学期语文期末试题及答案.doc
 2022-2023学年北京东城区初三第一学期物理期末试卷及答案.doc
 2018上半年江西教师资格初中地理学科知识与教学能力真题及答案.doc
 2012年河北国家公务员申论考试真题及答案-省级.doc
 2020-2021学年江苏省扬州市江都区邵樊片九年级上学期数学第一次质量检测试题及答案.doc
 2022下半年黑龙江教师资格证中学综合素质真题及答案.doc