Problem Chosen
C
2020
MCM/ICM
Summary Sheet
Team Control Number
2002116
Riddle of Sphinx: Cracking the Secret of Amazon’s
Ratings and Reviews
Summary
We have witnessed the rise of mass online marketplaces. For example Amazon, one of the
biggest online platforms, is worth around $ 915 billion. Guided by the customer obsession
principle, it provides an opportunity for the customers to rate the products from 1 to 5. More-
over, buyers can submit a text-based message, namely review, to express their feeling towards
the products. The massive data of those ratings and reviews offer a wealth of information re-
mained to be mined. Analysis of text-based messages or rating-based values has received wide
attention, yet there is not a method severs as the combination of both, especially for the case of
an online marketplace.
To address the above-mentioned challenge, we propose a novel CE-VADER hybrid model
for sentiment analysis in reviews, classifying messages into five groups of strong positive, weak
positive, moderate, weak negative and strong negative. Empirical results indicate that the pro-
posed five-group classification model correlates to the five-star rating system well. Then a
state-of-art informative evaluation model is proposed as the combination of the text-based and
rating-based measures. We pick out 1% most informative reviews and ratings of each product
to evaluate the properties and propose sales strategies.
We propose the “reputation” rate based on the differential equation model in the literature
to evaluate the reputation of the product. Then we employ an Auto Regression (AR) model as
the time series forecasting method to predict future “reputation” rate and the potential success
or the failure of each product. AR model shows high accuracy on the validation set with a
maximum Root Mean Square Error (RMSE) of 0.131. Pacifiers have a good reputation and pre-
dicted to be successful while microwaves and hair dryers have bad reputations and predicted
to fail. The results show relevance with the proportions of the continuous five-star or one-star
rating sequence. Lastly, we analyze specific words and descriptors to find their correlation to
the ratings.
According to our empirical results, we propose some confident sales strategies and recom-
mendations for the online marketplace, e.g., the timing choice of introducing products into
market, targeted adjustment according to star ratings, etc. We write a letter to the marketing
director of Sunshine Company to summarize our analysis and results, together with our rec-
ommendations.
Our framework shows a strong accuracy, robustness. It can be easily implemented to other
data with our source codes.
Keywords: Text-Based Measure, Informative Text Selection, Reputation Quantification, Sales
Strategy Formation.
�
Team # 2002116
Page 1 of 38
Riddle of Sphinx: Cracking the Secret of Amazon’s
Ratings and Reviews
March 9, 2020
Contents
1 Introduction
2 Assumptions and Notations
.
.
2.1 Assumptions .
2.2 Notations .
. .
.
.
. .
.
.
.
.
.
.
.
.
. . . . . . . . . . . . . . . . . . . . . . . . . . . . . .
. . . . . . . . . . . . . . . . . . . . . . . . . . . . . .
.
.
3 Informative Evaluation Model
3.1 Vector Encoding Forms of Star Ratings . . . . . . . . . . . . . . . . . . . . . . . .
3.2 Contextual Entropy VADER Hybrid Model for Text-Based Measures
. . . . . .
3.2.1 Manually Annotating the Seed Word . . . . . . . . . . . . . . . . . . . .
3.2.2 Contextual Entropy Block (CE) . . . . . . . . . . . . . . . . . . . . . . . .
. . . . . . . . . . . . . . . . . . . . . . . . . . . . . . .
3.2.3 VADER Block .
. . . . . . . . . . . . . . .
3.2.4 Proposed CE-VADER for Sentiment Analysis
.
3.3 Combination of Text-Based and Rating-Based Measures . . . . . . . . . . . . .
3.4 Model Implementation, Sensitivity Analysis and Results . . . . . . . . . . . . .
.
.
4 Difference Equation to Measure Time-Based Pattern
4.1 Difference Equation Based Model . . . . . . . . . . . . . . . . . . . . . . . . . . .
4.2 Model Implementation, Sensitivity Analysis and Results . . . . . . . . . . . . .
5 Predict Potential Success or Failure
.
5.1 Time Series Forecasting for Predicting Future Reputation . . . . . . . . . . . .
. . . . . . . . . . . . . . . . . . . . .
5.2 Evaluating the Success or Failure potential
5.3 Model Implementation and Results . . . . . . . . . . . . . . . . . . . . . . . . . .
6 Specific Ratings and Descriptors Analysis
6.1
6.2
.
Specific Star Ratings Relevance to Rating Frequency . . . . . . . . . . . . . . .
Specific Quality Descriptors’ Relevance to Rating Levels
. . . . . . . . . . . . .
6.2.1 Naive Bayesian Model for Evaluation . . . . . . . . . . . . . . . . . . . .
3
4
4
4
4
5
5
7
7
9
9
10
11
11
11
12
14
14
14
14
15
16
18
18
.
.
.
.
.
.
.
.
.
.
.
.
.
.
.
.
.
.
�
Team # 2002116
Page 2 of 38
6.2.2 Model Implementation and Results
. . . . . . . . . . . . . . . . . . . . .
.
7 Attractiveness Analysis of Design Features
8 Sales Strategies and Recommendations
9 Strengths and Weaknesses
.
.
Strengths . .
9.1
9.2 Weaknesses
. .
. .
.
.
.
.
.
.
.
.
.
.
. . . . . . . . . . . . . . . . . . . . . . . . . . . . . . .
. . . . . . . . . . . . . . . . . . . . . . . . . . . . . . .
.
.
10 Conclusion
11 A Letter to the Marketing Director of Sunshine Company
Appendices
Appendix A Annotated Seed Words and Frequency
Appendix B The Number of Keyword Occurrences in Different Keyword Groups
Appendix C Top 1% Most Informative Ratings and Reviews
Appendix D Source Code for VADER Sentiment Analysis
Appendix E Source Code for Informative Algorithm
Appendix F Source Code for Reputation Calculation
Appendix G Source Code for Beyes Model
Appendix H Source Code for Time Series Prediction
Appendix I Source Code for Wordcloud Picture
19
20
20
21
21
22
22
22
24
24
25
26
36
36
37
37
38
38
�
Team # 2002116
1
Introduction
Page 3 of 38
Our society has witnessed the rise of many online marketplaces, with a total worldwide
market value of 4.3 trillion dollars [1]. One salient feature of the online marketplace compared
with traditional platforms is the massive review of texts and ratings. Among all of them, Ama-
zon has received the most attention, as its greatest success [1]. Amazon also provides customers
with chances to freely express their feeling and rate the products that they have purchased.
Previous work [2] indicates that customers will largely refer to the reviews and ratings be-
fore they buy the product on the platforms. Platforms can adjust their sales strategy by checking
these comments. Hence, the ratings and the reviews both provide references to other potential
buyers and massive data to analyze the demand of the customers, which can help to develop
adaptive strategies. By making full use of these data, we can achieve a win-win situation for
both the buyers and the platform.
One of the biggest challenges is the complexity and diversity of the texts of the reviews [3, 4].
In this paper, we propose a novel sentiment analysis model as the text-based measure to address
this issue. In this paper, we develop a series of models as the combination of text-based, rating-
based, and time-based measures to pick out the most informative ratings and reviews to track.
We also construct a novel evaluation framework to quantify the reputation of each product
and predict potential success or failure. Then, we analyze the correlation between continuous
same star ratings, word descriptors and the reputation of the products. We implement our
model on the real data set generated from three different types of products, namely the pacifier,
microwave, and the hair dryer.
Researchers have pointed out the necessity to study when and how the online platforms
should adjust their marketing communication strategy in response to consumer reviews or rat-
ings [5]. We propose several sales strategies and recommendations in this paper based on our
analysis and results.
The rest of the paper is organized as follows. In section 2, we list the main assumptions in
model construction and introduce the notations which will be frequently used in this paper.
In section 3, a novel Information Evaluation Model is proposed. It is made up of a hybrid the
state-of-art CE [6] and VADER [7] for sentiment analysis in the review text. Then we propose
the "importance" rate as a combination of text-based measure (i.e., our proposed CE-VADER
model) and ratings-based measure (i.e., the star-rating and the helpful votes) to indicate how
informative the review and the rating are. To the best of our knowledge, we are the first to
propose a review-text-based sentiment analysis model. In section 4, we employ a difference
equation model as the backbone to measure the time pattern of each product. Moreover, the
"reputation" rate is proposed in this section to measure the growth or the decline of the repu-
tation. In section 5, we employ an Auto Regression model (AR) to predict the change of rep-
utation in the future time domain and propose a fuzzy system to predict the potential success
or failure of each product. More details about the results of our model implemented on given
data can be found in section 6,7,8. The strengths and weaknesses of the proposed model and
framework are discussed in section 9. We conclude in section 10. All source codes are attached
to the Appendix D-I and can be easily implemented to other data sets.
�
Team # 2002116
Page 4 of 38
2 Assumptions and Notations
2.1 Assumptions
To simplify our model and eliminate the complexity, we make the following main assump-
tions in this literature. All assumptions will be re-emphasized once they are used in the con-
struction of our model.
Assumption 1. The online marketplace operates stably. And there were no situations such as an out-
break of an epidemic which would seriously affect the production chain of online shopping.
Assumption 2. The ratings and reviews depict customers’ real experience and feeling about their pur-
chased products. The sentiment in the review text reflects one’s feelings on the products.
Assumption 3. The vast majority of individual differences of customers e.g., economic status and edu-
cational level, are ignored.
Assumption 4. It takes some time for shipping the product. Some customers would prefer making
reviews sometime after receiving the purchased products.
Assumption 5. Consumers pay more attention to the negative comments e.g., low-star rating or nega-
tive reviews when purchasing the products.
2.2 Notations
In this work, we use the nomenclature in Table 1 in the model construction. Other none-
frequent-used symbols will be introduced once they are used.
Table 1: Notations used in this literature
Symbol
id
sid
hvid
Rid
rdid
VEC
INT
IMP
REP
Definition
review id
Type
String
Scalar
Scalar
String
Date
Star rate, subscript is its associated review id
Helpful votes, subscript is its associated review id
Review text, subscript is its associated review id
Review date, subscript is its associated review id
Vector encoding of the star rating
Mapping
Vector encoding of intensity relevant to 5-class seed words Mapping
Mapping
Mapping
Importance rate of review and associated rating
Reputation rate of product at some time
3
Informative Evaluation Model
In this section, we proposed the "importance" to evaluate how informative the review text
and star rates are. The most informative factor we take into account is the sentiment of the
review text. In this literature, we propose a CE-VADER model to address the sentiment analysis
issue in the review text. Our model will classify the text into five groups: strong positive, weak
positive, moderate, weak negative and strong negative in the consistency of the five-star rating
scheme. Then our proposed "importance" will incorporate the text-based measure, star rating
�
Team # 2002116
Page 5 of 38
with their fidelity, correlation. The higher the importance, the more informative it is. The rest
of the section is arranged as follows. In section 3.1, we covert the integral star rate to vector
form. In section 3.2, we propose the CE-VADER, a hybrid model for the text-based measures.
In section 3.3, we introduce the "importance" to calculate how informative the review and the
star rating together are. In section 3.4, we implemented our model on real data set of 3 types
of products to indicate 1% most informative review and star ratings, and analyze the model
sensitivity.
3.1 Vector Encoding Forms of Star Ratings
Consumers can freely express their comments on the products on Amazon by rating one
to five stars after purchasing. A one-star rating is associated with the least satisfaction while
five-star with the highest satisfaction. The one-to-five star rating itself is a sufficient measure.
To combine the ratings-based measure with the text-based measure which we will discuss in
the next section. We would like to convert the star-rating to vector forms in this section.
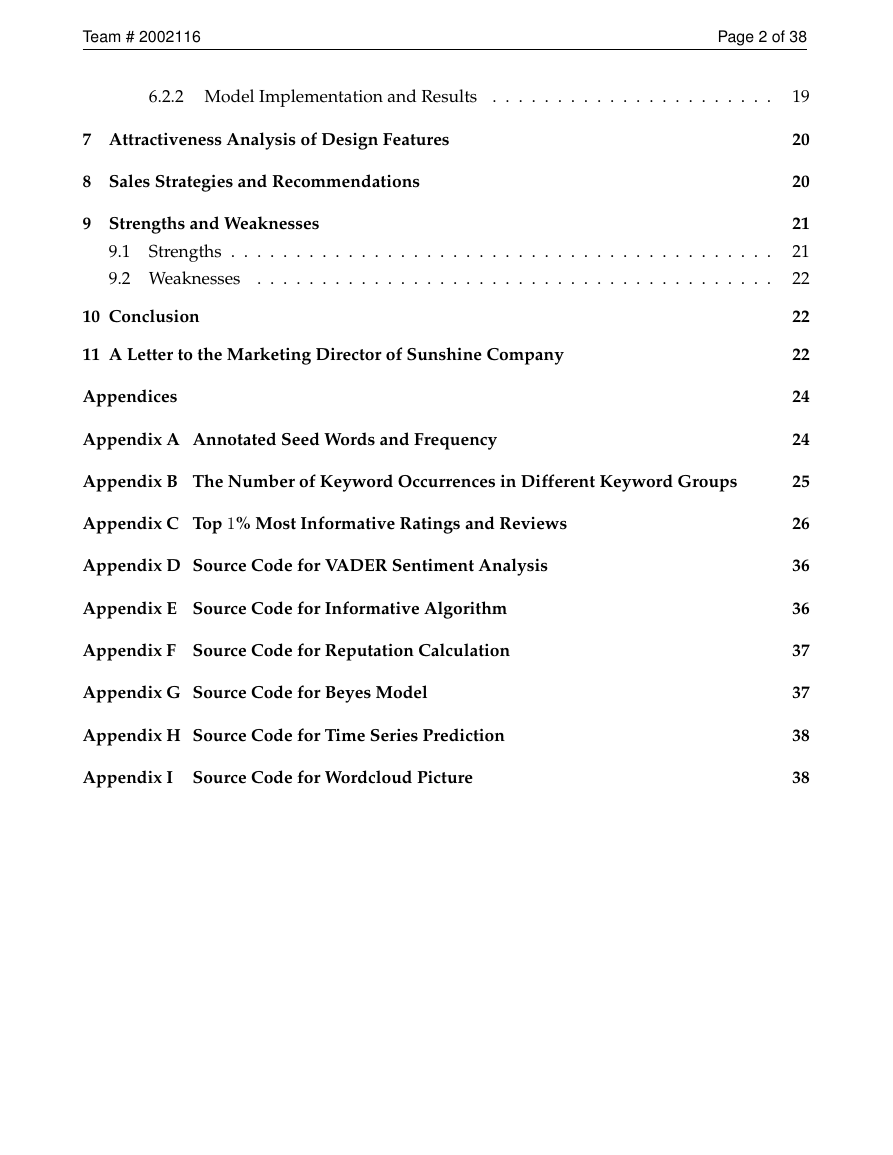
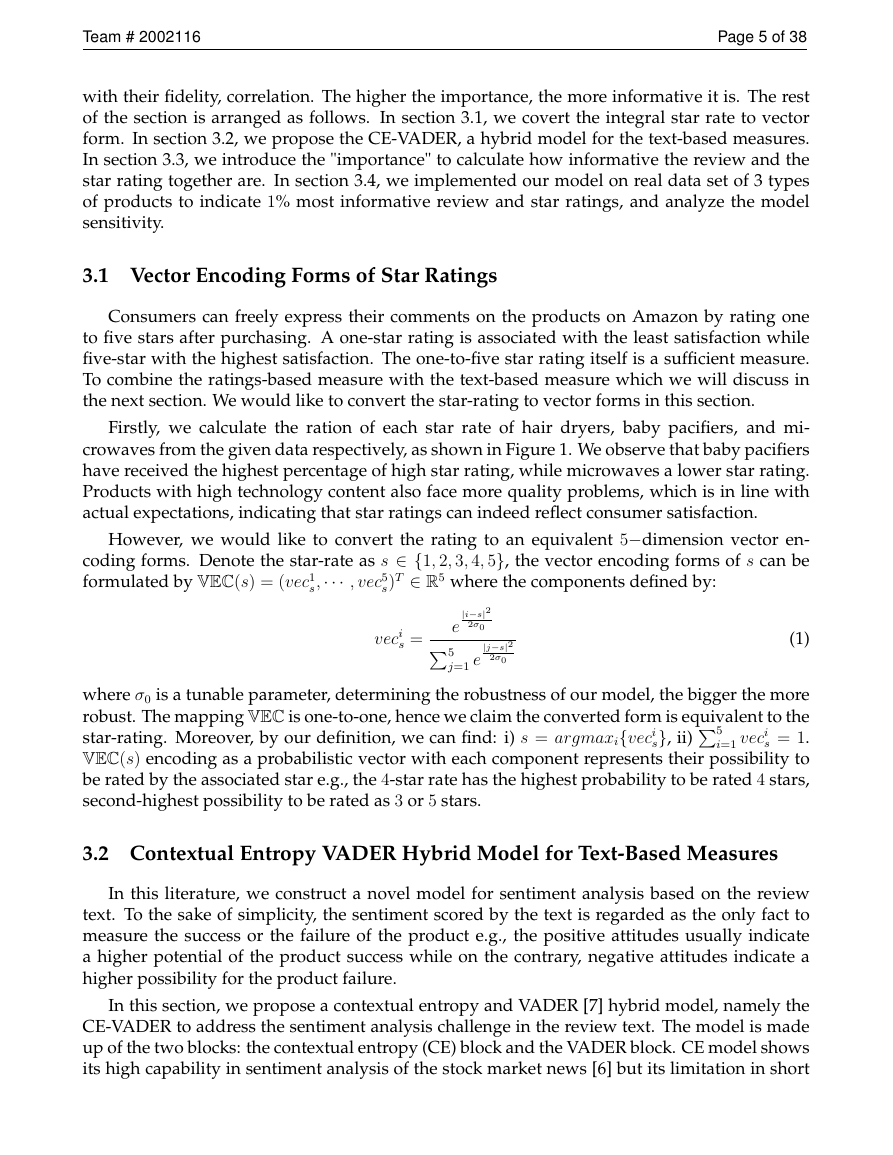
Firstly, we calculate the ration of each star rate of hair dryers, baby pacifiers, and mi-
crowaves from the given data respectively, as shown in Figure 1. We observe that baby pacifiers
have received the highest percentage of high star rating, while microwaves a lower star rating.
Products with high technology content also face more quality problems, which is in line with
actual expectations, indicating that star ratings can indeed reflect consumer satisfaction.
However, we would like to convert the rating to an equivalent 5−dimension vector en-
coding forms. Denote the star-rate as s ∈ {1, 2, 3, 4, 5}, the vector encoding forms of s can be
formulated by VEC(s) = (vec1
s)T ∈ R5 where the components defined by:
s,··· , vec5
veci
s =
|i−s|2
e
2σ05
j=1 e
|j−s|2
2σ0
(1)
where σ0 is a tunable parameter, determining the robustness of our model, the bigger the more
robust. The mapping VEC is one-to-one, hence we claim the converted form is equivalent to the
star-rating. Moreover, by our definition, we can find: i) s = argmaxi{veci
s = 1.
VEC(s) encoding as a probabilistic vector with each component represents their possibility to
be rated by the associated star e.g., the 4-star rate has the highest probability to be rated 4 stars,
second-highest possibility to be rated as 3 or 5 stars.
i=1 veci
s}, ii)5
3.2 Contextual Entropy VADER Hybrid Model for Text-Based Measures
In this literature, we construct a novel model for sentiment analysis based on the review
text. To the sake of simplicity, the sentiment scored by the text is regarded as the only fact to
measure the success or the failure of the product e.g., the positive attitudes usually indicate
a higher potential of the product success while on the contrary, negative attitudes indicate a
higher possibility for the product failure.
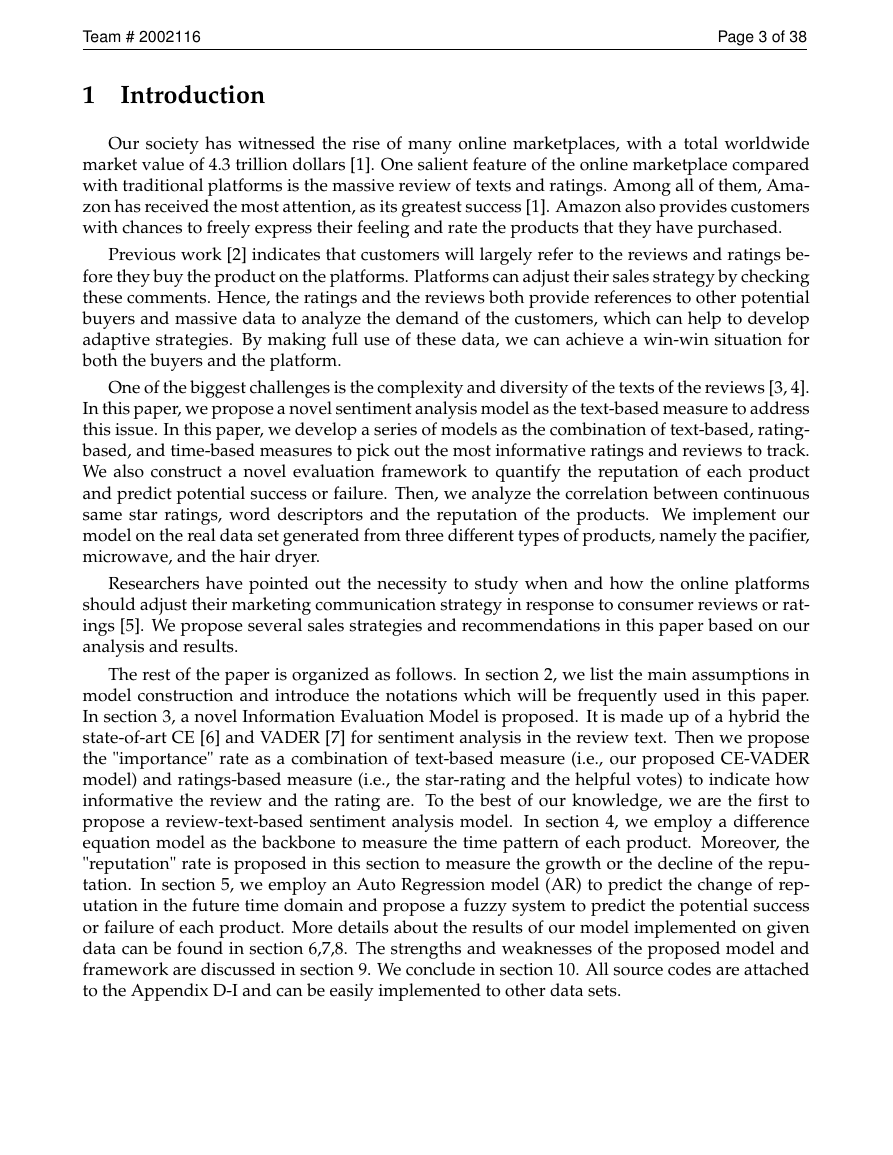
In this section, we propose a contextual entropy and VADER [7] hybrid model, namely the
CE-VADER to address the sentiment analysis challenge in the review text. The model is made
up of the two blocks: the contextual entropy (CE) block and the VADER block. CE model shows
its high capability in sentiment analysis of the stock market news [6] but its limitation in short
�
Team # 2002116
Page 6 of 38
Figure 1: Star rating distribution of pacifier, microwave and hair dryer based on the given data.
context e.g., the review in this literature. While the VADER model outperforms the state-of-art
nature language model in short online texture but their accuracy depends a lot on the pre-listed
lexicon words. The two blocks of CE-VADER will separative outcome a 5−dimension prob-
abilistic vector with each component represents the probability of being its associated group.
After a voting block, our proposed model will classify the review into one of the five groups
together with an intensity showing how intense it is to be classified into the group. By hybridiz-
ing both models, we show CE-VADER can classify the review context into five groups in the
consistency of the star rating.
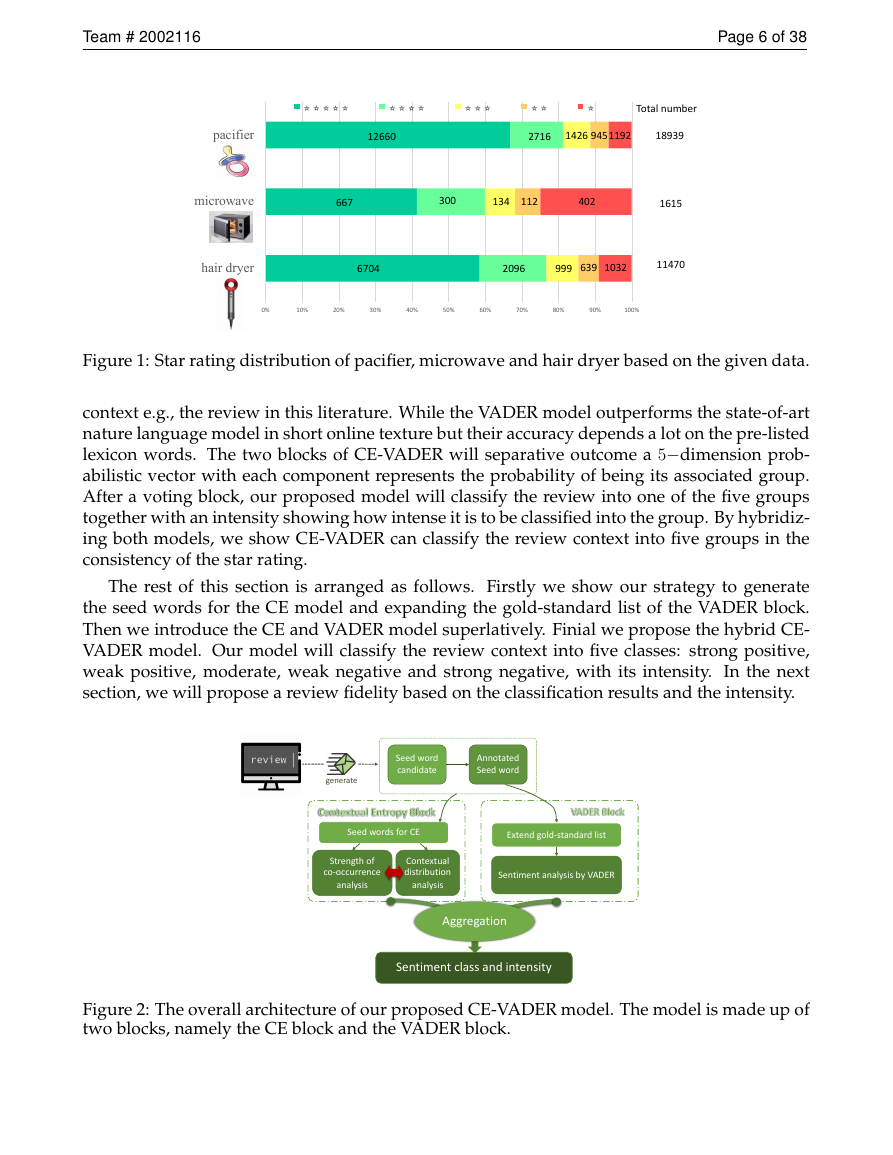
The rest of this section is arranged as follows. Firstly we show our strategy to generate
the seed words for the CE model and expanding the gold-standard list of the VADER block.
Then we introduce the CE and VADER model superlatively. Finial we propose the hybrid CE-
VADER model. Our model will classify the review context into five classes: strong positive,
weak positive, moderate, weak negative and strong negative, with its intensity. In the next
section, we will propose a review fidelity based on the classification results and the intensity.
Seed word
candidate
Annotated
Seed word
generate
Seed words for CE
Extend gold-standard list
Strength of
co-occurrence
analysis
Contextual
distribution
analysis
Sentiment analysis by VADER
Aggregation
Sentiment class and intensity
Figure 2: The overall architecture of our proposed CE-VADER model. The model is made up of
two blocks, namely the CE block and the VADER block.
0%10%20%30%40%50%60%70%80%90%100%hair dryermicrowavepacifier⭐⭐⭐⭐⭐⭐⭐⭐⭐⭐⭐⭐⭐⭐⭐1266027161426300Total number189391615114709451192667134112402670420969996391032�
Team # 2002116
Page 7 of 38
3.2.1 Manually Annotating the Seed Word
We put 80% of the data as the training set and all the rest 20% as the testing set of eval-
uations. Sentences in the review body from the training set are broken down into separated
words, among which are statistically calculated their frequency. The high-frequency emotion
words are picked out as seed words and manually annotated by us, while the low-frequency
ones are discarded. The annotator (one of our group members) will incorporate his expertise
natural-language processing knowledge for the classifying all the selected emotion words into
five groups i.e., strong positive, weak positive, moderate, weak negative and strong negative.
Instead of coarse two-group annotations of either "positive" or "negative" [6], we detailedly
sub-classify each one into "strong" and "weak" subgroups and set aside one more group labeled
as "moderate". The five-group annotation strategies aim to correlate with the one-to-five-star-
rating score e.g., "weak positive" maps to the four-star-rating. We denote the five groups of the
seed word as Gi, with i = 1, 2, 3, 4, 5.
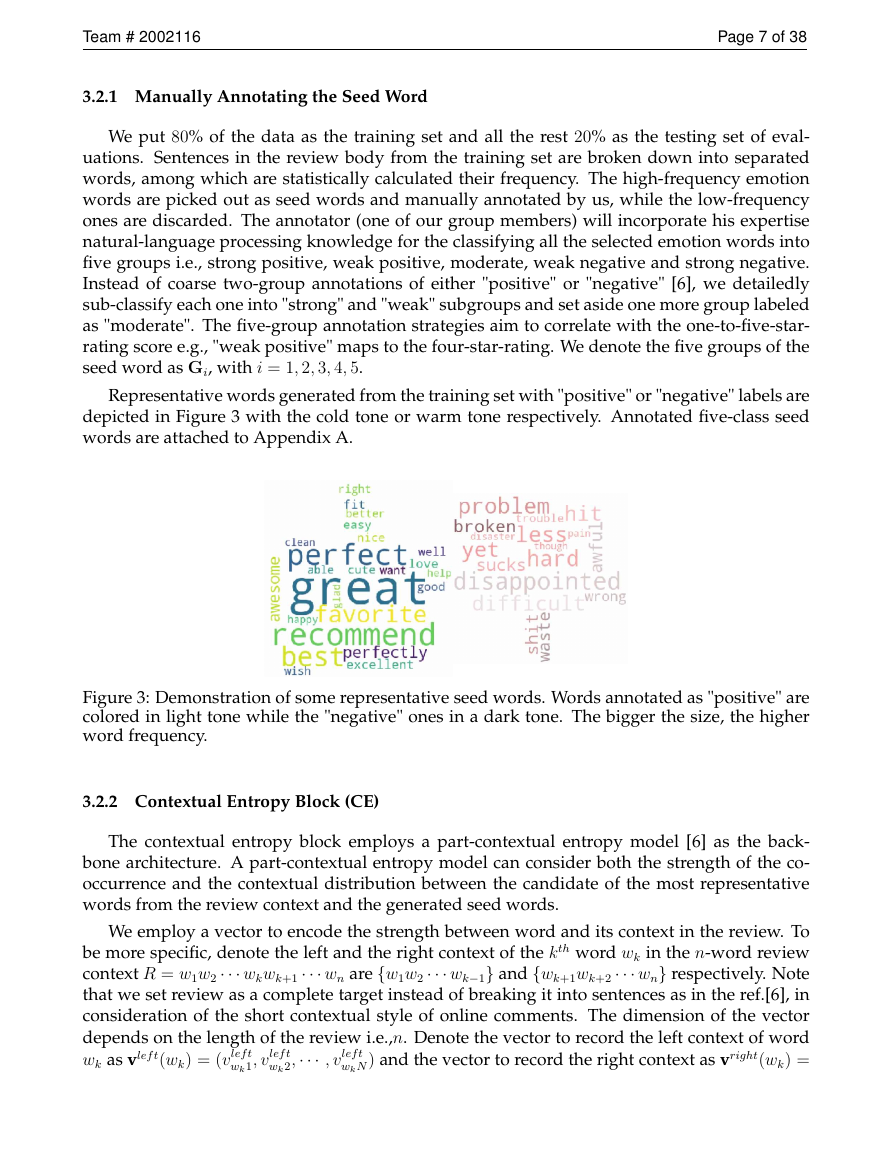
Representative words generated from the training set with "positive" or "negative" labels are
depicted in Figure 3 with the cold tone or warm tone respectively. Annotated five-class seed
words are attached to Appendix A.
Figure 3: Demonstration of some representative seed words. Words annotated as "positive" are
colored in light tone while the "negative" ones in a dark tone. The bigger the size, the higher
word frequency.
3.2.2 Contextual Entropy Block (CE)
The contextual entropy block employs a part-contextual entropy model [6] as the back-
bone architecture. A part-contextual entropy model can consider both the strength of the co-
occurrence and the contextual distribution between the candidate of the most representative
words from the review context and the generated seed words.
We employ a vector to encode the strength between word and its context in the review. To
be more specific, denote the left and the right context of the kth word wk in the n-word review
context R = w1w2 ··· wkwk+1 ··· wn are {w1w2 ··· wk−1} and {wk+1wk+2 ··· wn} respectively. Note
that we set review as a complete target instead of breaking it into sentences as in the ref.[6], in
consideration of the short contextual style of online comments. The dimension of the vector
depends on the length of the review i.e.,n. Denote the vector to record the left context of word
wk as vlef t(wk) = (vlef t
wkN ) and the vector to record the right context as vright(wk) =
wk2,··· , vlef t
wk1, vlef t
�



 2023年江西萍乡中考道德与法治真题及答案.doc
 2012年重庆南川中考生物真题及答案.doc
 2013年江西师范大学地理学综合及文艺理论基础考研真题.doc
 2020年四川甘孜小升初语文真题及答案I卷.doc
 2020年注册岩土工程师专业基础考试真题及答案.doc
 2023-2024学年福建省厦门市九年级上学期数学月考试题及答案.doc
 2021-2022学年辽宁省沈阳市大东区九年级上学期语文期末试题及答案.doc
 2022-2023学年北京东城区初三第一学期物理期末试卷及答案.doc
 2018上半年江西教师资格初中地理学科知识与教学能力真题及答案.doc
 2012年河北国家公务员申论考试真题及答案-省级.doc
 2020-2021学年江苏省扬州市江都区邵樊片九年级上学期数学第一次质量检测试题及答案.doc
 2022下半年黑龙江教师资格证中学综合素质真题及答案.doc