Tutorial
Quick Start Gephi Tutorial
Quick Start
* Introduction
* Import file
* Visualization
* Layout
* Ranking (color)
* Metrics
* Ranking (size)
* Layout again
* Show labels
* Community-detection
* Partition
* Filter
* Preview
* Export
* Save
* Conclusion
Welcome to this introduction tutorial. It will guide you to the basic steps of network
visualization and manipulation in Gephi.
Gephi version 0.7alpha2 was used to do this tutorial.
Get Gephi
Last updated March 05th, 2010
�
Tutorial
Quick Start
* Introduction
* Import file
* Visualization
* Layout
* Ranking (color)
* Metrics
* Ranking (size)
* Layout again
* Show labels
* Community-detection
* Partition
* Filter
* Preview
* Export
* Save
* Conclusion
Open Graph File
• Download the file LesMiserables.gexf
• In the menubar, go to File Menu and Open...
Graph Format
- GEXF
- GraphML
- Pajek NET
- GDF
- GML
- Tulip TLP
- CSV
- Compressed ZIP
�
Tutorial
Quick Start
* Introduction
* Import file
* Visualization
* Layout
* Ranking (color)
* Metrics
* Ranking (size)
* Layout again
* Show labels
* Community-detection
* Partition
* Filter
* Preview
* Export
* Save
* Conclusion
Import Report
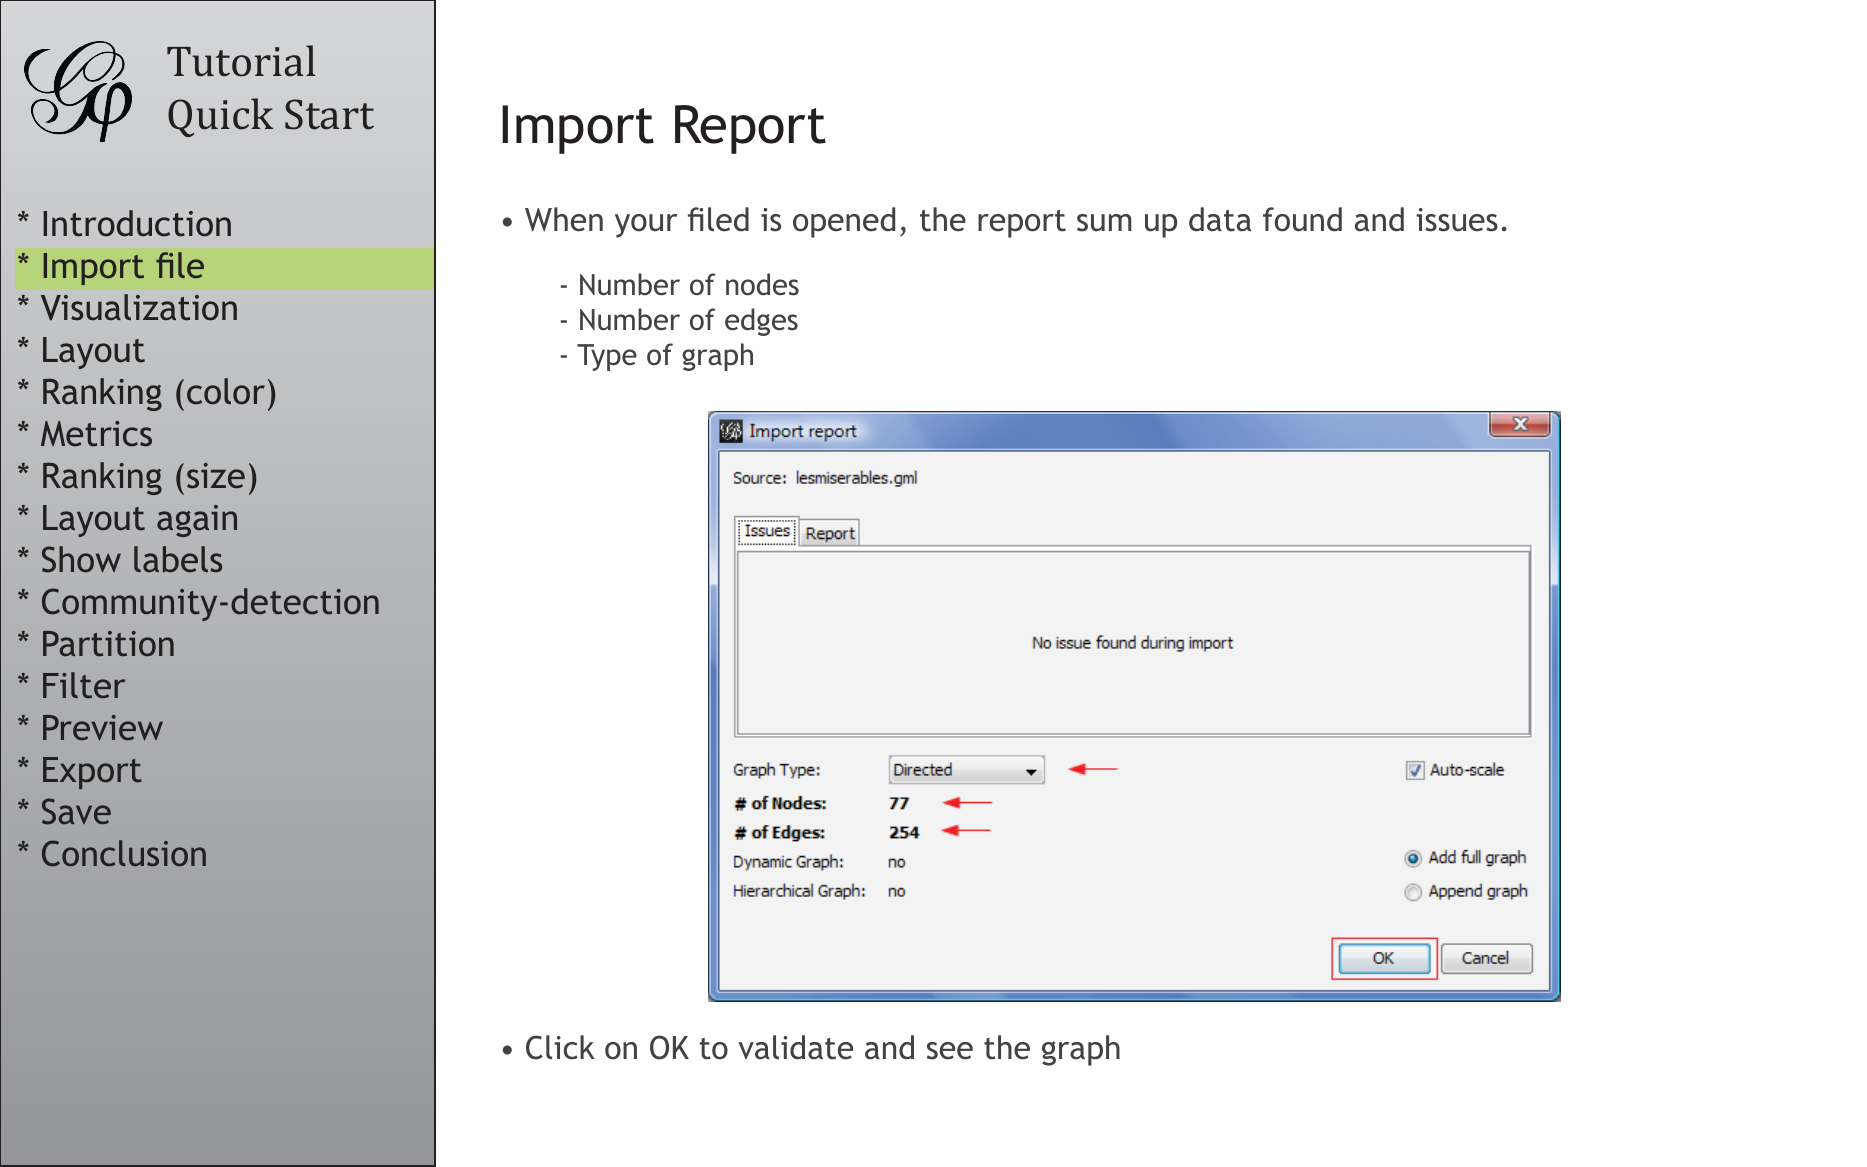
• When your filed is opened, the report sum up data found and issues.
- Number of nodes
- Number of edges
- Type of graph
• Click on OK to validate and see the graph
�
Tutorial
Quick Start
* Introduction
* Import file
* Visualization
* Layout
* Ranking (color)
* Metrics
* Ranking (size)
* Layout again
* Show labels
* Community-detection
* Partition
* Filter
* Preview
* Export
* Save
* Conclusion
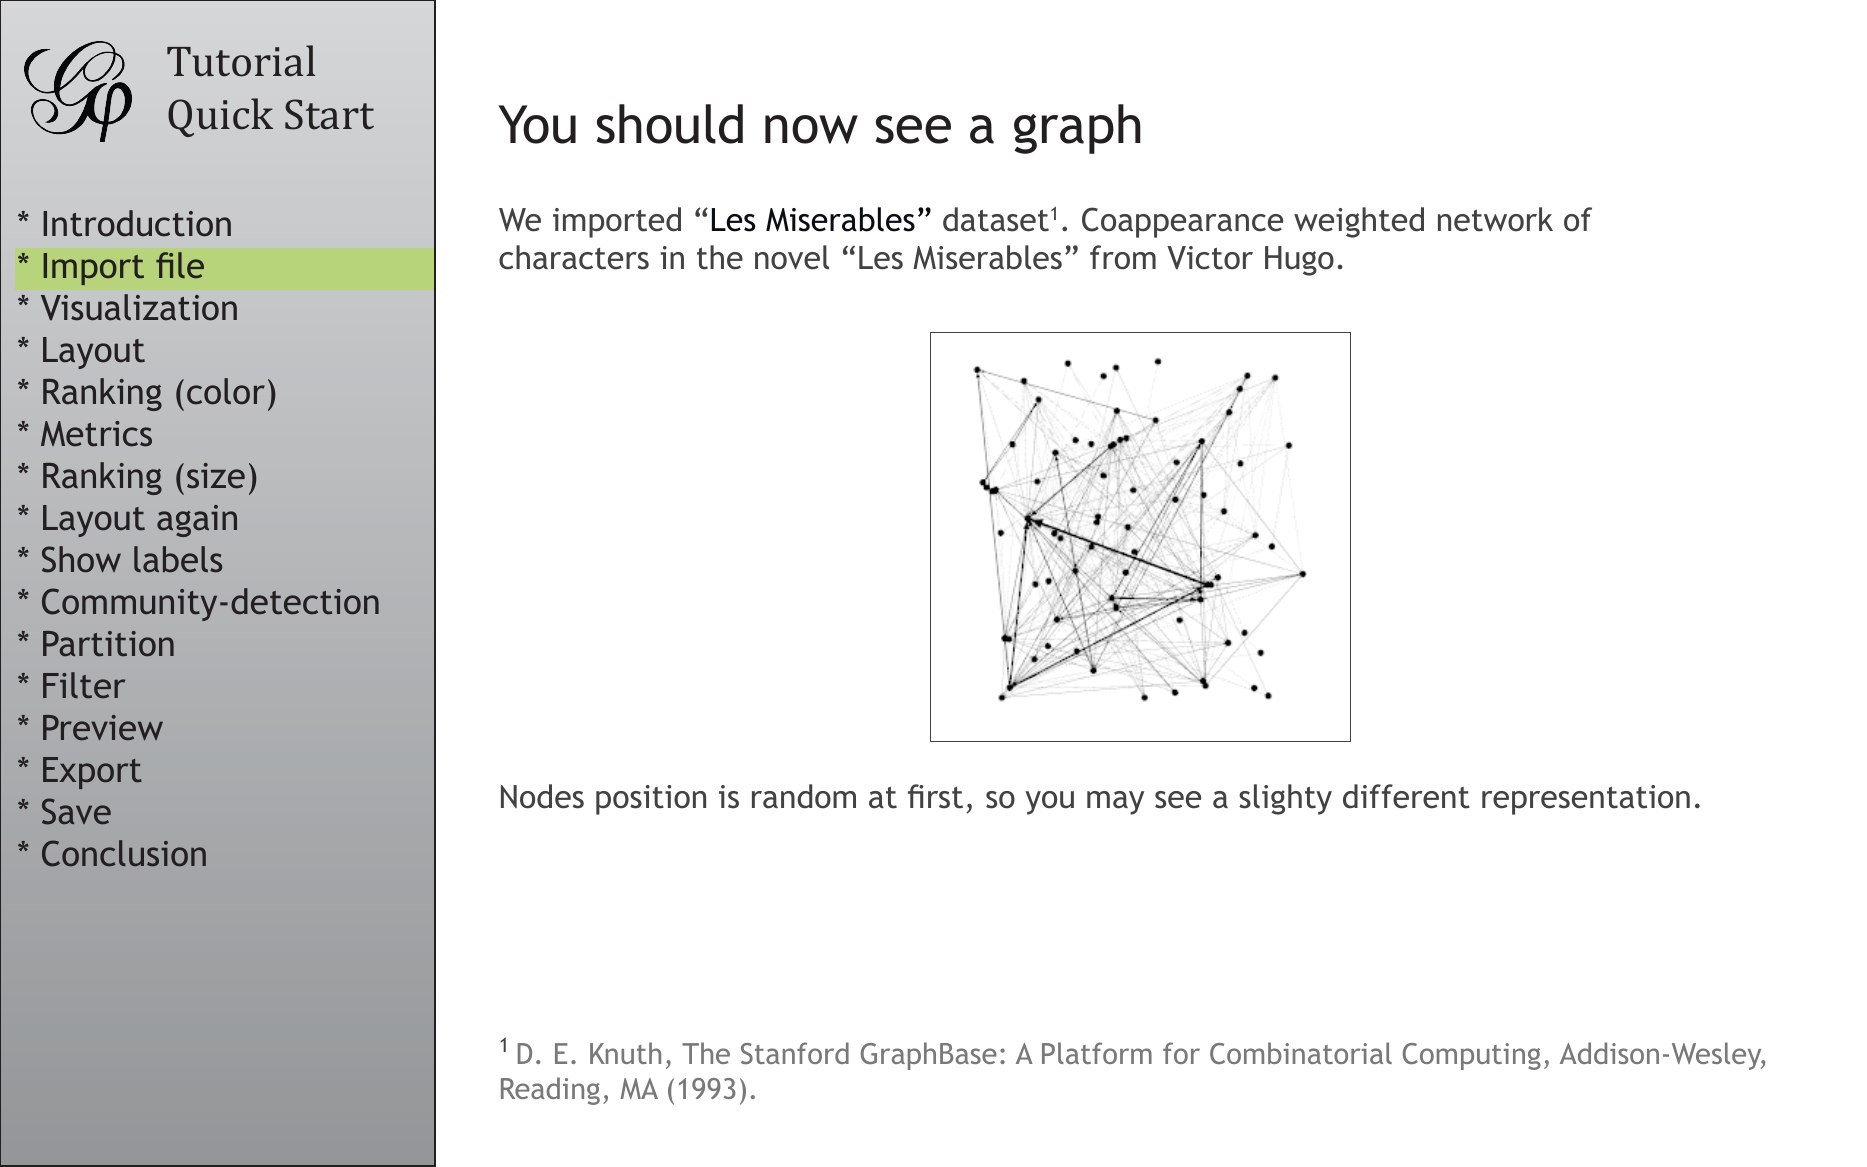
You should now see a graph
We imported “Les Miserables” dataset1. Coappearance weighted network of
characters in the novel “Les Miserables” from Victor Hugo.
Nodes position is random at first, so you may see a slighty different representation.
1 D. E. Knuth, The Stanford GraphBase: A Platform for Combinatorial Computing, Addison-Wesley,
Reading, MA (1993).
�
Tutorial
Quick Start
* Introduction
* Import file
* Visualization
* Layout
* Ranking (color)
* Metrics
* Ranking (size)
* Layout again
* Show labels
* Community-detection
* Partition
* Filter
* Preview
* Export
* Save
* Conclusion
Graph Visualization
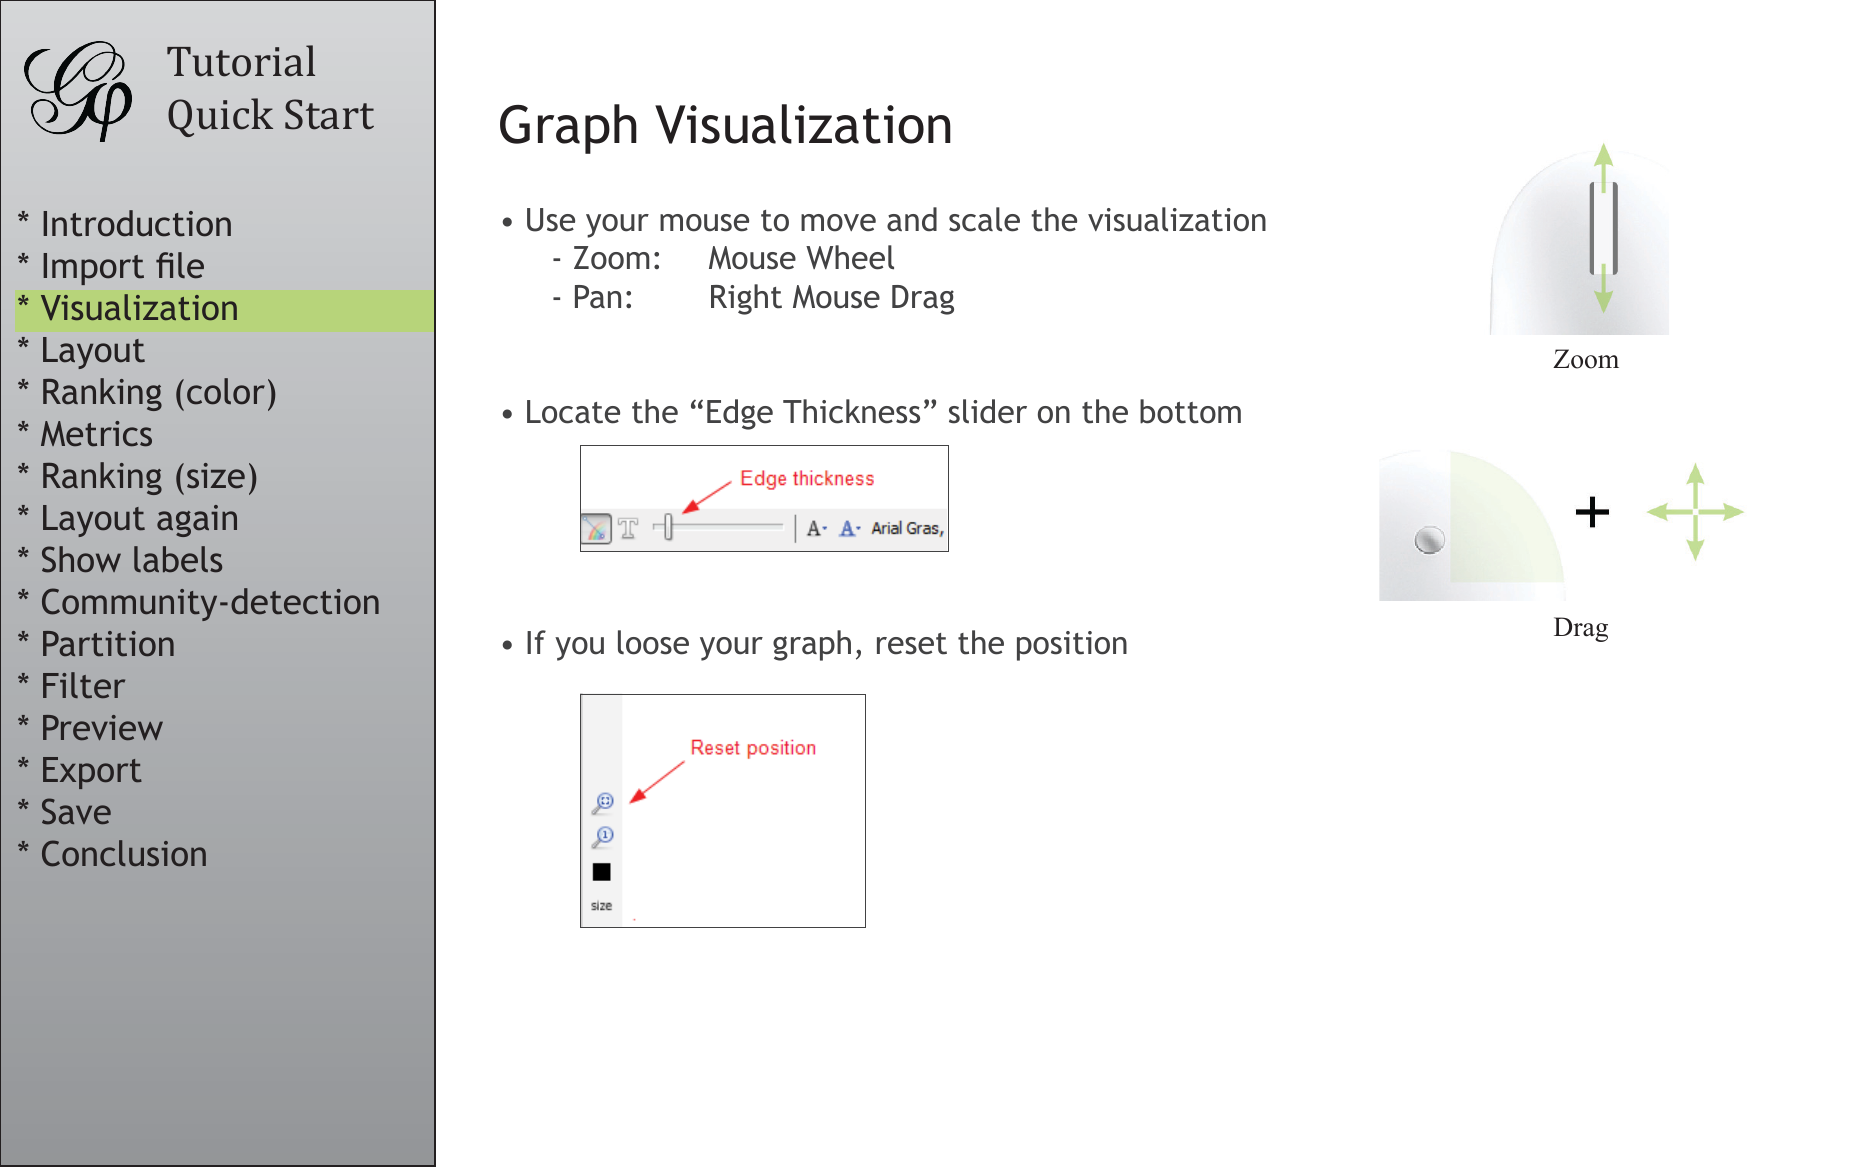
• Use your mouse to move and scale the visualization
- Zoom: Mouse Wheel
- Pan:
Right Mouse Drag
• Locate the “Edge Thickness” slider on the bottom
• If you loose your graph, reset the position
Zoom
Drag
�
Tutorial
Quick Start
* Introduction
* Import file
* Visualization
* Layout
* Ranking (color)
* Metrics
* Ranking (size)
* Layout again
* Show labels
* Community-detection
* Partition
* Filter
* Preview
* Export
* Save
* Conclusion
Layout the graph
Layout algorithms sets the graph shape, it is the most essential action.
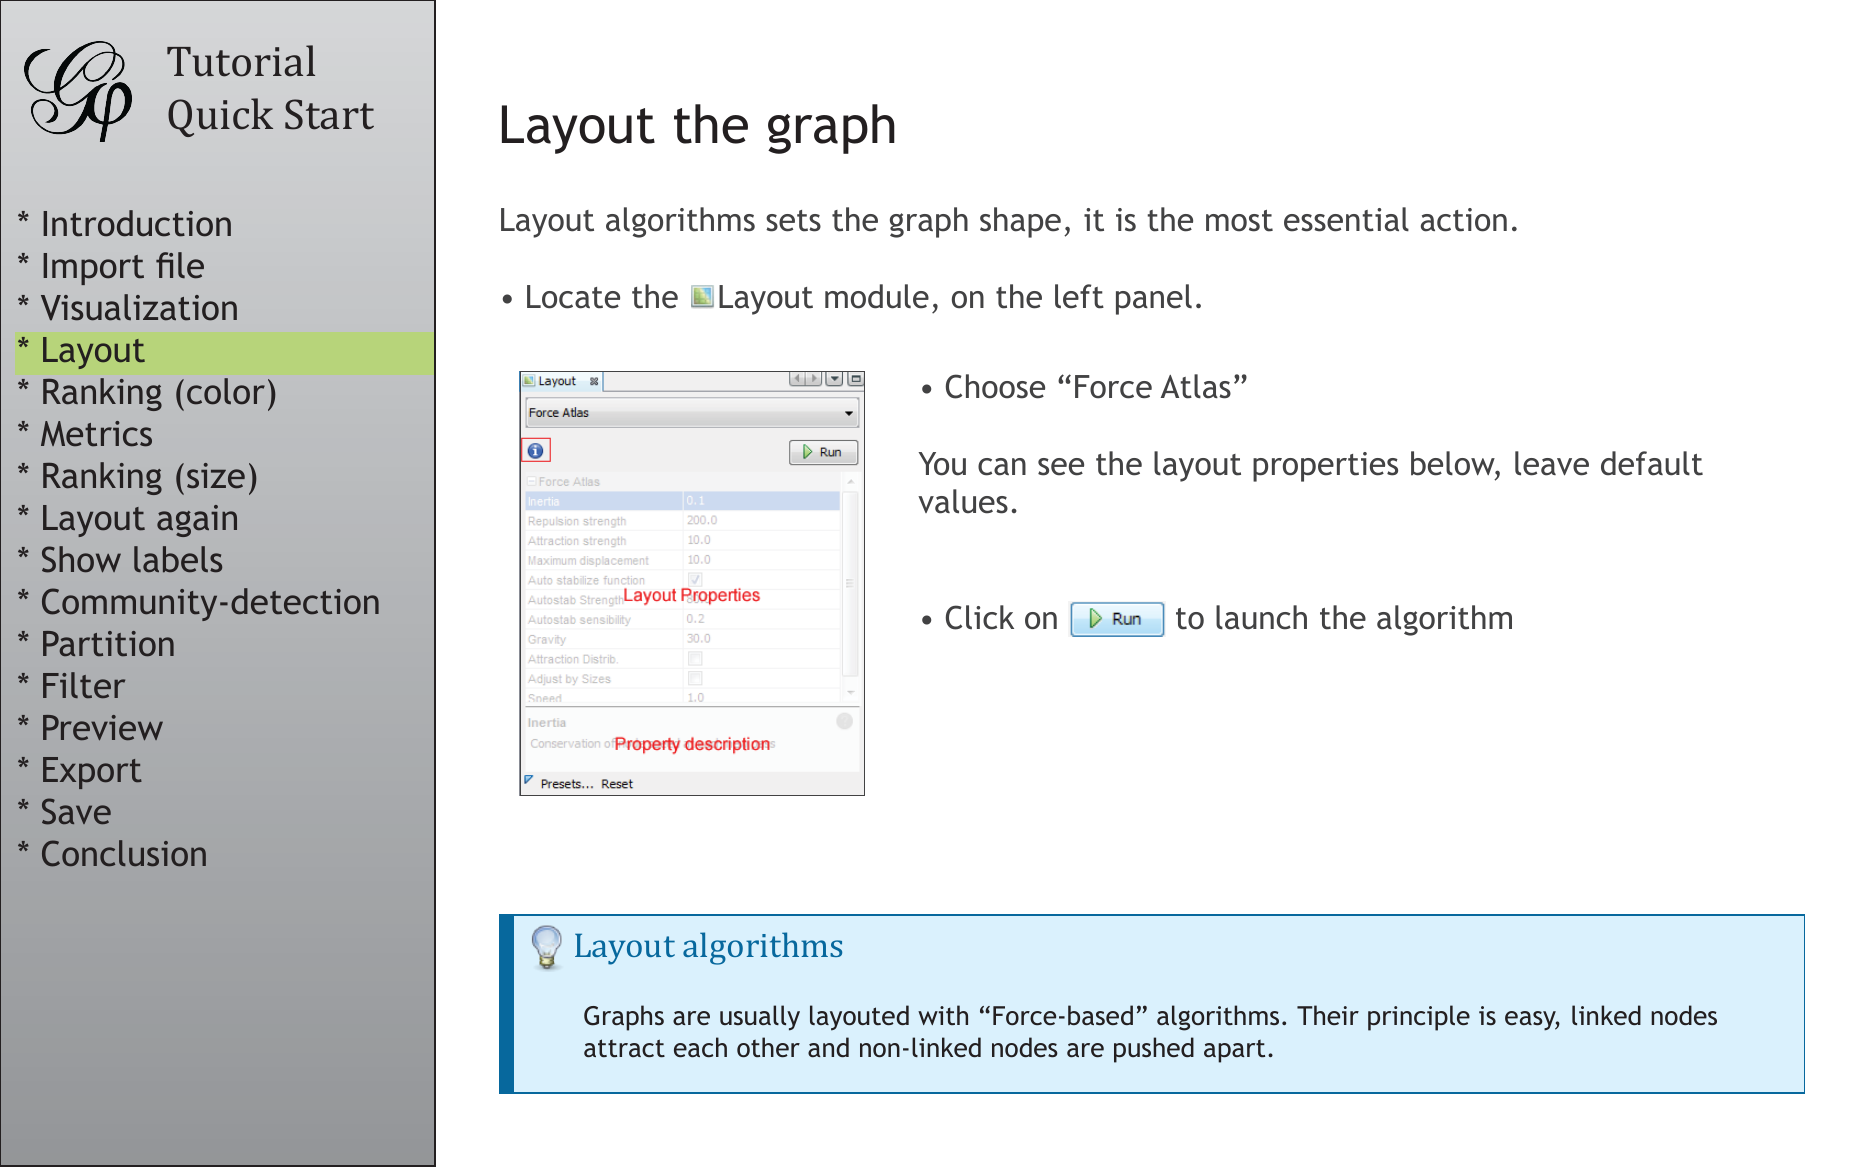
• Locate the Layout module, on the left panel.
• Choose “Force Atlas”
You can see the layout properties below, leave default
values.
• Click on to launch the algorithm
Layout algorithms
Graphs are usually layouted with “Force-based” algorithms. Their principle is easy, linked nodes
attract each other and non-linked nodes are pushed apart.
�
Tutorial
Quick Start
* Introduction
* Import file
* Visualization
* Layout
* Ranking (color)
* Metrics
* Ranking (size)
* Layout again
* Show labels
* Community-detection
* Partition
* Filter
* Preview
* Export
* Save
* Conclusion
Control the layout
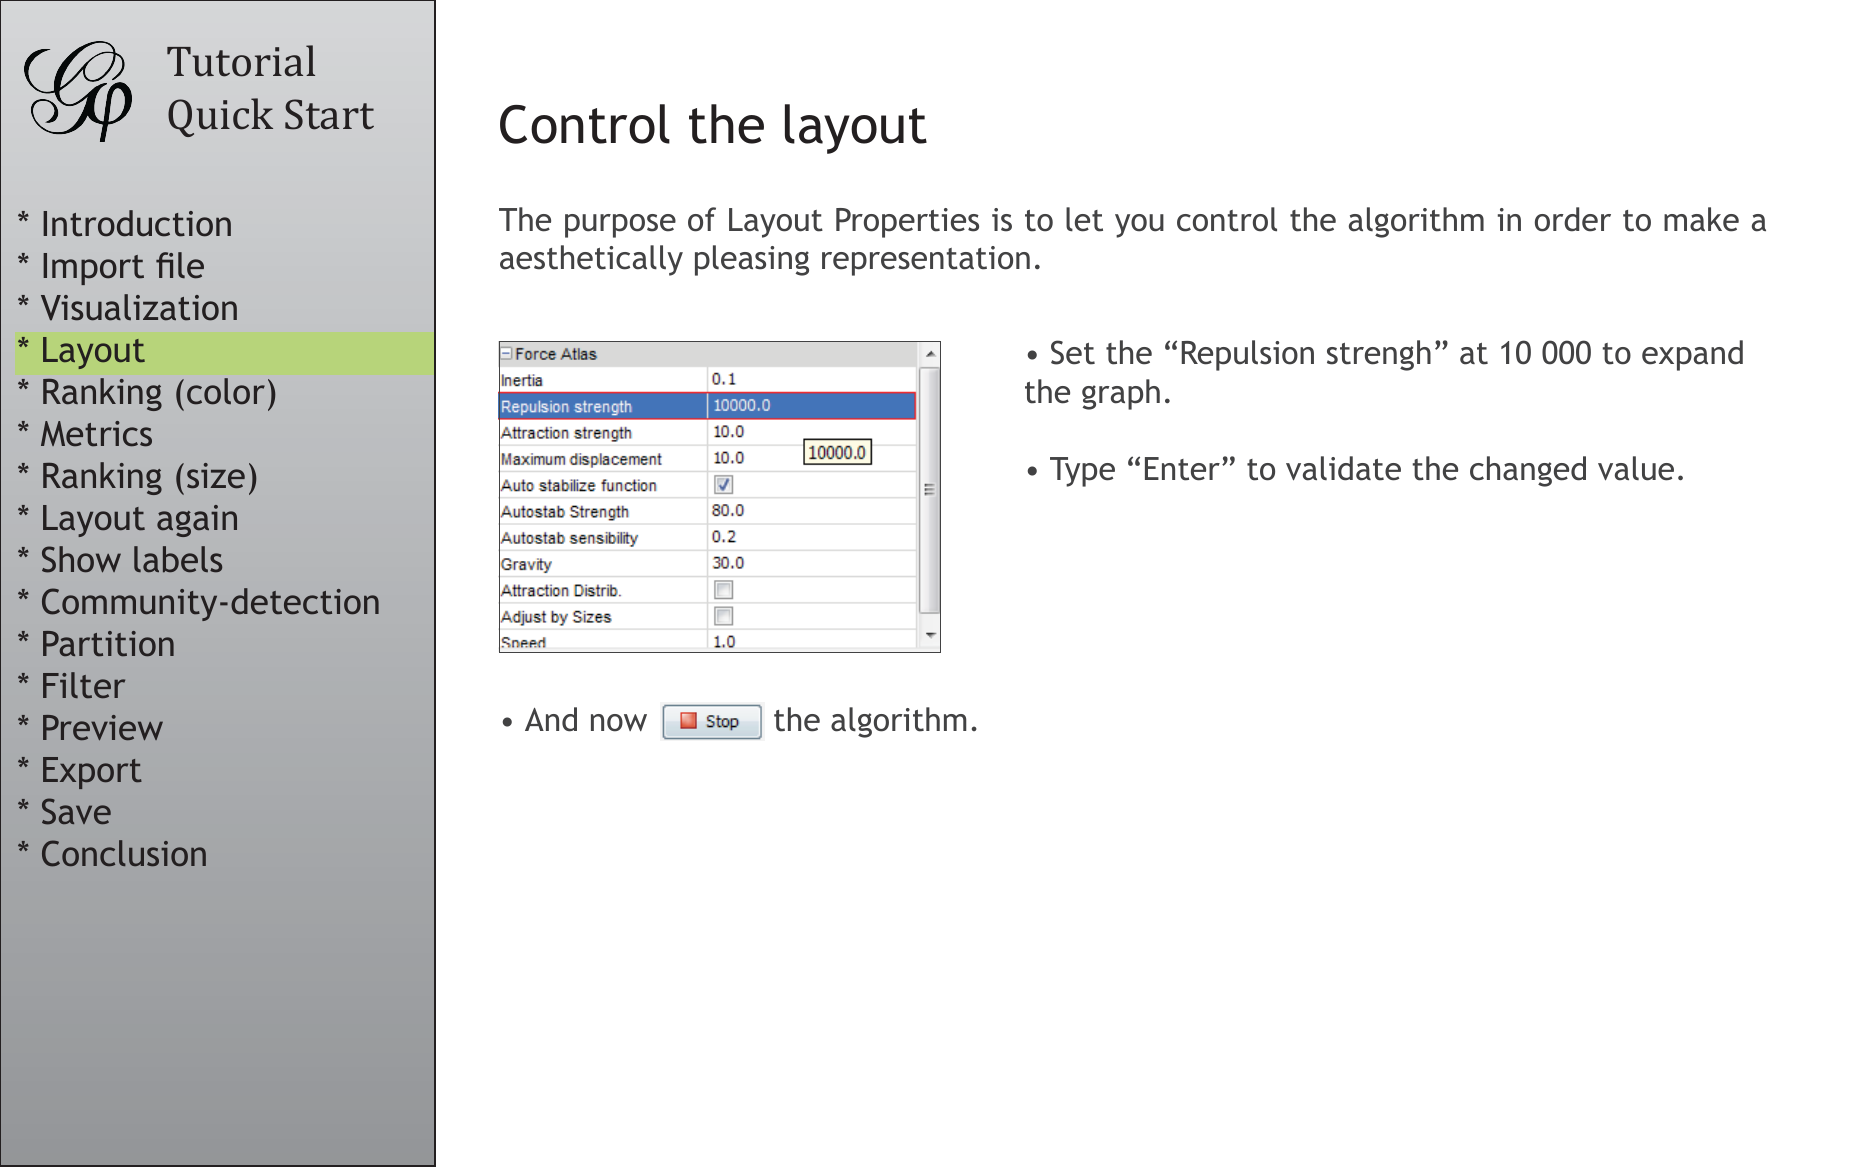
The purpose of Layout Properties is to let you control the algorithm in order to make a
aesthetically pleasing representation.
• Set the “Repulsion strengh” at 10 000 to expand
the graph.
• Type “Enter” to validate the changed value.
• And now the algorithm.
�
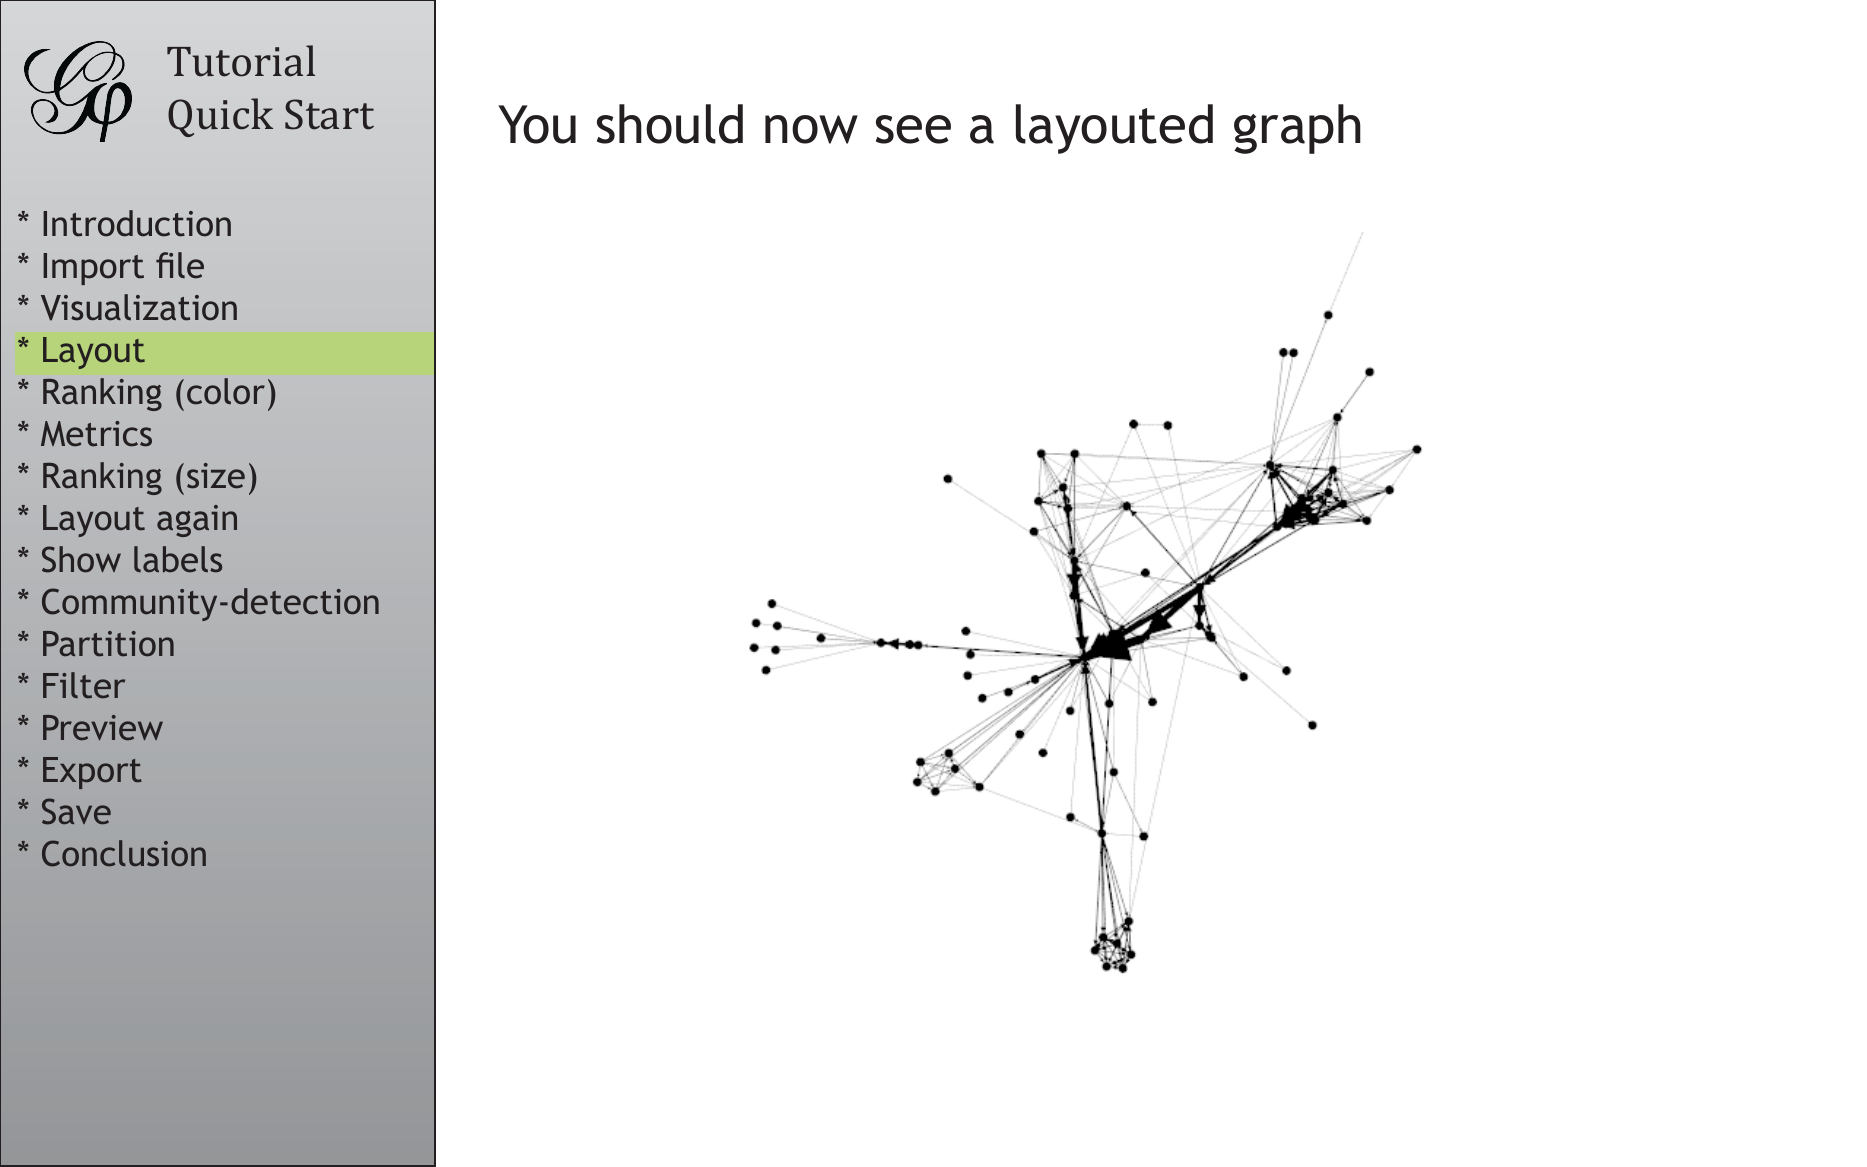
You should now see a layouted graph
Tutorial
Quick Start
* Introduction
* Import file
* Visualization
* Layout
* Ranking (color)
* Metrics
* Ranking (size)
* Layout again
* Show labels
* Community-detection
* Partition
* Filter
* Preview
* Export
* Save
* Conclusion
�




 2023年江西萍乡中考道德与法治真题及答案.doc
 2012年重庆南川中考生物真题及答案.doc
 2013年江西师范大学地理学综合及文艺理论基础考研真题.doc
 2020年四川甘孜小升初语文真题及答案I卷.doc
 2020年注册岩土工程师专业基础考试真题及答案.doc
 2023-2024学年福建省厦门市九年级上学期数学月考试题及答案.doc
 2021-2022学年辽宁省沈阳市大东区九年级上学期语文期末试题及答案.doc
 2022-2023学年北京东城区初三第一学期物理期末试卷及答案.doc
 2018上半年江西教师资格初中地理学科知识与教学能力真题及答案.doc
 2012年河北国家公务员申论考试真题及答案-省级.doc
 2020-2021学年江苏省扬州市江都区邵樊片九年级上学期数学第一次质量检测试题及答案.doc
 2022下半年黑龙江教师资格证中学综合素质真题及答案.doc