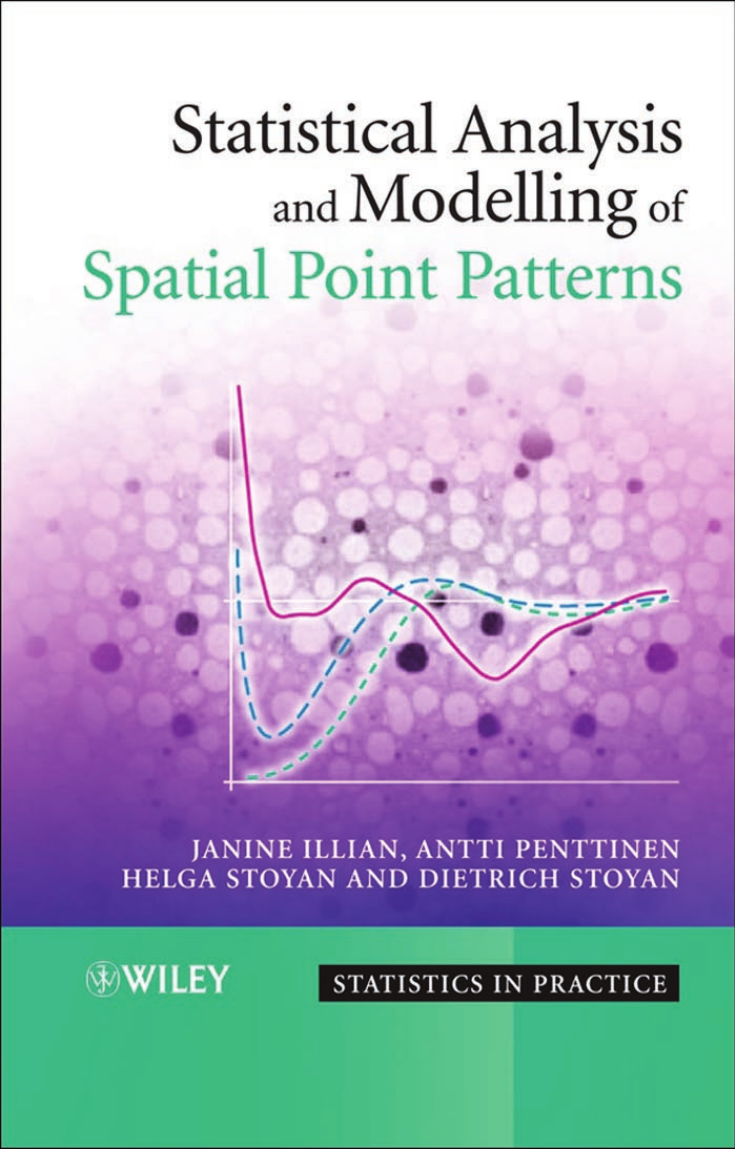
Statistical Analysis and Modelling of Spatial Point Patterns
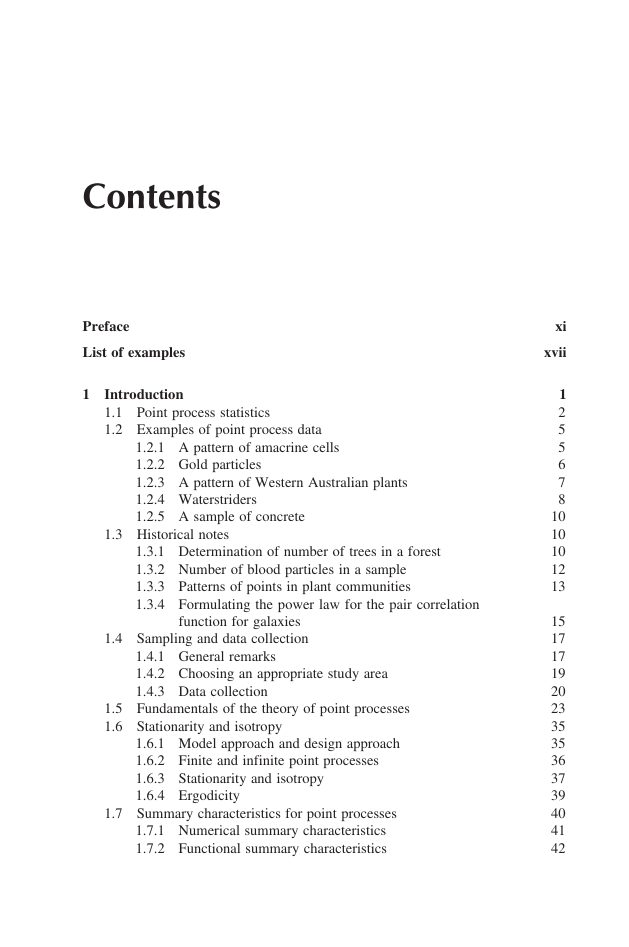
Contents
Preface
List of examples
1 Introduction
1.1 Point process statistics
1.2 Examples of point process data
1.2.1 A pattern of amacrine cells
1.2.2 Gold particles
1.2.3 A pattern of Western Australian plants
1.2.4 Waterstriders
1.2.5 A sample of concrete
1.3 Historical notes
1.3.1 Determination of number of trees in a forest
1.3.2 Number of blood particles in a sample
1.3.3 Patterns of points in plant communities
1.3.4 Formulating the power law for the pair correlation function for galaxies
1.4 Sampling and data collection
1.4.1 General remarks
1.4.2 Choosing an appropriate study area
1.4.3 Data collection
1.5 Fundamentals of the theory of point processes
1.6 Stationarity and isotropy
1.6.1 Model approach and design approach
1.6.2 Finite and infinite point processes
1.6.3 Stationarity and isotropy
1.6.4 Ergodicity
1.7 Summary characteristics for point processes
1.7.1 Numerical summary characteristics
1.7.2 Functional summary characteristics
1.8 Secondary structures of point processes
1.8.1 Introduction
1.8.2 Random sets
1.8.3 Random fields
1.8.4 Tessellations
1.8.5 Neighbour networks or graphs
1.9 Simulation of point processes
2 The homogeneous Poisson point process
2.1 Introduction
2.2 The binomial point process
2.2.1 Introduction
2.2.2 Basic properties
2.2.3 The periodic binomial process
2.2.4 Simulation of the binomial process
2.3 The homogeneous Poisson point process
2.3.1 Introduction
2.3.2 Basic properties
2.3.3 Characterisations of the homogeneous Poisson process
2.4 Simulation of a homogeneous Poisson process
2.5 Model characteristics
2.5.1 Moments and moment measures
2.5.2 The Palm distribution of a homogeneous Poisson process
2.5.3 Summary characteristics of the homogeneous Poisson process
2.6 Estimating the intensity
2.7 Testing complete spatial randomness
2.7.1 Introduction
2.7.2 Quadrat counts
2.7.3 Distance methods
2.7.4 The J-test
2.7.5 Two index-based tests
2.7.6 Discrepancy tests
2.7.7 The L-test
2.7.8 Other tests and recommendations
3 Finite point processes
3.1 Introduction
3.2 Distributions of numbers of points
3.2.1 The binomial distribution
3.2.2 The Poisson distribution
3.2.3 Compound distributions
3.2.4 Generalised distributions
3.3 Intensity functions and their estimation
3.3.1 Parametric statistics for the intensity function
3.3.2 Non-parametric estimation of the intensity function
3.3.3 Estimating the point density distribution function
3.4 Inhomogeneous Poisson process and finite Cox process
3.4.1 The inhomogeneous Poisson process
3.4.2 The finite Cox process
3.5 Summary characteristics for finite point processes
3.5.1 Nearest-neighbour distances
3.5.2 Dilation function
3.5.3 Graph-theoretic statistics
3.5.4 Second-order characteristics
3.6 Finite Gibbs processes
3.6.1 Introduction
3.6.2 Gibbs processes with fixed number of points
3.6.3 Gibbs processes with a random number of points
3.6.4 Second-order summary characteristics of finite Gibbs processes
3.6.5 Further discussion
3.6.6 Statistical inference for finite Gibbs processes
4 Stationary point processes
4.1 Basic definitions and notation
4.2 Summary characteristics for stationary point processes
4.2.1 Introduction
4.2.2 Edge-correction methods
4.2.3 The intensity λ
4.2.4 Indices as summary characteristics
4.2.5 Empty-space statistics and other morphological summaries
4.2.6 The nearest-neighbour distance distribution function
4.2.7 The J-function
4.3 Second-order characteristics
4.3.1 The three functions: K, L and g
4.3.2 Theoretical foundations of second-order characteristics
4.3.3 Estimators of the second-order characteristics
4.3.4 Interpretation of pair correlation functions
4.4 Higher-order and topological characteristics
4.4.1 Introduction
4.4.2 Third-order characteristics
4.4.3 Delaunay tessellation characteristics
4.4.4 The connectivity function
4.5 Orientation analysis for stationary point processes
4.5.1 Introduction
4.5.2 Nearest-neighbour orientation distribution
4.5.3 Second-order orientation analysis
4.6 Outliers, gaps and residuals
4.6.1 Introduction
4.6.2 Simple outlier detection
4.6.3 Simple gap detection
4.6.4 Model-based outliers
4.6.5 Residuals
4.7 Replicated patterns
4.7.1 Introduction
4.7.2 Aggregation recipes
4.8 Choosing appropriate observation windows
4.8.1 General ideas
4.8.2 Representative windows
4.9 Multivariate analysis of series of point patterns
4.10 Summary characteristics for the non-stationary case
4.10.1 Formal application of stationary characteristics and estimators
4.10.2 Intensity reweighting
4.10.3 Local rescaling
5 Stationary marked point processes
5.1 Basic definitions and notation
5.1.1 Introduction
5.1.2 Marks and their properties
5.1.3 Marking models
5.1.4 Stationarity
5.1.5 First-order characteristics
5.1.6 Mark-sum measure
5.1.7 Palm distribution
5.2 Summary characteristics
5.2.1 Introduction
5.2.2 Intensity and mark-sum intensity
5.2.3 Mean mark, mark d.f. and mark probabilities
5.2.4 Indices for stationary marked point processes
5.2.5 Nearest-neighbour distributions
5.3 Second-order characteristics for marked point processes
5.3.1 Introduction
5.3.2 Definitions for qualitative marks
5.3.3 Definitions for quantitative marks
5.3.4 Estimation of second-order characteristics
5.4 Orientation analysis for marked point processes
5.4.1 Introduction
5.4.2 Orientation analysis for anisotropic processes with angular marks
5.4.3 Orientation analysis for isotropic processes with angular marks
5.4.4 Orientation analysis with constructed marks
6 Modelling and simulation of stationary point processes
6.1 Introduction
6.2 Operations with point processes
6.2.1 Thinning
6.2.2 Clustering
6.2.3 Superposition
6.3 Cluster processes
6.3.1 General cluster processes
6.3.2 Neyman–Scott processes
6.4 Stationary Cox processes
6.4.1 Introduction
6.4.2 Properties of stationary Cox processes
6.4.3 Statistics for Cox processes
6.5 Hard-core point processes
6.5.1 Introduction
6.5.2 Matérn hard-core processes
6.5.3 The dead leaves model
6.5.4 The RSA process
6.5.5 Random dense packings of hard spheres
6.6 Stationary Gibbs processes
6.6.1 Basic ideas and equations
6.6.2 Simulation of stationary Gibbs processes
6.6.3 Statistics for stationary Gibbs processes
6.7 Reconstruction of point patterns
6.7.1 Reconstructing point patterns without a specified model
6.7.2 An example: reconstruction of Neyman–Scott processes
6.7.3 Practical application of the reconstruction algorithm
6.8 Formulas for marked point process models
6.8.1 Introduction
6.8.2 Independent marks
6.8.3 Random field model
6.8.4 Intensity-weighted marks
6.9 Moment formulas for stationary shot-noise fields
6.10 Space–time point processes
6.10.1 Introduction
6.10.2 Space–time Poisson processes
6.10.3 Second-order statistics for completely stationary event processes
6.10.4 Two examples of space–time processes
6.11 Correlations between point processes and other random structures
6.11.1 Introduction
6.11.2 Correlations between point processes and random fields
6.11.3 Correlations between point processes and fibre processes
7 Fitting and testing point process models
7.1 Choice of model
7.2 Parameter estimation
7.2.1 Maximum likelihood method
7.2.2 Method of moments
7.2.3 Trial-and-error estimation
7.3 Variance estimation by bootstrap
7.4 Goodness-of-fit tests
7.4.1 Envelope test
7.4.2 Deviation test
7.5 Testing mark hypotheses
7.5.1 Introduction
7.5.2 Testing independent marking, test of association
7.5.3 Testing geostatistical marking
7.6 Bayesian methods for point pattern analysis
Appendix A Fundamentals of statistics
Appendix B Geometrical characteristics of sets
Appendix C Fundamentals of geostatistics
References
Notation index
Author index
Subject index




 2023年江西萍乡中考道德与法治真题及答案.doc
 2012年重庆南川中考生物真题及答案.doc
 2013年江西师范大学地理学综合及文艺理论基础考研真题.doc
 2020年四川甘孜小升初语文真题及答案I卷.doc
 2020年注册岩土工程师专业基础考试真题及答案.doc
 2023-2024学年福建省厦门市九年级上学期数学月考试题及答案.doc
 2021-2022学年辽宁省沈阳市大东区九年级上学期语文期末试题及答案.doc
 2022-2023学年北京东城区初三第一学期物理期末试卷及答案.doc
 2018上半年江西教师资格初中地理学科知识与教学能力真题及答案.doc
 2012年河北国家公务员申论考试真题及答案-省级.doc
 2020-2021学年江苏省扬州市江都区邵樊片九年级上学期数学第一次质量检测试题及答案.doc
 2022下半年黑龙江教师资格证中学综合素质真题及答案.doc