Berkshire’s Performance vs. the S&P 500
in Per-Share
Book Value of
Annual Percentage Change
in Per-Share
Market Value of
Year
1965 ...........................................................................
1966 ...........................................................................
1967 ...........................................................................
1968 ...........................................................................
1969 ...........................................................................
1970 ...........................................................................
1971 ...........................................................................
1972 ...........................................................................
1973 ...........................................................................
1974 ...........................................................................
1975 ...........................................................................
1976 ...........................................................................
1977 ...........................................................................
1978 ...........................................................................
1979 ...........................................................................
1980 ...........................................................................
1981 ...........................................................................
1982 ...........................................................................
1983 ...........................................................................
1984 ...........................................................................
1985 ...........................................................................
1986 ...........................................................................
1987 ...........................................................................
1988 ...........................................................................
1989 ...........................................................................
1990 ...........................................................................
1991 ...........................................................................
1992 ...........................................................................
1993 ...........................................................................
1994 ...........................................................................
1995 ...........................................................................
1996 ...........................................................................
1997 ...........................................................................
1998 ...........................................................................
1999 ...........................................................................
2000 ...........................................................................
2001 ...........................................................................
2002 ...........................................................................
2003 ...........................................................................
2004 ...........................................................................
2005 ...........................................................................
2006 ...........................................................................
2007 ...........................................................................
2008 ...........................................................................
2009 ...........................................................................
2010 ...........................................................................
2011 ...........................................................................
2012 ...........................................................................
2013 ...........................................................................
2014 ...........................................................................
2015 ...........................................................................
2016 ...........................................................................
Berkshire
23.8
20.3
11.0
19.0
16.2
12.0
16.4
21.7
4.7
5.5
21.9
59.3
31.9
24.0
35.7
19.3
31.4
40.0
32.3
13.6
48.2
26.1
19.5
20.1
44.4
7.4
39.6
20.3
14.3
13.9
43.1
31.8
34.1
48.3
0.5
6.5
(6.2)
10.0
21.0
10.5
6.4
18.4
11.0
(9.6)
19.8
13.0
4.6
14.4
18.2
8.3
6.4
10.7
Berkshire
49.5
(3.4)
13.3
77.8
19.4
(4.6)
80.5
8.1
(2.5)
(48.7)
2.5
129.3
46.8
14.5
102.5
32.8
31.8
38.4
69.0
(2.7)
93.7
14.2
4.6
59.3
84.6
(23.1)
35.6
29.8
38.9
25.0
57.4
6.2
34.9
52.2
(19.9)
26.6
6.5
(3.8)
15.8
4.3
0.8
24.1
28.7
(31.8)
2.7
21.4
(4.7)
16.8
32.7
27.0
(12.5)
23.4
in S&P 500
with Dividends
Included
10.0
(11.7)
30.9
11.0
(8.4)
3.9
14.6
18.9
(14.8)
(26.4)
37.2
23.6
(7.4)
6.4
18.2
32.3
(5.0)
21.4
22.4
6.1
31.6
18.6
5.1
16.6
31.7
(3.1)
30.5
7.6
10.1
1.3
37.6
23.0
33.4
28.6
21.0
(9.1)
(11.9)
(22.1)
28.7
10.9
4.9
15.8
5.5
(37.0)
26.5
15.1
2.1
16.0
32.4
13.7
1.4
12.0
Compounded Annual Gain – 1965-2016 ............................
Overall Gain – 1964-2016 ...............................................
19.0%
884,319%
20.8%
1,972,595%
9.7%
12,717%
Notes: Data are for calendar years with these exceptions: 1965 and 1966, year ended 9/30; 1967, 15 months ended 12/31. Starting in 1979,
accounting rules required insurance companies to value the equity securities they hold at market rather than at the lower of cost or market, which
was previously the requirement. In this table, Berkshire’s results through 1978 have been restated to conform to the changed rules. In all other
respects, the results are calculated using the numbers originally reported. The S&P 500 numbers are pre-tax whereas the Berkshire numbers are
after-tax. If a corporation such as Berkshire were simply to have owned the S&P 500 and accrued the appropriate taxes, its results would have
lagged the S&P 500 in years when that index showed a positive return, but would have exceeded the S&P 500 in years when the index showed a
negative return. Over the years, the tax costs would have caused the aggregate lag to be substantial.
2
�
BERKSHIRE HATHAWAY INC.
To the Shareholders of Berkshire Hathaway Inc.:
Berkshire’s gain in net worth during 2016 was $27.5 billion, which increased the per-share book value
of both our Class A and Class B stock by 10.7%. Over the last 52 years (that is, since present management took
over), per-share book value has grown from $19 to $172,108, a rate of 19% compounded annually.*
During the first half of those years, Berkshire’s net worth was roughly equal to the number that really
counts: the intrinsic value of the business. The similarity of the two figures existed then because most of our
resources were deployed in marketable securities that were regularly revalued to their quoted prices (less the tax
that would be incurred if they were to be sold). In Wall Street parlance, our balance sheet was then in very large
part “marked to market.”
By the early 1990s, however, our focus was changing to the outright ownership of businesses, a shift
that materially diminished the relevance of balance sheet figures. That disconnect occurred because the
accounting rules (commonly referred to as “GAAP”) that apply to companies we control differ in important ways
from those used to value marketable securities. Specifically, the accounting for businesses we own requires that
the carrying value of “losers” be written down when their failures become apparent. “Winners,” conversely, are
never revalued upwards.
We’ve experienced both outcomes: As is the case in marriage, business acquisitions often deliver
surprises after the “I do’s.” I’ve made some dumb purchases, paying far too much for the economic goodwill of
companies we acquired. That later led to goodwill write-offs and to consequent reductions in Berkshire’s book
value. We’ve also had some winners among the businesses we’ve purchased – a few of the winners very big –
but have not written those up by a penny.
We have no quarrel with the asymmetrical accounting that applies here. But, over time, it necessarily
widens the gap between Berkshire’s intrinsic value and its book value. Today, the large – and growing –
unrecorded gains at our winners produce an intrinsic value for Berkshire’s shares that far exceeds their book
value. The overage is truly huge in our property/casualty insurance business and significant also in many other
operations.
Over time, stock prices gravitate toward intrinsic value. That’s what has happened at Berkshire, a fact
explaining why the company’s 52-year market-price gain – shown on the facing page – materially exceeds its
book-value gain.
* All per-share figures used in this report apply to Berkshire’s A shares. Figures for the B shares are 1/1500th of
those shown for A.
3
�
What We Hope to Accomplish
Charlie Munger, Berkshire’s Vice Chairman and my partner, and I expect Berkshire’s normalized
earning power per share to increase every year. Actual earnings, of course, will sometimes decline because of
periodic weakness in the U.S. economy. In addition, insurance mega-catastrophes or other industry-specific
events may occasionally reduce earnings at Berkshire, even when most American businesses are doing well.
It’s our job, though, to over time deliver significant growth, bumpy or not. After all, as stewards of your
capital, Berkshire directors have opted to retain all earnings. Indeed, in both 2015 and 2016 Berkshire ranked
first among American businesses in the dollar volume of earnings retained, in each year reinvesting many
billions of dollars more than did the runner-up. Those reinvested dollars must earn their keep.
Some years, the gains in underlying earning power we achieve will be minor; very occasionally, the
cash register will ring loud. Charlie and I have no magic plan to add earnings except to dream big and to be
prepared mentally and financially to act fast when opportunities present themselves. Every decade or so, dark
clouds will fill the economic skies, and they will briefly rain gold. When downpours of that sort occur, it’s
imperative that we rush outdoors carrying washtubs, not teaspoons. And that we will do.
I earlier described our gradual shift from a company obtaining most of its gains from investment
activities to one that grows in value by owning businesses. Launching that transition, we took baby steps –
making small acquisitions whose impact on Berkshire’s profits was dwarfed by our gains from marketable
securities. Despite that cautious approach, I made one particularly egregious error, acquiring Dexter Shoe for
$434 million in 1993. Dexter’s value promptly went to zero. The story gets worse: I used stock for the purchase,
giving the sellers 25,203 shares of Berkshire that at yearend 2016 were worth more than $6 billion.
That wreck was followed by three key happenings – two positive, one negative – that set us firmly on
our present course. At the beginning of 1996, we acquired the half of GEICO we didn’t already own, a cash
transaction that changed our holding from a portfolio investment into a wholly-owned operating business.
GEICO, with its almost unlimited potential, quickly became the centerpiece around which we built what I believe
is now the world’s premier property/casualty business.
Unfortunately, I followed the GEICO purchase by foolishly using Berkshire stock – a boatload of
stock – to buy General Reinsurance in late 1998. After some early problems, General Re has become a fine
insurance operation that we prize. It was, nevertheless, a terrible mistake on my part to issue 272,200 shares of
Berkshire in buying General Re, an act that increased our outstanding shares by a whopping 21.8%. My error
caused Berkshire shareholders to give far more than they received (a practice that – despite the Biblical
endorsement – is far from blessed when you are buying businesses).
Early in 2000, I atoned for that folly by buying 76% (since grown to 90%) of MidAmerican Energy, a
brilliantly-managed utility business that has delivered us many large opportunities to make profitable and
socially-useful investments. The MidAmerican cash purchase – I was learning – firmly launched us on our
present course of (1) continuing to build our insurance operation; (2) energetically acquiring large and diversified
non-insurance businesses and (3) largely making our deals from internally-generated cash. (Today, I would rather
prep for a colonoscopy than issue Berkshire shares.)
Our portfolio of bonds and stocks, de-emphasized though it is, has continued in the post-1998 period to
grow and to deliver us hefty capital gains, interest, and dividends. Those portfolio earnings have provided us
major help in financing the purchase of businesses. Though unconventional, Berkshire’s two-pronged approach
to capital allocation gives us a real edge.
4
�
Here’s our financial record since 1999, when the redirection of our business began in earnest. During
the 18-year period covered, Berkshire’s outstanding shares grew by only 8.3%, with most of the increase
occurring when we purchased BNSF. That, I’m happy to say, was one issuance of stock that made good sense.
After-Tax Earnings
(in billions of dollars)
Year Operations (1)
Capital
Gains (2)
Year
Operations (1)
Capital
Gains (2)
1999
2000
2001
2002
2003
2004
2005
2006
2007
0.67
0.94
(0.13)
3.72
5.42
5.05
5.00
9.31
9.63
0.89
2.39
0.92
0.57
2.73
2.26
3.53
1.71
3.58
2008
2009
2010
2011
2012
2013
2014
2015
2016
9.64
7.57
11.09
10.78
12.60
15.14
16.55
17.36
17.57
(4.65)
0.49
1.87
(0.52)
2.23
4.34
3.32
6.73
6.50
(1)
Including interest and dividends from investments, but excluding capital gains or losses.
(2)
In very large part, this tabulation includes only realized capital gains or losses. Unrealized gains and
losses are also included, however, when GAAP requires that treatment.
Our expectation is that investment gains will continue to be substantial – though totally random as to
timing – and that these will supply significant funds for business purchases. Concurrently, Berkshire’s superb
corps of operating CEOs will focus on increasing earnings at the individual businesses they manage, sometimes
helping them to grow by making bolt-on acquisitions. By our avoiding the issuance of Berkshire stock, any
improvement in earnings will translate into equivalent per-share gains.
* * * * * * * * * * * *
Our efforts to materially increase the normalized earnings of Berkshire will be aided – as they have been
throughout our managerial tenure – by America’s economic dynamism. One word sums up our country’s
achievements: miraculous. From a standing start 240 years ago – a span of time less than triple my days on
earth – Americans have combined human ingenuity, a market system, a tide of talented and ambitious
immigrants, and the rule of law to deliver abundance beyond any dreams of our forefathers.
You need not be an economist to understand how well our system has worked. Just look around you.
See the 75 million owner-occupied homes, the bountiful farmland, the 260 million vehicles, the hyper-productive
factories, the great medical centers, the talent-filled universities, you name it – they all represent a net gain for
Americans from the barren lands, primitive structures and meager output of 1776. Starting from scratch, America
has amassed wealth totaling $90 trillion.
5
�
It’s true, of course, that American owners of homes, autos and other assets have often borrowed heavily
to finance their purchases. If an owner defaults, however, his or her asset does not disappear or lose its
usefulness. Rather, ownership customarily passes to an American lending institution that then disposes of it to an
American buyer. Our nation’s wealth remains intact. As Gertrude Stein put it, “Money is always there, but the
pockets change.”
Above all, it’s our market system – an economic traffic cop ably directing capital, brains and labor –
that has created America’s abundance. This system has also been the primary factor in allocating rewards.
Governmental redirection, through federal, state and local taxation, has in addition determined the distribution of
a significant portion of the bounty.
America has, for example, decided that those citizens in their productive years should help both the old
and the young. Such forms of aid – sometimes enshrined as “entitlements” – are generally thought of as applying
to the aged. But don’t forget that four million American babies are born each year with an entitlement to a public
education. That societal commitment, largely financed at the local level, costs about $150,000 per baby. The
annual cost totals more than $600 billion, which is about 3 1⁄2% of GDP.
However our wealth may be divided, the mind-boggling amounts you see around you belong almost
exclusively to Americans. Foreigners, of course, own or have claims on a modest portion of our wealth. Those
holdings, however, are of little importance to our national balance sheet: Our citizens own assets abroad that are
roughly comparable in value.
Early Americans, we should emphasize, were neither smarter nor more hard working than those people
who toiled century after century before them. But those venturesome pioneers crafted a system that unleashed
human potential, and their successors built upon it.
This economic creation will deliver increasing wealth to our progeny far into the future. Yes, the
build-up of wealth will be interrupted for short periods from time to time. It will not, however, be stopped. I’ll
repeat what I’ve both said in the past and expect to say in future years: Babies born in America today are the
luckiest crop in history.
* * * * * * * * * * * *
America’s economic achievements have led to staggering profits for stockholders. During the 20th
century the Dow-Jones Industrials advanced from 66 to 11,497, a 17,320% capital gain that was materially
boosted by steadily increasing dividends. The trend continues: By yearend 2016, the index had advanced a
further 72%, to 19,763.
American business – and consequently a basket of stocks – is virtually certain to be worth far more in
the years ahead. Innovation, productivity gains, entrepreneurial spirit and an abundance of capital will see to that.
Ever-present naysayers may prosper by marketing their gloomy forecasts. But heaven help them if they act on the
nonsense they peddle.
Many companies, of course, will fall behind, and some will fail. Winnowing of that sort is a product of
market dynamism. Moreover, the years ahead will occasionally deliver major market declines – even panics –
that will affect virtually all stocks. No one can tell you when these traumas will occur – not me, not Charlie, not
economists, not the media. Meg McConnell of the New York Fed aptly described the reality of panics: “We
spend a lot of time looking for systemic risk; in truth, however, it tends to find us.”
During such scary periods, you should never forget two things: First, widespread fear is your friend as
an investor, because it serves up bargain purchases. Second, personal fear is your enemy. It will also be
unwarranted. Investors who avoid high and unnecessary costs and simply sit for an extended period with a
collection of large, conservatively-financed American businesses will almost certainly do well.
As for Berkshire, our size precludes a brilliant result: Prospective returns fall as assets increase.
Nonetheless, Berkshire’s collection of good businesses, along with the company’s impregnable financial strength
and owner-oriented culture, should deliver decent results. We won’t be satisfied with less.
6
�
Share Repurchases
In the investment world, discussions about share repurchases often become heated. But I’d suggest that
participants in this debate take a deep breath: Assessing the desirability of repurchases isn’t that complicated.
From the standpoint of exiting shareholders, repurchases are always a plus. Though the day-to-day impact of
these purchases is usually minuscule, it’s always better for a seller to have an additional buyer in the market.
For continuing shareholders, however, repurchases only make sense if the shares are bought at a price
below intrinsic value. When that rule is followed, the remaining shares experience an immediate gain in intrinsic
value. Consider a simple analogy: If there are three equal partners in a business worth $3,000 and one is bought
out by the partnership for $900, each of the remaining partners realizes an immediate gain of $50. If the exiting
partner is paid $1,100, however, the continuing partners each suffer a loss of $50. The same math applies with
corporations and their shareholders. Ergo, the question of whether a repurchase action is value-enhancing or
value-destroying for continuing shareholders is entirely purchase-price dependent.
It is puzzling, therefore, that corporate repurchase announcements almost never refer to a price above
which repurchases will be eschewed. That certainly wouldn’t be the case if a management was buying an outside
business. There, price would always factor into a buy-or-pass decision.
When CEOs or boards are buying a small part of their own company, though, they all too often seem
oblivious to price. Would they behave similarly if they were managing a private company with just a few owners
and were evaluating the wisdom of buying out one of them? Of course not.
It is important to remember that there are two occasions in which repurchases should not take place,
even if the company’s shares are underpriced. One is when a business both needs all its available money to
protect or expand its own operations and is also uncomfortable adding further debt. Here, the internal need for
funds should take priority. This exception assumes, of course, that the business has a decent future awaiting it
after the needed expenditures are made.
The second exception, less common, materializes when a business acquisition (or some other investment
opportunity) offers far greater value than do the undervalued shares of the potential repurchaser. Long ago,
Berkshire itself often had to choose between these alternatives. At our present size, the issue is far less likely to
arise.
My suggestion: Before even discussing repurchases, a CEO and his or her Board should stand, join
hands and in unison declare, “What is smart at one price is stupid at another.”
* * * * * * * * * * * *
To recap Berkshire’s own repurchase policy: I am authorized to buy large amounts of Berkshire shares at
120% or less of book value because our Board has concluded that purchases at that level clearly bring an instant and
material benefit to continuing shareholders. By our estimate, a 120%-of-book price is a significant discount to
Berkshire’s intrinsic value, a spread that is appropriate because calculations of intrinsic value can’t be precise.
The authorization given me does not mean that we will “prop” our stock’s price at the 120% ratio. If
that level is reached, we will instead attempt to blend a desire to make meaningful purchases at a value-creating
price with a related goal of not over-influencing the market.
To date, repurchasing our shares has proved hard to do. That may well be because we have been clear in
describing our repurchase policy and thereby have signaled our view that Berkshire’s intrinsic value is
significantly higher than 120% of book value. If so, that’s fine. Charlie and I prefer to see Berkshire shares sell in
a fairly narrow range around intrinsic value, neither wishing them to sell at an unwarranted high price – it’s no
fun having owners who are disappointed with their purchases – nor one too low. Furthermore, our buying out
“partners” at a discount is not a particularly gratifying way of making money. Still, market circumstances could
create a situation in which repurchases would benefit both continuing and exiting shareholders. If so, we will be
ready to act.
7
�
One final observation for this section: As the subject of repurchases has come to a boil, some people
have come close to calling them un-American – characterizing them as corporate misdeeds that divert funds
needed for productive endeavors. That simply isn’t the case: Both American corporations and private investors
are today awash in funds looking to be sensibly deployed. I’m not aware of any enticing project that in recent
years has died for lack of capital. (Call us if you have a candidate.)
Insurance
Let’s now look at Berkshire’s various businesses, starting with our most important sector, insurance.
The property/casualty (“P/C”) branch of that industry has been the engine that has propelled our growth since
1967, the year we acquired National Indemnity and its sister company, National Fire & Marine, for $8.6 million.
Today, National Indemnity is the largest property/casualty company in the world as measured by net worth.
One reason we were attracted to the P/C business was its financial characteristics: P/C insurers receive
premiums upfront and pay claims later. In extreme cases, such as claims arising from exposure to asbestos,
payments can stretch over many decades. This collect-now, pay-later model leaves P/C companies holding large
sums – money we call “float” – that will eventually go to others. Meanwhile, insurers get to invest this float for
their own benefit. Though individual policies and claims come and go, the amount of float an insurer holds
usually remains fairly stable in relation to premium volume. Consequently, as our business grows, so does our
float. And how it has grown, as the following table shows:
Year
1970
1980
1990
2000
2010
2016
Float (in millions)
$
39
237
1,632
27,871
65,832
91,577
We recently wrote a huge policy that increased float to more than $100 billion. Beyond that one-time
boost, float at GEICO and several of our specialized operations is almost certain to grow at a good clip. National
Indemnity’s reinsurance division, however, is party to a number of large run-off contracts whose float is certain
to drift downward.
We may in time experience a decline in float. If so, the decline will be very gradual – at the outside no
more than 3% in any year. The nature of our insurance contracts is such that we can never be subject to
immediate or near-term demands for sums that are of significance to our cash resources. This structure is by
design and is a key component in the unequaled financial strength of our insurance companies. It will never be
compromised.
If our premiums exceed the total of our expenses and eventual losses, our insurance operation registers
an underwriting profit that adds to the investment income the float produces. When such a profit is earned, we
enjoy the use of free money – and, better yet, get paid for holding it.
Unfortunately, the wish of all insurers to achieve this happy result creates intense competition, so
vigorous indeed that it sometimes causes the P/C industry as a whole to operate at a significant underwriting loss.
This loss, in effect, is what the industry pays to hold its float. Competitive dynamics almost guarantee that the
insurance industry, despite the float income all its companies enjoy, will continue its dismal record of earning
subnormal returns on tangible net worth as compared to other American businesses.
8
�
This outcome is made more certain by the dramatically lower interest rates that now exist throughout the
world. The investment portfolios of almost all P/C companies – though not those of Berkshire – are heavily
concentrated in bonds. As these high-yielding legacy investments mature and are replaced by bonds yielding a
pittance, earnings from float will steadily fall. For that reason, and others as well, it’s a good bet that industry
results over the next ten years will fall short of those recorded in the past decade, particularly in the case of
companies that specialize in reinsurance.
Nevertheless, I very much like our own prospects. Berkshire’s unrivaled financial strength allows us far
more flexibility in investing than that generally available to P/C companies. The many alternatives available to us
are always an advantage; occasionally, they offer us major opportunities. When others are constrained, our
choices expand.
Moreover, our P/C companies have an excellent underwriting record. Berkshire has now operated at an
underwriting profit for 14 consecutive years, our pre-tax gain for the period having totaled $28 billion. That
record is no accident: Disciplined risk evaluation is the daily focus of all of our insurance managers, who know
that while float is valuable, its benefits can be drowned by poor underwriting results. All insurers give that
message lip service. At Berkshire it is a religion, Old Testament style.
So how does our float affect intrinsic value? When Berkshire’s book value is calculated, the full amount
of our float is deducted as a liability, just as if we had to pay it out tomorrow and could not replenish it. But to
think of float as a typical liability is a major mistake. It should instead be viewed as a revolving fund. Daily, we
pay old claims and related expenses – a huge $27 billion to more than six million claimants in 2016 – and that
reduces float. Just as surely, we each day write new business that will soon generate its own claims, adding to
float.
If our revolving float is both costless and long-enduring, which I believe it will be, the true value of this
liability is dramatically less than the accounting liability. Owing $1 that in effect will never leave the premises –
because new business is almost certain to deliver a substitute – is worlds different from owing $1 that will go out
the door tomorrow and not be replaced. The two types of liabilities, however, are treated as equals under GAAP.
A partial offset to this overstated liability is a $15.5 billion “goodwill” asset that we incurred in buying
our insurance companies and that is included in our book-value figure. In very large part, this goodwill represents
the price we paid for the float-generating capabilities of our insurance operations. The cost of the goodwill,
however, has no bearing on its true value. For example, if an insurance company sustains large and prolonged
underwriting losses, any goodwill asset carried on the books should be deemed valueless, whatever its original
cost.
Fortunately, that does not describe Berkshire. Charlie and I believe the true economic value of our
insurance goodwill – what we would happily pay for float of similar quality were we to purchase an insurance
operation possessing it – to be far in excess of its historic carrying value. Indeed, almost the entire $15.5 billion
we carry for goodwill in our insurance business was already on our books in 2000 when float was $28 billion.
Yet we have subsequently increased our float by $64 billion, a gain that in no way is reflected in our book value.
This unrecorded asset is one reason – a huge reason – why we believe Berkshire’s intrinsic business value far
exceeds its book value.
* * * * * * * * * * * *
Berkshire’s attractive insurance economics exist only because we have some terrific managers running
disciplined operations that in most cases possess hard-to-replicate business models. Let me tell you about the
major units.
First by float size is the Berkshire Hathaway Reinsurance Group, managed by Ajit Jain. Ajit insures
risks that no one else has the desire or the capital to take on. His operation combines capacity, speed,
decisiveness and, most important, brains in a manner unique in the insurance business. Yet he never exposes
Berkshire to risks that are inappropriate in relation to our resources.
9
�


 2025年软考高级信息系统项目管理师金色考点
 软考高项三色笔记
 镇安县双鑫矿业月河年处理15万吨尾渣综合加工利用项目水土保持报告表
  红杉资本:生成式AI最新市场格局.pdf
 wireshark 使用教程.pdf
 【2021年-贝佐斯致股东的信】.pdf
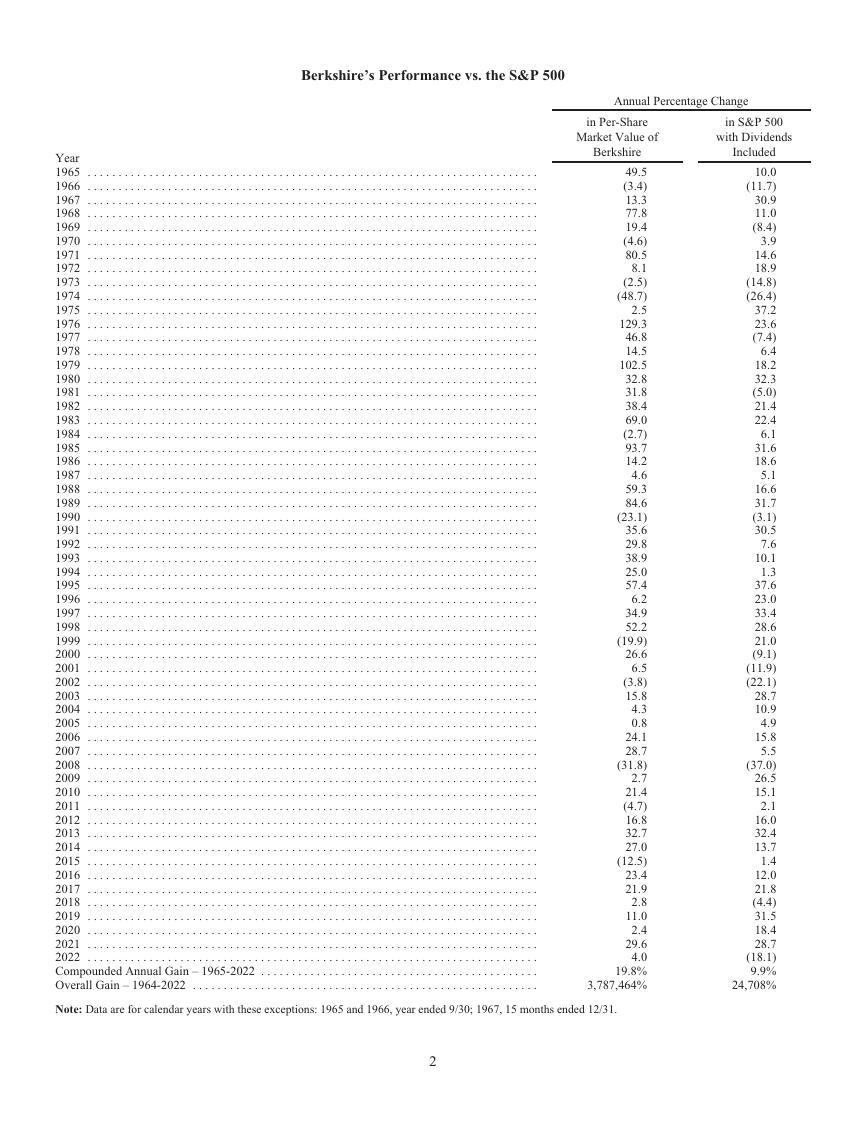 巴菲特致股东的公开信 - 2022.pdf
 MySQL 8.1 参考手册.pdf
 世界银行报告下载:激进政策缩紧浪潮不足遏制通胀 全球经济衰退迫在眉睫(Is a Global Recession Imminent?).pdf
 红杉资本报告:适应与忍耐(Adapting to Endure).pdf
 高保真音响系统设计制作-毕业论文.doc
 一种自适应互补滤波姿态估计算法.pdf