Berkshire’s Corporate Performance vs. the S&P 500
Annual Percentage Change
in S&P 500
in Per-Share
Book Value of
Berkshire
with Dividends
Included
(2)
10.0
(11.7)
30.9
11.0
(8.4)
3.9
14.6
18.9
(14.8)
(26.4)
37.2
23.6
(7.4)
6.4
18.2
32.3
(5.0)
21.4
22.4
6.1
31.6
18.6
5.1
16.6
31.7
(3.1)
30.5
7.6
10.1
1.3
37.6
23.0
33.4
28.6
21.0
(9.1)
(11.9)
(22.1)
28.7
10.9
4.9
15.8
5.5
(37.0)
26.5
15.1
2.1
16.0
Relative
Results
(1)-(2)
13.8
32.0
(19.9)
8.0
24.6
8.1
1.8
2.8
19.5
31.9
(15.3)
35.7
39.3
17.6
17.5
(13.0)
36.4
18.6
9.9
7.5
16.6
7.5
14.4
3.5
12.7
10.5
9.1
12.7
4.2
12.6
5.5
8.8
0.7
19.7
(20.5)
15.6
5.7
32.1
(7.7)
(0.4)
1.5
2.6
5.5
27.4
(6.7)
(2.1)
2.5
(1.6)
10.3
Year
1965 . . . . . . . . . . . . . . . . . . . . . . . . . . . . . . . . . . . . . . . . . . . . . . . . . . . . . . . .
1966 . . . . . . . . . . . . . . . . . . . . . . . . . . . . . . . . . . . . . . . . . . . . . . . . . . . . . . . .
1967 . . . . . . . . . . . . . . . . . . . . . . . . . . . . . . . . . . . . . . . . . . . . . . . . . . . . . . . .
1968 . . . . . . . . . . . . . . . . . . . . . . . . . . . . . . . . . . . . . . . . . . . . . . . . . . . . . . . .
1969 . . . . . . . . . . . . . . . . . . . . . . . . . . . . . . . . . . . . . . . . . . . . . . . . . . . . . . . .
1970 . . . . . . . . . . . . . . . . . . . . . . . . . . . . . . . . . . . . . . . . . . . . . . . . . . . . . . . .
1971 . . . . . . . . . . . . . . . . . . . . . . . . . . . . . . . . . . . . . . . . . . . . . . . . . . . . . . . .
1972 . . . . . . . . . . . . . . . . . . . . . . . . . . . . . . . . . . . . . . . . . . . . . . . . . . . . . . . .
1973 . . . . . . . . . . . . . . . . . . . . . . . . . . . . . . . . . . . . . . . . . . . . . . . . . . . . . . . .
1974 . . . . . . . . . . . . . . . . . . . . . . . . . . . . . . . . . . . . . . . . . . . . . . . . . . . . . . . .
1975 . . . . . . . . . . . . . . . . . . . . . . . . . . . . . . . . . . . . . . . . . . . . . . . . . . . . . . . .
1976 . . . . . . . . . . . . . . . . . . . . . . . . . . . . . . . . . . . . . . . . . . . . . . . . . . . . . . . .
1977 . . . . . . . . . . . . . . . . . . . . . . . . . . . . . . . . . . . . . . . . . . . . . . . . . . . . . . . .
1978 . . . . . . . . . . . . . . . . . . . . . . . . . . . . . . . . . . . . . . . . . . . . . . . . . . . . . . . .
1979 . . . . . . . . . . . . . . . . . . . . . . . . . . . . . . . . . . . . . . . . . . . . . . . . . . . . . . . .
1980 . . . . . . . . . . . . . . . . . . . . . . . . . . . . . . . . . . . . . . . . . . . . . . . . . . . . . . . .
1981 . . . . . . . . . . . . . . . . . . . . . . . . . . . . . . . . . . . . . . . . . . . . . . . . . . . . . . . .
1982 . . . . . . . . . . . . . . . . . . . . . . . . . . . . . . . . . . . . . . . . . . . . . . . . . . . . . . . .
1983 . . . . . . . . . . . . . . . . . . . . . . . . . . . . . . . . . . . . . . . . . . . . . . . . . . . . . . . .
1984 . . . . . . . . . . . . . . . . . . . . . . . . . . . . . . . . . . . . . . . . . . . . . . . . . . . . . . . .
1985 . . . . . . . . . . . . . . . . . . . . . . . . . . . . . . . . . . . . . . . . . . . . . . . . . . . . . . . .
1986 . . . . . . . . . . . . . . . . . . . . . . . . . . . . . . . . . . . . . . . . . . . . . . . . . . . . . . . .
1987 . . . . . . . . . . . . . . . . . . . . . . . . . . . . . . . . . . . . . . . . . . . . . . . . . . . . . . . .
1988 . . . . . . . . . . . . . . . . . . . . . . . . . . . . . . . . . . . . . . . . . . . . . . . . . . . . . . . .
1989 . . . . . . . . . . . . . . . . . . . . . . . . . . . . . . . . . . . . . . . . . . . . . . . . . . . . . . . .
1990 . . . . . . . . . . . . . . . . . . . . . . . . . . . . . . . . . . . . . . . . . . . . . . . . . . . . . . . .
1991 . . . . . . . . . . . . . . . . . . . . . . . . . . . . . . . . . . . . . . . . . . . . . . . . . . . . . . . .
1992 . . . . . . . . . . . . . . . . . . . . . . . . . . . . . . . . . . . . . . . . . . . . . . . . . . . . . . . .
1993 . . . . . . . . . . . . . . . . . . . . . . . . . . . . . . . . . . . . . . . . . . . . . . . . . . . . . . . .
1994 . . . . . . . . . . . . . . . . . . . . . . . . . . . . . . . . . . . . . . . . . . . . . . . . . . . . . . . .
1995 . . . . . . . . . . . . . . . . . . . . . . . . . . . . . . . . . . . . . . . . . . . . . . . . . . . . . . . .
1996 . . . . . . . . . . . . . . . . . . . . . . . . . . . . . . . . . . . . . . . . . . . . . . . . . . . . . . . .
1997 . . . . . . . . . . . . . . . . . . . . . . . . . . . . . . . . . . . . . . . . . . . . . . . . . . . . . . . .
1998 . . . . . . . . . . . . . . . . . . . . . . . . . . . . . . . . . . . . . . . . . . . . . . . . . . . . . . . .
1999 . . . . . . . . . . . . . . . . . . . . . . . . . . . . . . . . . . . . . . . . . . . . . . . . . . . . . . . .
2000 . . . . . . . . . . . . . . . . . . . . . . . . . . . . . . . . . . . . . . . . . . . . . . . . . . . . . . . .
2001 . . . . . . . . . . . . . . . . . . . . . . . . . . . . . . . . . . . . . . . . . . . . . . . . . . . . . . . .
2002 . . . . . . . . . . . . . . . . . . . . . . . . . . . . . . . . . . . . . . . . . . . . . . . . . . . . . . . .
2003 . . . . . . . . . . . . . . . . . . . . . . . . . . . . . . . . . . . . . . . . . . . . . . . . . . . . . . . .
2004 . . . . . . . . . . . . . . . . . . . . . . . . . . . . . . . . . . . . . . . . . . . . . . . . . . . . . . . .
2005 . . . . . . . . . . . . . . . . . . . . . . . . . . . . . . . . . . . . . . . . . . . . . . . . . . . . . . . .
2006 . . . . . . . . . . . . . . . . . . . . . . . . . . . . . . . . . . . . . . . . . . . . . . . . . . . . . . . .
2007 . . . . . . . . . . . . . . . . . . . . . . . . . . . . . . . . . . . . . . . . . . . . . . . . . . . . . . . .
2008 . . . . . . . . . . . . . . . . . . . . . . . . . . . . . . . . . . . . . . . . . . . . . . . . . . . . . . . .
2009 . . . . . . . . . . . . . . . . . . . . . . . . . . . . . . . . . . . . . . . . . . . . . . . . . . . . . . . .
2010 . . . . . . . . . . . . . . . . . . . . . . . . . . . . . . . . . . . . . . . . . . . . . . . . . . . . . . . .
2011 . . . . . . . . . . . . . . . . . . . . . . . . . . . . . . . . . . . . . . . . . . . . . . . . . . . . . . . .
2012 . . . . . . . . . . . . . . . . . . . . . . . . . . . . . . . . . . . . . . . . . . . . . . . . . . . . . . . .
(1)
23.8
20.3
11.0
19.0
16.2
12.0
16.4
21.7
4.7
5.5
21.9
59.3
31.9
24.0
35.7
19.3
31.4
40.0
32.3
13.6
48.2
26.1
19.5
20.1
44.4
7.4
39.6
20.3
14.3
13.9
43.1
31.8
34.1
48.3
0.5
6.5
(6.2)
10.0
21.0
10.5
6.4
18.4
11.0
(9.6)
19.8
13.0
4.6
14.4
Compounded Annual Gain – 1965-2012 . . . . . . . . . . . . . . . . . . . . . . . . . . .
Overall Gain – 1964-2012 . . . . . . . . . . . . . . . . . . . . . . . . . . . . . . . . . . . . . . .
19.7%
586,817%
9.4%
7,433%
Notes: Data are for calendar years with these exceptions: 1965 and 1966, year ended 9/30; 1967, 15 months ended
12/31. Starting in 1979, accounting rules required insurance companies to value the equity securities they hold at
market rather than at the lower of cost or market, which was previously the requirement. In this table, Berkshire’s
results through 1978 have been restated to conform to the changed rules. In all other respects, the results are calculated
using the numbers originally reported. The S&P 500 numbers are pre-tax whereas the Berkshire numbers are after-
tax. If a corporation such as Berkshire were simply to have owned the S&P 500 and accrued the appropriate taxes, its
results would have lagged the S&P 500 in years when that index showed a positive return, but would have exceeded the
S&P 500 in years when the index showed a negative return. Over the years, the tax costs would have caused the
aggregate lag to be substantial.
2
�
BERKSHIRE HATHAWAY INC.
To the Shareholders of Berkshire Hathaway Inc.:
In 2012, Berkshire achieved a total gain for its shareholders of $24.1 billion. We used $1.3 billion of that
to repurchase our stock, which left us with an increase in net worth of $22.8 billion for the year. The per-share book
value of both our Class A and Class B stock increased by 14.4%. Over the last 48 years (that is, since present
management took over), book value has grown from $19 to $114,214, a rate of 19.7% compounded annually.*
A number of good things happened at Berkshire last year, but let’s first get the bad news out of the way.
Š When the partnership I ran took control of Berkshire in 1965, I could never have dreamed that a year in
which we had a gain of $24.1 billion would be subpar, in terms of the comparison we present on the facing
page.
But subpar it was. For the ninth time in 48 years, Berkshire’s percentage increase in book value was less
than the S&P’s percentage gain (a calculation that includes dividends as well as price appreciation). In
eight of those nine years, it should be noted, the S&P had a gain of 15% or more. We do better when the
wind is in our face.
To date, we’ve never had a five-year period of underperformance, having managed 43 times to surpass the
S&P over such a stretch. (The record is on page 103.) But the S&P has now had gains in each of the last
four years, outpacing us over that period. If the market continues to advance in 2013, our streak of five-
year wins will end.
One thing of which you can be certain: Whatever Berkshire’s results, my partner Charlie Munger, the
company’s Vice Chairman, and I will not change yardsticks. It’s our job to increase intrinsic business
value – for which we use book value as a significantly understated proxy – at a faster rate than the market
gains of the S&P. If we do so, Berkshire’s share price, though unpredictable from year to year, will itself
outpace the S&P over time. If we fail, however, our management will bring no value to our investors, who
themselves can earn S&P returns by buying a low-cost index fund.
Charlie and I believe the gain in Berkshire’s intrinsic value will over time likely surpass the S&P returns by
a small margin. We’re confident of that because we have some outstanding businesses, a cadre of terrific
operating managers and a shareholder-oriented culture. Our relative performance, however, is almost
certain to be better when the market is down or flat. In years when the market is particularly strong, expect
us to fall short.
Š
The second disappointment in 2012 was my inability to make a major acquisition. I pursued a couple of
elephants, but came up empty-handed.
* All per-share figures used in this report apply to Berkshire’s A shares. Figures for the B shares are
1/1500th of those shown for A.
3
�
Our luck, however, changed early this year. In February, we agreed to buy 50% of a holding company that
will own all of H. J. Heinz. The other half will be owned by a small group of investors led by Jorge Paulo
Lemann, a renowned Brazilian businessman and philanthropist.
We couldn’t be in better company. Jorge Paulo is a long-time friend of mine and an extraordinary
manager. His group and Berkshire will each contribute about $4 billion for common equity in the holding
company. Berkshire will also invest $8 billion in preferred shares that pay a 9% dividend. The preferred
has two other features that materially increase its value: at some point it will be redeemed at a significant
premium price and the preferred also comes with warrants permitting us to buy 5% of the holding
company’s common stock for a nominal sum.
Our total investment of about $12 billion soaks up much of what Berkshire earned last year. But we still
have plenty of cash and are generating more at a good clip. So it’s back to work; Charlie and I have again
donned our safari outfits and resumed our search for elephants.
Now to some good news from 2012:
Š
Last year I told you that BNSF, Iscar, Lubrizol, Marmon Group and MidAmerican Energy – our five most
profitable non-insurance companies – were likely to earn more than $10 billion pre-tax in 2012. They
delivered. Despite tepid U.S. growth and weakening economies throughout much of the world, our
“powerhouse five” had aggregate earnings of $10.1 billion, about $600 million more than in 2011.
Of this group, only MidAmerican, then earning $393 million pre-tax, was owned by Berkshire eight years
ago. Subsequently, we purchased another three of the five on an all-cash basis. In acquiring the fifth,
BNSF, we paid about 70% of the cost in cash, and for the remainder, issued shares that increased the
amount outstanding by 6.1%. Consequently, the $9.7 billion gain in annual earnings delivered Berkshire
by the five companies has been accompanied by only minor dilution. That satisfies our goal of not simply
growing, but rather increasing per-share results.
Unless the U.S. economy tanks – which we don’t expect – our powerhouse five should again deliver higher
earnings in 2013. The five outstanding CEOs who run them will see to that.
Š
Though I failed to land a major acquisition in 2012, the managers of our subsidiaries did far better. We had
a record year for “bolt-on” purchases, spending about $2.3 billion for 26 companies that were melded into
our existing businesses. These transactions were completed without Berkshire issuing any shares.
Charlie and I love these acquisitions: Usually they are low-risk, burden headquarters not at all, and expand
the scope of our proven managers.
Š Our insurance operations shot the lights out last year. While giving Berkshire $73 billion of free money to
invest, they also delivered a $1.6 billion underwriting gain, the tenth consecutive year of profitable
underwriting. This is truly having your cake and eating it too.
GEICO led the way, continuing to gobble up market share without sacrificing underwriting discipline.
Since 1995, when we obtained control, GEICO’s share of the personal-auto market has grown from 2.5% to
9.7%. Premium volume meanwhile increased from $2.8 billion to $16.7 billion. Much more growth lies
ahead.
The credit for GEICO’s extraordinary performance goes to Tony Nicely and his 27,000 associates. And to
that cast, we should add our Gecko. Neither rain nor storm nor gloom of night can stop him; the little lizard
just soldiers on, telling Americans how they can save big money by going to GEICO.com.
When I count my blessings, I count GEICO twice.
4
�
Š
Š
Š
Š
Todd Combs and Ted Weschler, our new investment managers, have proved to be smart, models of
integrity, helpful to Berkshire in many ways beyond portfolio management, and a perfect cultural fit. We
hit the jackpot with these two. In 2012 each outperformed the S&P 500 by double-digit margins. They left me in
the dust as well.
Consequently, we have increased the funds managed by each to almost $5 billion (some of this emanating
from the pension funds of our subsidiaries). Todd and Ted are young and will be around to manage
Berkshire’s massive portfolio long after Charlie and I have left the scene. You can rest easy when they
take over.
Berkshire’s yearend employment totaled a record 288,462 (see page 106 for details), up 17,604 from last
year. Our headquarters crew, however, remained unchanged at 24. No sense going crazy.
Berkshire’s “Big Four” investments – American Express, Coca-Cola, IBM and Wells Fargo – all had good
years. Our ownership interest in each of these companies increased during the year. We purchased
additional shares of Wells Fargo (our ownership now is 8.7% versus 7.6% at yearend 2011) and IBM (6.0%
versus 5.5%). Meanwhile, stock repurchases at Coca-Cola and American Express raised our percentage
ownership. Our equity in Coca-Cola grew from 8.8% to 8.9% and our interest at American Express from
13.0% to 13.7%.
Berkshire’s ownership interest in all four companies is likely to increase in the future. Mae West had it
right: “Too much of a good thing can be wonderful.”
The four companies possess marvelous businesses and are run by managers who are both talented and
shareholder-oriented. At Berkshire we much prefer owning a non-controlling but substantial portion of a
wonderful business to owning 100% of a so-so business. Our flexibility in capital allocation gives us a
significant advantage over companies that limit themselves only to acquisitions they can operate.
Going by our yearend share count, our portion of the “Big Four’s” 2012 earnings amounted to $3.9 billion.
In the earnings we report to you, however, we include only the dividends we receive – about $1.1 billion.
But make no mistake: The $2.8 billion of earnings we do not report is every bit as valuable to us as what
we record.
The earnings that the four companies retain are often used for repurchases – which enhance our share of
future earnings – and also for funding business opportunities that are usually advantageous. Over time we
expect substantially greater earnings from these four investees. If we are correct, dividends to Berkshire
will increase and, even more important, so will our unrealized capital gains (which, for the four, totaled
$26.7 billion at yearend).
There was a lot of hand-wringing last year among CEOs who cried “uncertainty” when faced with capital-
allocation decisions (despite many of their businesses having enjoyed record levels of both earnings and
cash). At Berkshire, we didn’t share their fears, instead spending a record $9.8 billion on plant and
equipment in 2012, about 88% of it in the United States. That’s 19% more than we spent in 2011, our
previous high. Charlie and I love investing large sums in worthwhile projects, whatever the pundits are
saying. We instead heed the words from Gary Allan’s new country song, “Every Storm Runs Out of Rain.”
We will keep our foot to the floor and will almost certainly set still another record for capital expenditures
in 2013. Opportunities abound in America.
A thought for my fellow CEOs: Of course, the immediate future is uncertain; America has faced the
unknown since 1776. It’s just that sometimes people focus on the myriad of uncertainties that always exist
while at other times they ignore them (usually because the recent past has been uneventful).
* * * * * * * * * * * *
5
�
American business will do fine over time. And stocks will do well just as certainly, since their fate is tied
to business performance. Periodic setbacks will occur, yes, but investors and managers are in a game that
is heavily stacked in their favor. (The Dow Jones Industrials advanced from 66 to 11,497 in the 20th
Century, a staggering 17,320% increase that materialized despite four costly wars, a Great Depression and
many recessions. And don’t forget that shareholders received substantial dividends throughout the century
as well.)
Since the basic game is so favorable, Charlie and I believe it’s a terrible mistake to try to dance in and out
of it based upon the turn of tarot cards, the predictions of “experts,” or the ebb and flow of business
activity. The risks of being out of the game are huge compared to the risks of being in it.
My own history provides a dramatic example: I made my first stock purchase in the spring of 1942 when
the U.S. was suffering major losses throughout the Pacific war zone. Each day’s headlines told of more
setbacks. Even so, there was no talk about uncertainty; every American I knew believed we would prevail.
The country’s success since that perilous time boggles the mind: On an inflation-adjusted basis, GDP per
capita more than quadrupled between 1941 and 2012. Throughout that period, every tomorrow has been
uncertain. America’s destiny, however, has always been clear: ever-increasing abundance.
If you are a CEO who has some large, profitable project you are shelving because of short-term worries,
call Berkshire. Let us unburden you.
* * * * * * * * * * * *
In summary, Charlie and I hope to build per-share intrinsic value by (1) improving the earning power of our
many subsidiaries; (2) further increasing their earnings through bolt-on acquisitions; (3) participating in the growth
of our investees; (4) repurchasing Berkshire shares when they are available at a meaningful discount from intrinsic
value; and (5) making an occasional large acquisition. We will also try to maximize results for you by rarely, if
ever, issuing Berkshire shares.
Those building blocks rest on a rock-solid foundation. A century hence, BNSF and MidAmerican Energy
will continue to play major roles in the American economy. Insurance, moreover, will always be essential for both
businesses and individuals – and no company brings greater resources to that arena than Berkshire. As we view
these and other strengths, Charlie and I like your company’s prospects.
Intrinsic Business Value
As much as Charlie and I talk about intrinsic business value, we cannot tell you precisely what that number
is for Berkshire shares (or, for that matter, any other stock). In our 2010 annual report, however, we laid out the
three elements – one of which was qualitative – that we believe are the keys to a sensible estimate of Berkshire’s
intrinsic value. That discussion is reproduced in full on pages 104-105.
Here is an update of the two quantitative factors: In 2012 our per-share investments increased 15.7% to
$113,786, and our per-share pre-tax earnings from businesses other than insurance and investments also increased
15.7% to $8,085.
Since 1970, our per-share investments have increased at a rate of 19.4% compounded annually, and our
per-share earnings figure has grown at a 20.8% clip. It is no coincidence that the price of Berkshire stock over the
42-year period has increased at a rate very similar to that of our two measures of value. Charlie and I like to see
gains in both areas, but our strong emphasis will always be on building operating earnings.
Now, let’s examine the four major sectors of our operations. Each has vastly different balance sheet and
income characteristics from the others. Lumping them together therefore impedes analysis. So we’ll present them
as four separate businesses, which is how Charlie and I view them.
* * * * * * * * * * * *
6
�
Insurance
Let’s look first at insurance, Berkshire’s core operation and the engine that has propelled our expansion
over the years.
Property-casualty (“P/C”) insurers receive premiums upfront and pay claims later. In extreme cases, such
as those arising from certain workers’ compensation accidents, payments can stretch over decades. This collect-
now, pay-later model leaves us holding large sums – money we call “float” – that will eventually go to others.
Meanwhile, we get to invest this float for Berkshire’s benefit. Though individual policies and claims come and go,
the amount of float we hold remains quite stable in relation to premium volume. Consequently, as our business
grows, so does our float. And how we have grown, as the following table shows:
Year
1970
1980
1990
2000
2010
2012
Float (in $ millions)
$
39
237
1,632
27,871
65,832
73,125
Last year I told you that our float was likely to level off or even decline a bit in the future. Our insurance
CEOs set out to prove me wrong and did, increasing float last year by $2.5 billion. I now expect a further increase
in 2013. But further gains will be tough to achieve. On the plus side, GEICO’s float will almost certainly grow. In
National Indemnity’s reinsurance division, however, we have a number of run-off contracts whose float drifts
downward. If we do experience a decline in float at some future time, it will be very gradual – at the outside no
more than 2% in any year.
If our premiums exceed the total of our expenses and eventual losses, we register an underwriting profit
that adds to the investment income our float produces. When such a profit is earned, we enjoy the use of free money
– and, better yet, get paid for holding it. That’s like your taking out a loan and having the bank pay you interest.
Unfortunately, the wish of all insurers to achieve this happy result creates intense competition, so vigorous
in most years that it causes the P/C industry as a whole to operate at a significant underwriting loss. This loss, in
effect, is what the industry pays to hold its float. For example, State Farm, by far the country’s largest insurer and a
well-managed company besides, incurred an underwriting loss in eight of the eleven years ending in 2011. (Their
financials for 2012 are not yet available.) There are a lot of ways to lose money in insurance, and the industry never
ceases searching for new ones.
As noted in the first section of this report, we have now operated at an underwriting profit for ten
consecutive years, our pre-tax gain for the period having totaled $18.6 billion. Looking ahead, I believe we will
continue to underwrite profitably in most years. If we do, our float will be better than free money.
So how does our attractive float affect the calculations of intrinsic value? When Berkshire’s book value is
calculated, the full amount of our float is deducted as a liability, just as if we had to pay it out tomorrow and were
unable to replenish it. But that’s an incorrect way to look at float, which should instead be viewed as a revolving
fund. If float is both costless and long-enduring, which I believe Berkshire’s will be, the true value of this liability is
dramatically less than the accounting liability.
A partial offset to this overstated liability is $15.5 billion of “goodwill” that is attributable to our insurance
companies and included in book value as an asset. In effect, this goodwill represents the price we paid for the float-
generating capabilities of our insurance operations. The cost of the goodwill, however, has no bearing on its true
value. For example, if an insurance business sustains large and prolonged underwriting losses, any goodwill asset
carried on the books should be deemed valueless, whatever its original cost.
7
�
Fortunately, that’s not the case at Berkshire. Charlie and I believe the true economic value of our insurance
goodwill – what we would happily pay to purchase an insurance operation producing float of similar quality – to be
far in excess of its historic carrying value. The value of our float is one reason – a huge reason – why we believe
Berkshire’s intrinsic business value substantially exceeds its book value.
Let me emphasize once again that cost-free float is not an outcome to be expected for the P/C industry as a
whole: There is very little “Berkshire-quality” float existing in the insurance world. In 37 of the 45 years ending in
2011, the industry’s premiums have been inadequate to cover claims plus expenses. Consequently, the industry’s
overall return on tangible equity has for many decades fallen far short of the average return realized by American
industry, a sorry performance almost certain to continue.
A further unpleasant reality adds to the industry’s dim prospects: Insurance earnings are now benefitting
from “legacy” bond portfolios that deliver much higher yields than will be available when funds are reinvested
during the next few years – and perhaps for many years beyond that. Today’s bond portfolios are, in effect, wasting
assets. Earnings of insurers will be hurt in a significant way as bonds mature and are rolled over.
Berkshire’s outstanding economics exist only because we have some terrific managers running some
extraordinary insurance operations. Let me tell you about the major units.
* * * * * * * * * * * *
First by float size is the Berkshire Hathaway Reinsurance Group, run by Ajit Jain. Ajit insures risks that no
one else has the desire or the capital to take on. His operation combines capacity, speed, decisiveness and, most
important, brains in a manner unique in the insurance business. Yet he never exposes Berkshire to risks that are
inappropriate in relation to our resources. Indeed, we are far more conservative in avoiding risk than most large
insurers. For example, if the insurance industry should experience a $250 billion loss from some mega-catastrophe
– a loss about triple anything it has ever experienced – Berkshire as a whole would likely record a significant profit
for the year because it has so many streams of earnings. All other major insurers and reinsurers would meanwhile
be far in the red, with some facing insolvency.
From a standing start in 1985, Ajit has created an insurance business with float of $35 billion and a
significant cumulative underwriting profit, a feat that no other insurance CEO has come close to matching. He has
thus added a great many billions of dollars to the value of Berkshire. If you meet Ajit at the annual meeting, bow
deeply.
We have another reinsurance powerhouse in General Re, managed by Tad Montross.
* * * * * * * * * * * *
At bottom, a sound insurance operation needs to adhere to four disciplines. It must (1) understand all
exposures that might cause a policy to incur losses; (2) conservatively assess the likelihood of any exposure actually
causing a loss and the probable cost if it does; (3) set a premium that, on average, will deliver a profit after both
prospective loss costs and operating expenses are covered; and (4) be willing to walk away if the appropriate
premium can’t be obtained.
Many insurers pass the first three tests and flunk the fourth. They simply can’t turn their back on business
that is being eagerly written by their competitors. That old line, “The other guy is doing it, so we must as well,”
spells trouble in any business, but none more so than insurance.
8
�
Tad has observed all four of the insurance commandments, and it shows in his results. General Re’s huge
float has been better than cost-free under his leadership, and we expect that, on average, it will continue to be. We
are particularly enthusiastic about General Re’s international
life reinsurance business, which has achieved
consistent and profitable growth since we acquired the company in 1998.
Finally, there is GEICO, the insurer on which I cut my teeth 62 years ago. GEICO is run by Tony Nicely,
who joined the company at 18 and completed 51 years of service in 2012.
* * * * * * * * * * * *
I rub my eyes when I look at what Tony has accomplished. Last year, it should be noted, his record was
considerably better than is indicated by GEICO’s GAAP underwriting profit of $680 million. Because of a change
in accounting rules at the beginning of the year, we recorded a charge to GEICO’s underwriting earnings of
$410 million. This item had nothing to do with 2012’s operating results, changing neither cash, revenues, expenses
nor taxes. In effect, the writedown simply widened the already huge difference between GEICO’s intrinsic value
and the value at which we carry it on our books.
GEICO earned its underwriting profit, moreover, despite the company suffering its largest single loss in
history. The cause was Hurricane Sandy, which cost GEICO more than three times the loss it sustained from
Katrina, the previous record-holder. We insured 46,906 vehicles that were destroyed or damaged in the storm, a
staggering number reflecting GEICO’s leading market share in the New York metropolitan area.
Last year GEICO enjoyed a meaningful increase in both the renewal rate for existing policyholders
(“persistency”) and in the percentage of rate quotations that resulted in sales (“closures”). Big dollars ride on those
two factors: A sustained gain in persistency of a bare one percentage point increases intrinsic value by more than
$1 billion. GEICO’s gains in 2012 offer dramatic proof that when people check the company’s prices, they usually
find they can save important sums. (Give us a try at 1-800-847-7536 or GEICO.com. Be sure to mention that you are a
shareholder; that fact will usually result in a discount.)
In addition to our three major insurance operations, we own a group of smaller companies, most of them
plying their trade in odd corners of the insurance world. In aggregate, these companies have consistently delivered
an underwriting profit. Moreover, as the table below shows, they also provide us with substantial float. Charlie and
I treasure these companies and their managers.
* * * * * * * * * * * *
Late in 2012, we enlarged this group by acquiring Guard Insurance, a Wilkes-Barre company that writes
workers compensation insurance, primarily for smaller businesses. Guard’s annual premiums total about $300
million. The company has excellent prospects for growth in both its traditional business and new lines it has begun
to offer.
Underwriting Profit
Yearend Float
(in millions)
Insurance Operations
BH Reinsurance . . . . . . . . .
General Re . . . . . . . . . . . . .
GEICO . . . . . . . . . . . . . . . .
Other Primary . . . . . . . . . .
2012
$ 304
355
680*
286
$1,625
2011
$(714)
144
576
242
$ 248
2012
$34,821
20,128
11,578
6,598
$73,125
2011
$33,728
19,714
11,169
5,960
$70,571
*After a $410 million charge against earnings arising from an industry-wide accounting change.
Among large insurance operations, Berkshire’s impresses me as the best in the world. It was our lucky day
when, in March 1967, Jack Ringwalt sold us his two property-casualty insurers for $8.6 million.
9
�


 2025年软考高级信息系统项目管理师金色考点
 软考高项三色笔记
 镇安县双鑫矿业月河年处理15万吨尾渣综合加工利用项目水土保持报告表
  红杉资本:生成式AI最新市场格局.pdf
 wireshark 使用教程.pdf
 【2021年-贝佐斯致股东的信】.pdf
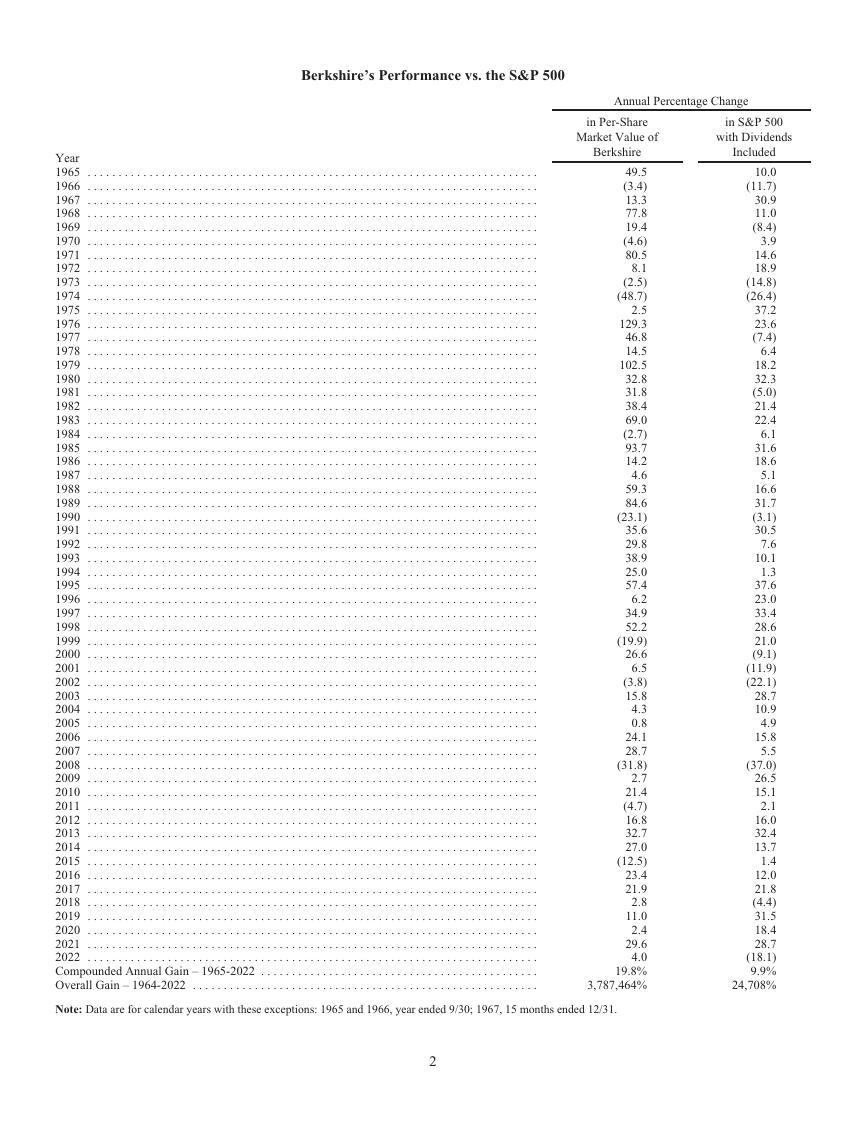 巴菲特致股东的公开信 - 2022.pdf
 MySQL 8.1 参考手册.pdf
 世界银行报告下载:激进政策缩紧浪潮不足遏制通胀 全球经济衰退迫在眉睫(Is a Global Recession Imminent?).pdf
 红杉资本报告:适应与忍耐(Adapting to Endure).pdf
 高保真音响系统设计制作-毕业论文.doc
 一种自适应互补滤波姿态估计算法.pdf