Simple visualizations of unstructured grids with VTK
Roman Putanowicz
Frederic Magoules
Revision : 1:3
November 28, 2004
Contents
1 Introduction
2 Simple data le
3 Scalar data visualization
4 Complex data le
5 Scalar data visualization { cont.
6 Scalar data visualization with color bar
7 Mesh visualization
8 Subdomains visualization
9 Labeling points
10 Labeling cells
11 Saving visualization to a le
2
2
4
6
7
9
11
14
17
21
26
1
�1
Introduction
This report shows examples of simple visualizations of unstructured grids with use of
VTK - The Visualization Toolkit. VTK is a software system for computer graphics,
visualization and image processing. Although VTK is a large and complex library, it is
possible to write with it short and easily understandable applications, which perform
quite complex tasks. This is due to the object-oriented, high level interface provided
by VTK, as well as to the possibility of using VTK with languages like Tcl, Java and
Python (VTK itself is written in C++).
VTK library is distributed as open-source software with extensive class documentation
and lots of examples. The examples are however organized around particular classes,
like vtkPolyDataMaper, what might be a bit confusing for a beginner, who usually
wants to answer simple questions, like: "What should I do to draw a mesh?". This re-
port provides answers to few such simple questions but it is by no means a substitution
for reading documentation or literature. For this reasons we do not provide explana-
tion or discussion of several basic concepts like visualization, visualization pipeline,
data sets but instead we point to consult specic references [1, 2]. For readers who
need introduction to Tcl programming language we suggest books [3, 4].
All presented examples are written using Tcl interface to VTK library. With each
example there is a short description, a diagram showing the organization of a visual-
ization pipeline, a Tcl script1 and results of running it on sample data. The scripts,
commented and fairly simple, can be a good starting point for readers to do their own
experiments in visualization with VTK.
2 Simple data le
The data le for the rst example is called "stripSimple.vtk". This le denes
geometry and topology of an unstructured grid together with a scalar eld called
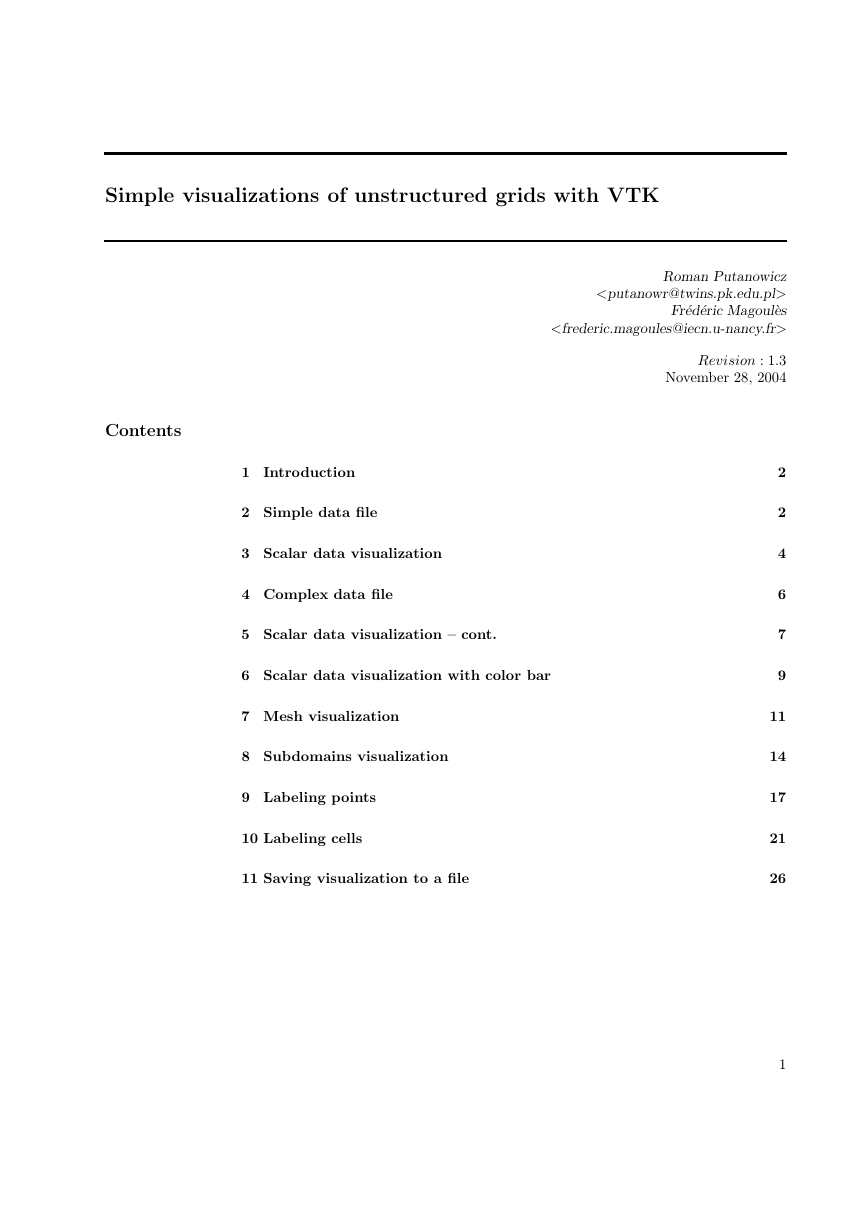
"temperature". Numbering of nodes, elements and node coordinates are shown in
gure 1. Note the use of VTK convention, in which nodes and elements are numbered
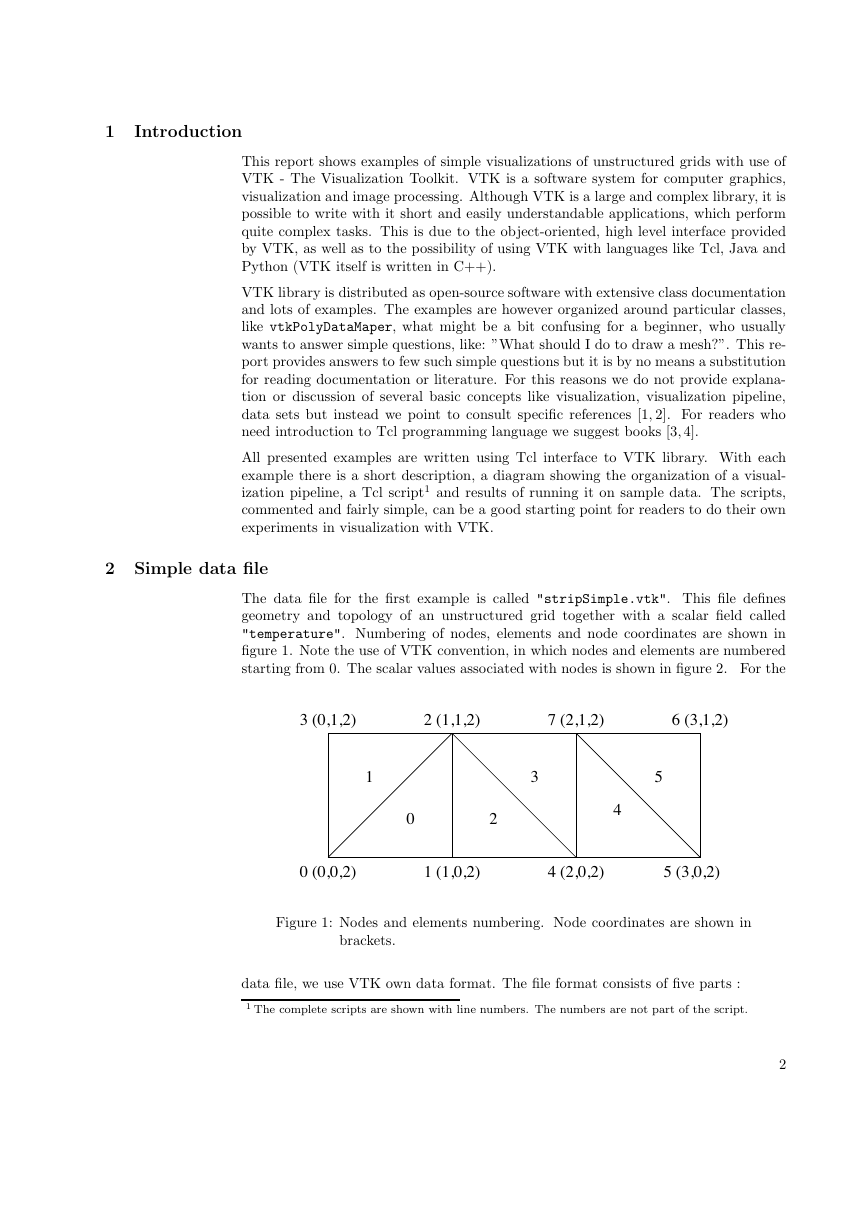
starting from 0. The scalar values associated with nodes is shown in gure 2. For the
3 (0,1,2)
2 (1,1,2)
7 (2,1,2)
6 (3,1,2)
1
3
5
0
2
4
0 (0,0,2)
1 (1,0,2)
4 (2,0,2)
5 (3,0,2)
Figure 1: Nodes and elements numbering. Node coordinates are shown in
brackets.
data le, we use VTK own data format. The le format consists of ve parts :
1 The complete scripts are shown with line numbers. The numbers are not part of the script.
2
�
1.0
2.0
3.0
4.0
1.0
2.0
3.0
4.0
Figure 2: Point attributes "temperature".
1. le version identier
2. one line header describing the le
3. type of the le (ASCII/BINARY)
4. data set description - geometry and topology
5. data set attributes - can be specied separately for points and for cells
Further details on VTK le format can be found in [1, 2].
The data attribute section in "stripSimple.vtk" contains specication of point data
as an array of scalar values of type oat, called "temperature". That array have one
component (out of four allowed). The array is associated with default lookup table
(i.e. a table which holds array of colors - for instance RGB (Red-Green-Blue) color
components).
The "stripSimple.vtk" le is given below:
# vtk DataFile Version 3.0
2D scalar data
ASCII
DATASET UNSTRUCTURED GRID
POINTS 8 float
0 0 2
1 0 2
1 1 2
0 1 2
2 0 2
3 0 2
3 1 2
2 1 2
CELLS 6 24
3 0 1 2
3 0 2 3
3 1 4 2
3
�
3 4 7 2
3 4 5 7
3 5 6 7
CELL TYPES 6
5
5
5
5
5
5
POINT DATA 8
SCALARS temperature float 1
LOOKUP TABLE default
1.0 2.0 2.0 1.0
3.0 4.0 4.0 3.0
3 Scalar data visualization
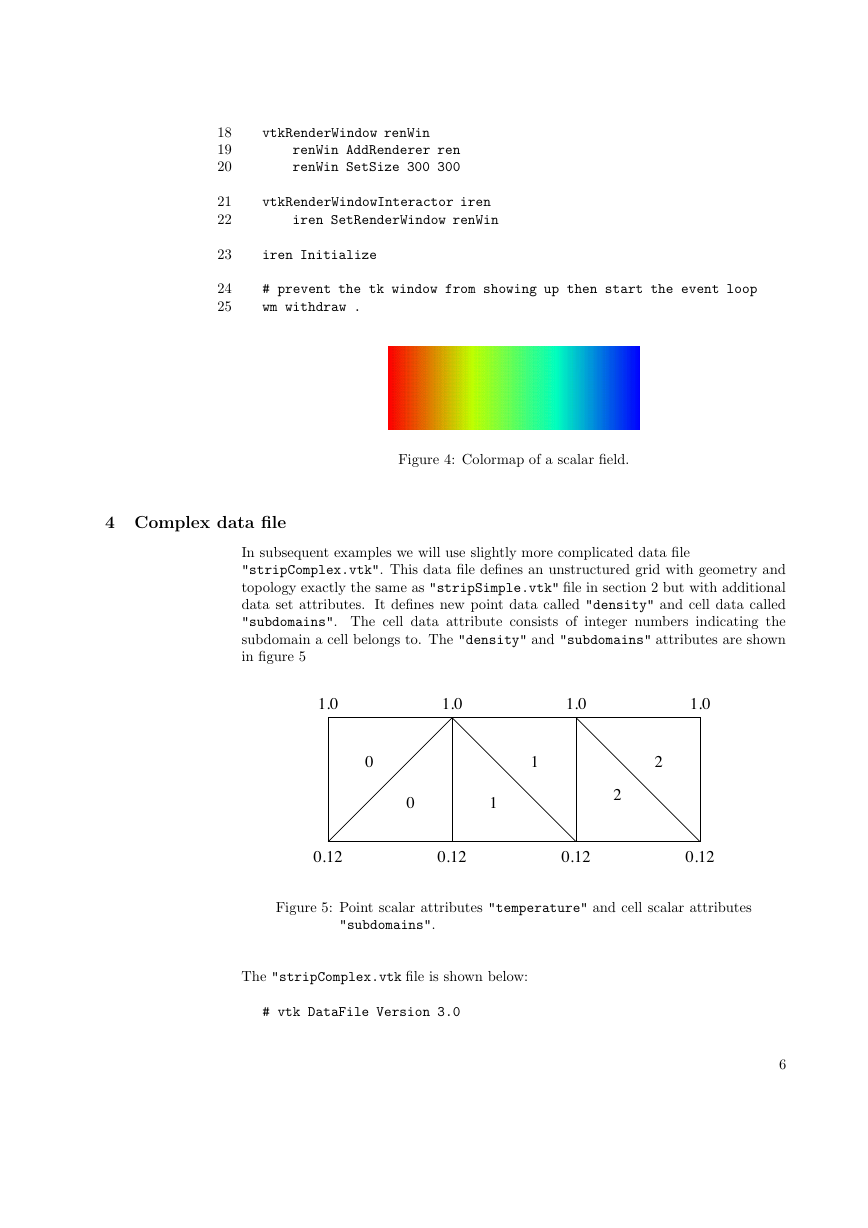
This example shows most basic visualization technique which is color mapping or in
other words assigning colors to elements, based on the scalar value at the points. This
technique can be eectively used to visualize scalar elds. The visualization pipeline is
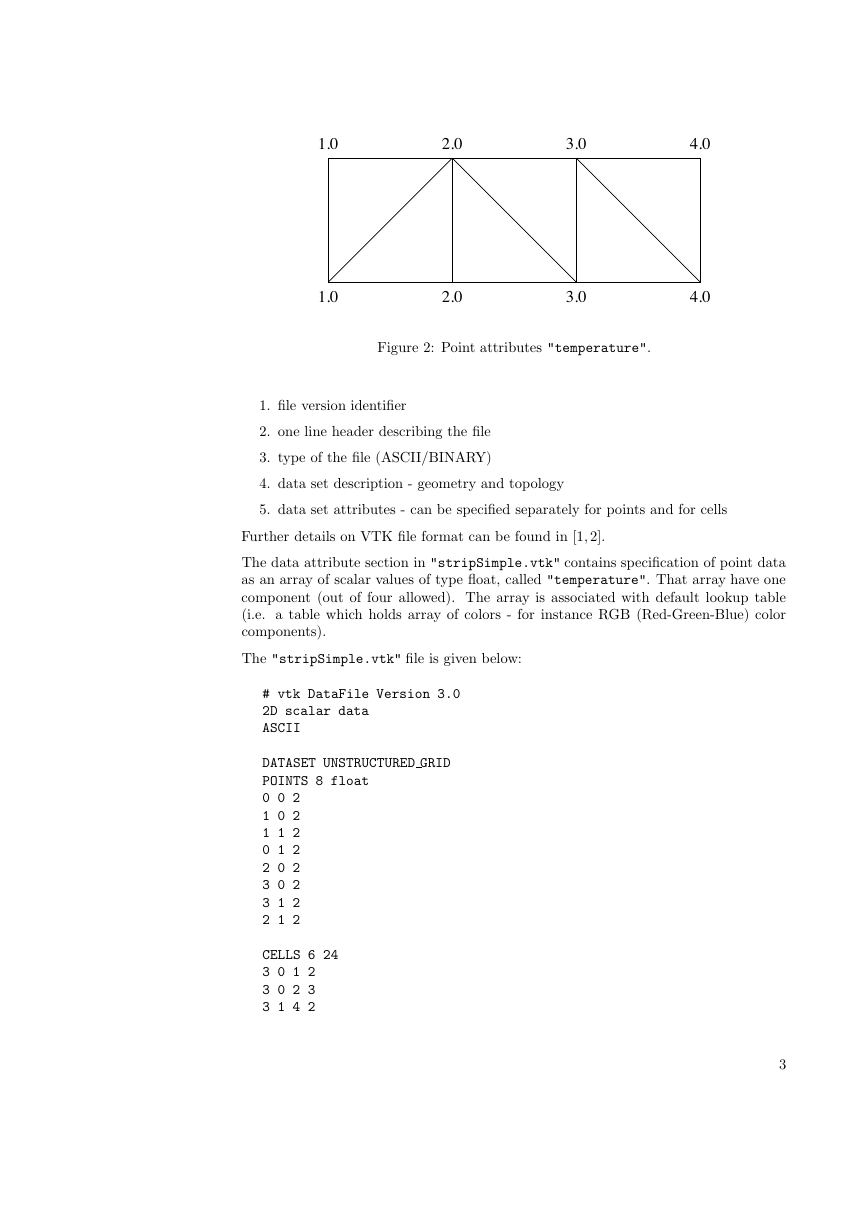
shown in the gure 3. In the example, the color mapping is performed by an instance
of vtkDataSetMapper. vtkDataSetMapper receives its input as unstructured grid from
vktUnstructuredGridReader.
One of the methods to control color mapping provided by vtkDataSetMapper is
SetScalarRange. That method sets the minimum and maximum value of scalars, that
are mapped to colors. Scalars values less than the minimum are clamped to minimum
color and scalar values greater than the maximum are clamped to the maximum color.
In the line:
eval dataMapper SetScalarRange [[reader GetOutput] GetScalarRange]
the scalar range is set to be the range of data values in the grid. Note that this line
can be rewritten as follows:
set drange [[reader GetOutput] GetScalarRange]
set dmin [lindex $drange 0]
set dmax [lindex $drange 1]
dataMapper SetScalarRange $dmin $dmax
and if we would like to manually set range (let say from 1.2 to 2.5), we can use the
following command:
dataMapper SetScalarRange 1.2 2.5
The GetScalarRange method shown in the above code snippets should be used with
care. This method returns the range of scalar value attributes in the grid, but it
4
�
considers scalar attributes both in points and in cells.
If we want to pass to the
mapper the range of scalar eld for points only, we need to select point data rst and
then inquire the scalar range. How it can be done is shown in section 5.
The vtkDataSetMapper allows to control many more aspects of the mapping (e.g. chose
the eld to be mapped, chose points or cell data, etc), but for our simple example the
default values and behaviour is enough.
vtkUnstructuredGridReader
vtkDataSetMapper
vtkActor
vtkRenderer
vtkRenderWindow
vtkRenderWindowInteractor
Figure 3: Scalar data visualization pipeline.
1
2
3
4
5
6
7
8
9
10
11
12
13
14
15
16
17
package require vtk
package require vtkinteraction
# set the name of data file
set file "stripSimple.vtk"
vtkUnstructuredGridReader reader
reader SetFileName "$file"
# reader Update is needed because of .. GetScalarRange ..
reader Update
vtkDataSetMapper dataMapper
dataMapper SetInput [reader GetOutput]
eval dataMapper SetScalarRange [[reader GetOutput] n
GetScalarRange]
vtkActor dataActor
dataActor SetMapper dataMapper
vtkRenderer ren
ren SetBackground 1 1 1
ren AddActor dataActor
5
�
18
19
20
21
22
23
24
25
vtkRenderWindow renWin
renWin AddRenderer ren
renWin SetSize 300 300
vtkRenderWindowInteractor iren
iren SetRenderWindow renWin
iren Initialize
# prevent the tk window from showing up then start the event loop
wm withdraw .
Figure 4: Colormap of a scalar eld.
4 Complex data le
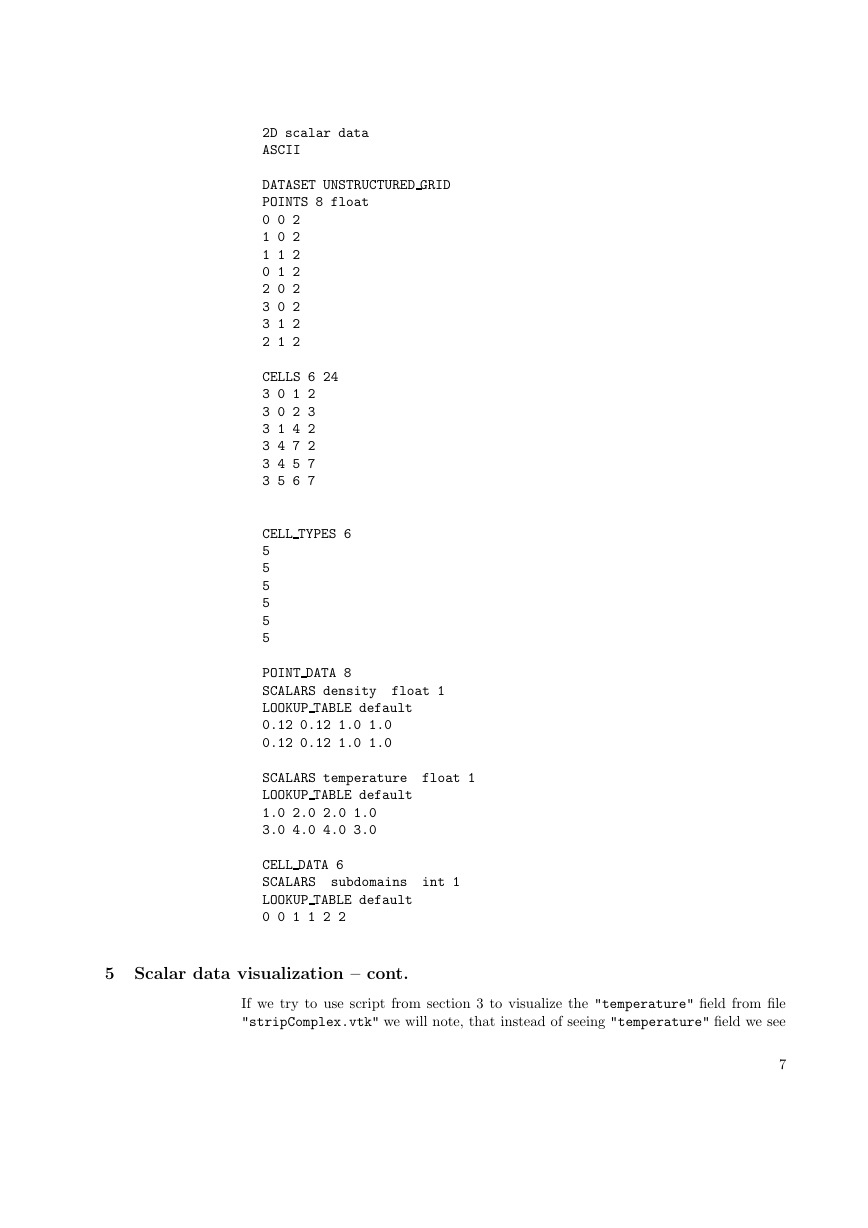
In subsequent examples we will use slightly more complicated data le
"stripComplex.vtk". This data le denes an unstructured grid with geometry and
topology exactly the same as "stripSimple.vtk" le in section 2 but with additional
data set attributes. It denes new point data called "density" and cell data called
"subdomains". The cell data attribute consists of integer numbers indicating the
subdomain a cell belongs to. The "density" and "subdomains" attributes are shown
in gure 5
1.0
1.0
1.0
1.0
0
1
2
0
1
2
0.12
0.12
0.12
0.12
Figure 5: Point scalar attributes "temperature" and cell scalar attributes
"subdomains".
The "stripComplex.vtk le is shown below:
# vtk DataFile Version 3.0
6
�
2D scalar data
ASCII
DATASET UNSTRUCTURED GRID
POINTS 8 float
0 0 2
1 0 2
1 1 2
0 1 2
2 0 2
3 0 2
3 1 2
2 1 2
CELLS 6 24
3 0 1 2
3 0 2 3
3 1 4 2
3 4 7 2
3 4 5 7
3 5 6 7
CELL TYPES 6
5
5
5
5
5
5
POINT DATA 8
SCALARS density float 1
LOOKUP TABLE default
0.12 0.12 1.0 1.0
0.12 0.12 1.0 1.0
SCALARS temperature float 1
LOOKUP TABLE default
1.0 2.0 2.0 1.0
3.0 4.0 4.0 3.0
CELL DATA 6
SCALARS subdomains int 1
LOOKUP TABLE default
0 0 1 1 2 2
5 Scalar data visualization { cont.
If we try to use script from section 3 to visualize the "temperature" eld from le
"stripComplex.vtk" we will note, that instead of seeing "temperature" eld we see
7
�
"density" eld. Closer examination of the picture reveals that there is also something
wrong with colors as we do not see the whole color range. The rst problem steams from
the fact that vtkUnstructuredGridReader, unless specically instructed, reads only
the rst scalar eld it encounters.
In le "stripComplex.vtk" the "temperature"
eld comes as the second and it is not read in. The second problem with colors is
caused by presence of a cell scalar data attribute. As it was mentioned in section 3
the method GetScalarRange calculates the range for both point and cell scalar data,
so the range returned by it is 0.0 to 4.0 and not as we would expect 1.0 to 4.0, for
"temperature" eld.
The script shown below is a slight modication of script from section 3 which takes
into account the problems mentioned above:
1
2
3
4
5
6
7
8
9
10
11
12
13
14
15
16
17
18
19
20
21
22
23
24
25
26
27
28
package require vtk
package require vtkinteraction
# set the name of data file
set file "stripComplex.vtk"
vtkUnstructuredGridReader reader
reader SetFileName "$file"
# read "temperature" field as point data
reader SetScalarsName "temperature"
reader Update
# get range of scalars in points
set pointData [[reader GetOutput] GetPointData]
set drange [[$pointData GetScalars] GetRange]
vtkDataSetMapper dataMapper
dataMapper SetInput [reader GetOutput]
eval dataMapper SetScalarRange $drange
vtkActor dataActor
dataActor SetMapper dataMapper
vtkRenderer ren
ren SetBackground 1 1 1
ren AddActor dataActor
vtkRenderWindow renWin
renWin AddRenderer ren
renWin SetSize 300 300
vtkRenderWindowInteractor iren
iren SetRenderWindow renWin
iren Initialize
# prevent the tk window from showing up then start the event loop
wm withdraw .
8
�



 2023年江西萍乡中考道德与法治真题及答案.doc
 2012年重庆南川中考生物真题及答案.doc
 2013年江西师范大学地理学综合及文艺理论基础考研真题.doc
 2020年四川甘孜小升初语文真题及答案I卷.doc
 2020年注册岩土工程师专业基础考试真题及答案.doc
 2023-2024学年福建省厦门市九年级上学期数学月考试题及答案.doc
 2021-2022学年辽宁省沈阳市大东区九年级上学期语文期末试题及答案.doc
 2022-2023学年北京东城区初三第一学期物理期末试卷及答案.doc
 2018上半年江西教师资格初中地理学科知识与教学能力真题及答案.doc
 2012年河北国家公务员申论考试真题及答案-省级.doc
 2020-2021学年江苏省扬州市江都区邵樊片九年级上学期数学第一次质量检测试题及答案.doc
 2022下半年黑龙江教师资格证中学综合素质真题及答案.doc