Package ‘rms’
April 4, 2016
Version 4.5-0
Date 2016-04-02
Title Regression Modeling Strategies
Author Frank E Harrell Jr
Maintainer Frank E Harrell Jr
Depends Hmisc (>= 3.17-3), survival (>= 2.37-6), lattice, ggplot2 (>=
2.0), SparseM
Imports methods, quantreg, nlme (>= 3.1-123), rpart, polspline,
multcomp
Suggests boot, tcltk
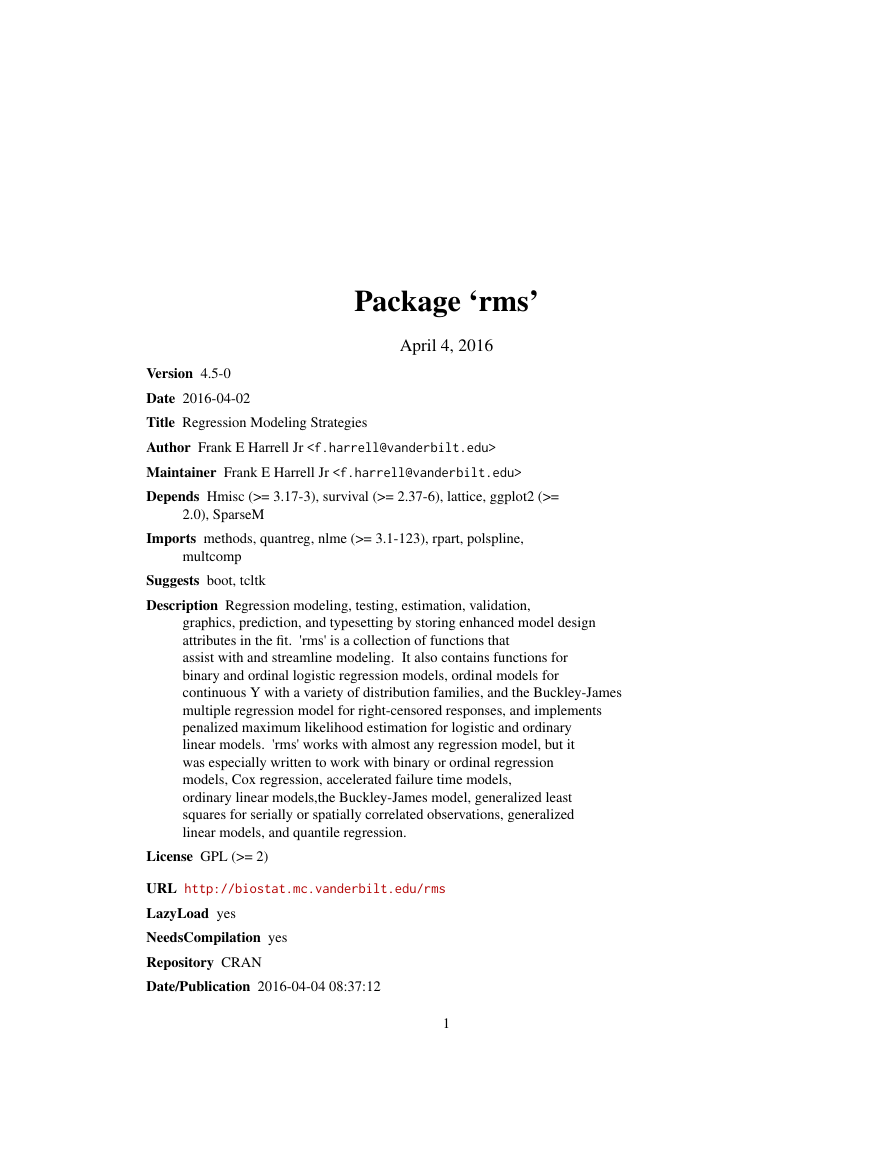
Description Regression modeling, testing, estimation, validation,
'rms' is a collection of functions that
graphics, prediction, and typesetting by storing enhanced model design
attributes in the fit.
assist with and streamline modeling. It also contains functions for
binary and ordinal logistic regression models, ordinal models for
continuous Y with a variety of distribution families, and the Buckley-James
multiple regression model for right-censored responses, and implements
penalized maximum likelihood estimation for logistic and ordinary
linear models.
'rms' works with almost any regression model, but it
was especially written to work with binary or ordinal regression
models, Cox regression, accelerated failure time models,
ordinary linear models,the Buckley-James model, generalized least
squares for serially or spatially correlated observations, generalized
linear models, and quantile regression.
License GPL (>= 2)
URL http://biostat.mc.vanderbilt.edu/rms
LazyLoad yes
NeedsCompilation yes
Repository CRAN
Date/Publication 2016-04-04 08:37:12
1
�
2
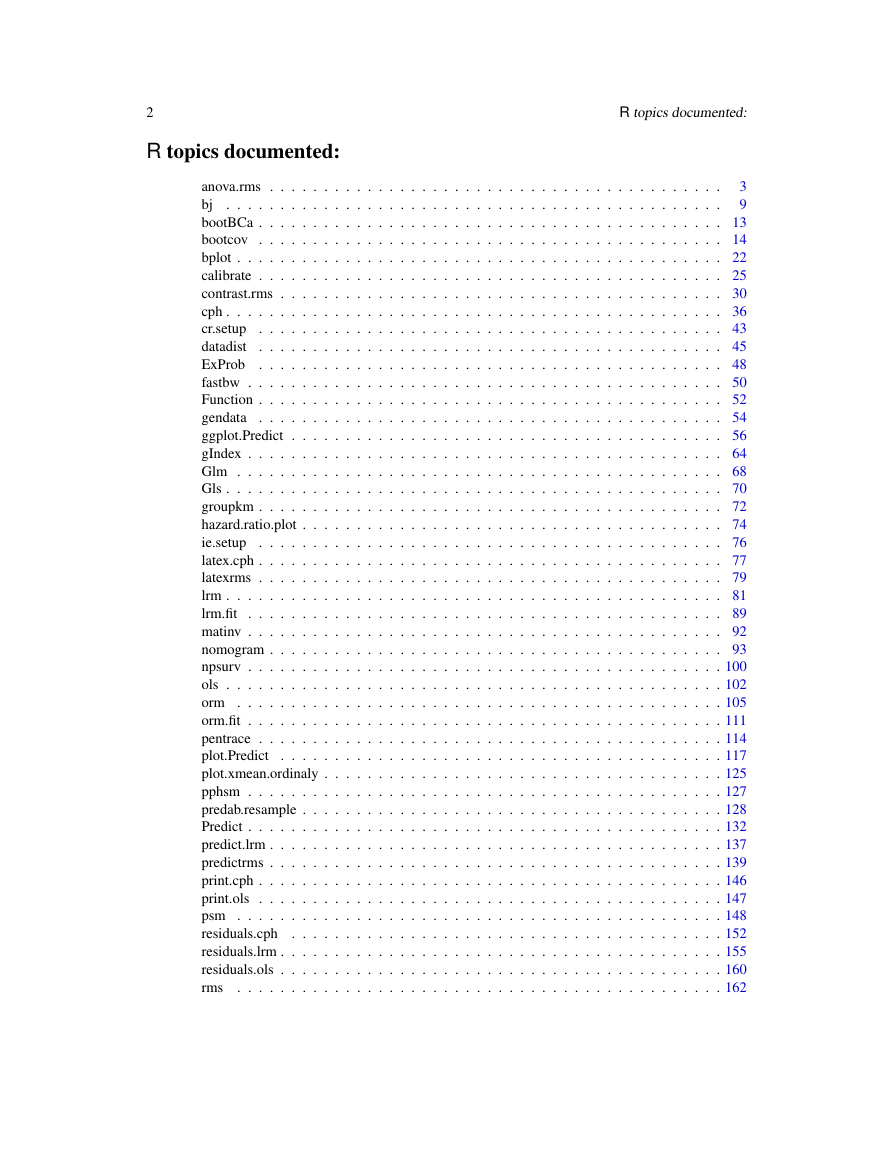
R topics documented:
R topics documented:
.
.
.
.
.
.
.
.
.
.
.
.
.
.
.
.
.
.
.
.
.
.
.
.
.
.
.
.
.
.
.
.
.
.
.
.
.
.
.
.
.
.
.
.
.
.
.
.
.
.
.
.
.
.
.
.
.
.
.
.
.
.
.
.
.
.
.
.
.
.
.
anova.rms .
.
.
.
.
bj
.
.
.
.
.
bootBCa .
.
.
.
.
bootcov .
.
.
.
bplot .
.
.
.
.
calibrate .
.
.
.
.
contrast.rms .
.
.
.
cph .
.
.
.
cr.setup .
.
.
.
.
datadist
.
.
.
.
ExProb .
.
.
.
fastbw .
.
.
.
Function .
.
.
.
gendata .
.
.
.
ggplot.Predict
.
.
.
gIndex .
.
.
.
.
.
Glm .
.
.
.
Gls .
.
.
.
.
.
groupkm .
.
.
.
hazard.ratio.plot .
.
.
ie.setup .
.
.
latex.cph .
.
.
.
.
latexrms .
.
.
.
.
.
lrm .
.
.
.
.
.
lrm.fit
.
.
.
matinv .
.
.
.
.
.
nomogram .
.
.
.
.
npsurv .
.
.
.
.
ols .
.
.
.
.
orm .
.
.
.
.
.
.
orm.fit .
.
.
.
pentrace .
.
plot.Predict
.
.
plot.xmean.ordinaly .
.
pphsm .
.
.
predab.resample .
.
.
.
Predict .
.
.
predict.lrm .
.
.
.
.
.
predictrms .
.
.
.
.
print.cph .
.
.
.
.
print.ols .
.
psm .
.
.
.
.
.
.
residuals.cph .
.
.
.
residuals.lrm .
.
.
.
residuals.ols .
rms
.
.
.
.
.
.
.
.
.
.
.
.
.
.
.
.
.
.
.
.
.
.
.
.
.
.
.
.
.
.
.
.
.
.
.
.
.
.
.
.
.
.
.
.
.
.
.
.
.
.
.
.
.
.
.
.
.
.
.
.
.
.
.
.
.
.
.
.
.
.
.
.
.
.
.
.
.
.
.
.
.
.
.
.
.
.
.
.
.
.
.
.
.
.
.
.
.
.
.
.
.
.
.
.
.
.
.
.
.
.
.
.
.
.
.
.
.
.
.
.
.
.
.
.
.
.
.
.
.
.
.
.
.
.
.
.
.
.
.
.
.
.
.
.
.
.
.
.
.
.
.
.
.
.
.
.
.
.
.
.
.
.
.
.
.
.
.
.
.
.
.
.
.
.
.
.
.
.
.
.
.
.
.
.
.
.
.
.
.
.
.
.
.
.
.
.
.
3
. . . . . . . . . . . . . . . . . . . . . . . . . . . . . . . .
.
. . . . . . . . . . . . . . . . . . . . . . . . . . . . . . . .
9
.
. . . . . . . . . . . . . . . . . . . . . . . . . . . . . . . . 13
.
. . . . . . . . . . . . . . . . . . . . . . . . . . . . . . . . 14
.
. . . . . . . . . . . . . . . . . . . . . . . . . . . . . . . . 22
.
. . . . . . . . . . . . . . . . . . . . . . . . . . . . . . . . 25
.
. . . . . . . . . . . . . . . . . . . . . . . . . . . . . . . . 30
.
. . . . . . . . . . . . . . . . . . . . . . . . . . . . . . . . 36
.
. . . . . . . . . . . . . . . . . . . . . . . . . . . . . . . . 43
.
. . . . . . . . . . . . . . . . . . . . . . . . . . . . . . . . 45
.
. . . . . . . . . . . . . . . . . . . . . . . . . . . . . . . . 48
.
. . . . . . . . . . . . . . . . . . . . . . . . . . . . . . . . 50
.
. . . . . . . . . . . . . . . . . . . . . . . . . . . . . . . . 52
.
. . . . . . . . . . . . . . . . . . . . . . . . . . . . . . . . 54
.
. . . . . . . . . . . . . . . . . . . . . . . . . . . . . . . . 56
.
. . . . . . . . . . . . . . . . . . . . . . . . . . . . . . . . 64
.
. . . . . . . . . . . . . . . . . . . . . . . . . . . . . . . . 68
.
. . . . . . . . . . . . . . . . . . . . . . . . . . . . . . . . 70
.
. . . . . . . . . . . . . . . . . . . . . . . . . . . . . . . . 72
.
. . . . . . . . . . . . . . . . . . . . . . . . . . . . . . . . 74
.
. . . . . . . . . . . . . . . . . . . . . . . . . . . . . . . . 76
.
. . . . . . . . . . . . . . . . . . . . . . . . . . . . . . . . 77
.
. . . . . . . . . . . . . . . . . . . . . . . . . . . . . . . . 79
.
. . . . . . . . . . . . . . . . . . . . . . . . . . . . . . . . 81
.
. . . . . . . . . . . . . . . . . . . . . . . . . . . . . . . . 89
.
. . . . . . . . . . . . . . . . . . . . . . . . . . . . . . . . 92
.
. . . . . . . . . . . . . . . . . . . . . . . . . . . . . . . . 93
.
. . . . . . . . . . . . . . . . . . . . . . . . . . . . . . . . 100
.
. . . . . . . . . . . . . . . . . . . . . . . . . . . . . . . . 102
.
. . . . . . . . . . . . . . . . . . . . . . . . . . . . . . . . 105
.
. . . . . . . . . . . . . . . . . . . . . . . . . . . . . . . . 111
.
. . . . . . . . . . . . . . . . . . . . . . . . . . . . . . . . 114
.
. . . . . . . . . . . . . . . . . . . . . . . . . . . . . . . . 117
.
. . . . . . . . . . . . . . . . . . . . . . . . . . . . . . . . 125
.
. . . . . . . . . . . . . . . . . . . . . . . . . . . . . . . . 127
.
. . . . . . . . . . . . . . . . . . . . . . . . . . . . . . . . 128
.
. . . . . . . . . . . . . . . . . . . . . . . . . . . . . . . . 132
.
. . . . . . . . . . . . . . . . . . . . . . . . . . . . . . . . 137
.
. . . . . . . . . . . . . . . . . . . . . . . . . . . . . . . . . 139
. . . . . . . . . . . . . . . . . . . . . . . . . . . . . . . . 146
.
. . . . . . . . . . . . . . . . . . . . . . . . . . . . . . . . 147
.
.
. . . . . . . . . . . . . . . . . . . . . . . . . . . . . . . . 148
. . . . . . . . . . . . . . . . . . . . . . . . . . . . . . . . 152
.
.
. . . . . . . . . . . . . . . . . . . . . . . . . . . . . . . . 155
. . . . . . . . . . . . . . . . . . . . . . . . . . . . . . . . . 160
.
. . . . . . . . . . . . . . . . . . . . . . . . . . . . . . . . 162
�
anova.rms
3
.
.
.
.
.
.
.
.
.
.
.
.
.
.
.
.
rms.trans .
.
rmsMisc .
.
.
rmsOverview .
.
.
.
robcov .
.
.
.
Rq .
.
.
.
.
sensuc .
.
.
setPb .
.
.
.
.
specs.rms
.
.
.
summary.rms
.
.
survest.cph .
.
survest.psm .
.
.
.
.
survfit.cph .
.
.
.
.
survplot
.
.
.
.
.
val.prob .
.
val.surv .
.
.
.
.
.
validate .
.
.
.
.
validate.cph .
.
.
validate.lrm .
.
.
validate.ols
.
.
validate.rpart
.
.
.
validate.Rq .
vif .
.
.
.
which.influence .
.
.
.
.
.
.
.
.
.
.
.
.
.
.
.
.
.
.
.
.
.
.
.
.
.
.
.
.
.
.
.
.
.
.
.
.
.
.
.
.
.
.
.
.
.
.
.
.
.
.
.
.
.
.
.
.
.
.
.
.
.
.
.
.
.
.
.
.
.
.
.
.
.
.
.
.
.
.
.
.
.
.
.
.
.
.
.
.
.
.
.
.
.
.
.
.
.
.
.
.
.
.
.
.
.
.
.
.
.
.
.
.
.
.
.
.
.
.
.
.
.
.
.
.
.
.
.
.
.
.
.
.
.
.
.
.
.
.
.
.
.
.
. . . . . . . . . . . . . . . . . . . . . . . . . . . . . . . . 164
. . . . . . . . . . . . . . . . . . . . . . . . . . . . . . . . 166
. . . . . . . . . . . . . . . . . . . . . . . . . . . . . . . . 172
. . . . . . . . . . . . . . . . . . . . . . . . . . . . . . . . 183
. . . . . . . . . . . . . . . . . . . . . . . . . . . . . . . . 186
. . . . . . . . . . . . . . . . . . . . . . . . . . . . . . . . 188
. . . . . . . . . . . . . . . . . . . . . . . . . . . . . . . . 192
. . . . . . . . . . . . . . . . . . . . . . . . . . . . . . . . 193
. . . . . . . . . . . . . . . . . . . . . . . . . . . . . . . . 194
. . . . . . . . . . . . . . . . . . . . . . . . . . . . . . . . 198
. . . . . . . . . . . . . . . . . . . . . . . . . . . . . . . . 201
. . . . . . . . . . . . . . . . . . . . . . . . . . . . . . . . 202
. . . . . . . . . . . . . . . . . . . . . . . . . . . . . . . . 203
. . . . . . . . . . . . . . . . . . . . . . . . . . . . . . . . 210
. . . . . . . . . . . . . . . . . . . . . . . . . . . . . . . . 215
. . . . . . . . . . . . . . . . . . . . . . . . . . . . . . . . 219
. . . . . . . . . . . . . . . . . . . . . . . . . . . . . . . . 222
. . . . . . . . . . . . . . . . . . . . . . . . . . . . . . . . 224
. . . . . . . . . . . . . . . . . . . . . . . . . . . . . . . . 227
. . . . . . . . . . . . . . . . . . . . . . . . . . . . . . . . 229
. . . . . . . . . . . . . . . . . . . . . . . . . . . . . . . . 230
. . . . . . . . . . . . . . . . . . . . . . . . . . . . . . . . 232
. . . . . . . . . . . . . . . . . . . . . . . . . . . . . . . . 233
Index
235
anova.rms
Analysis of Variance (Wald and F Statistics)
Description
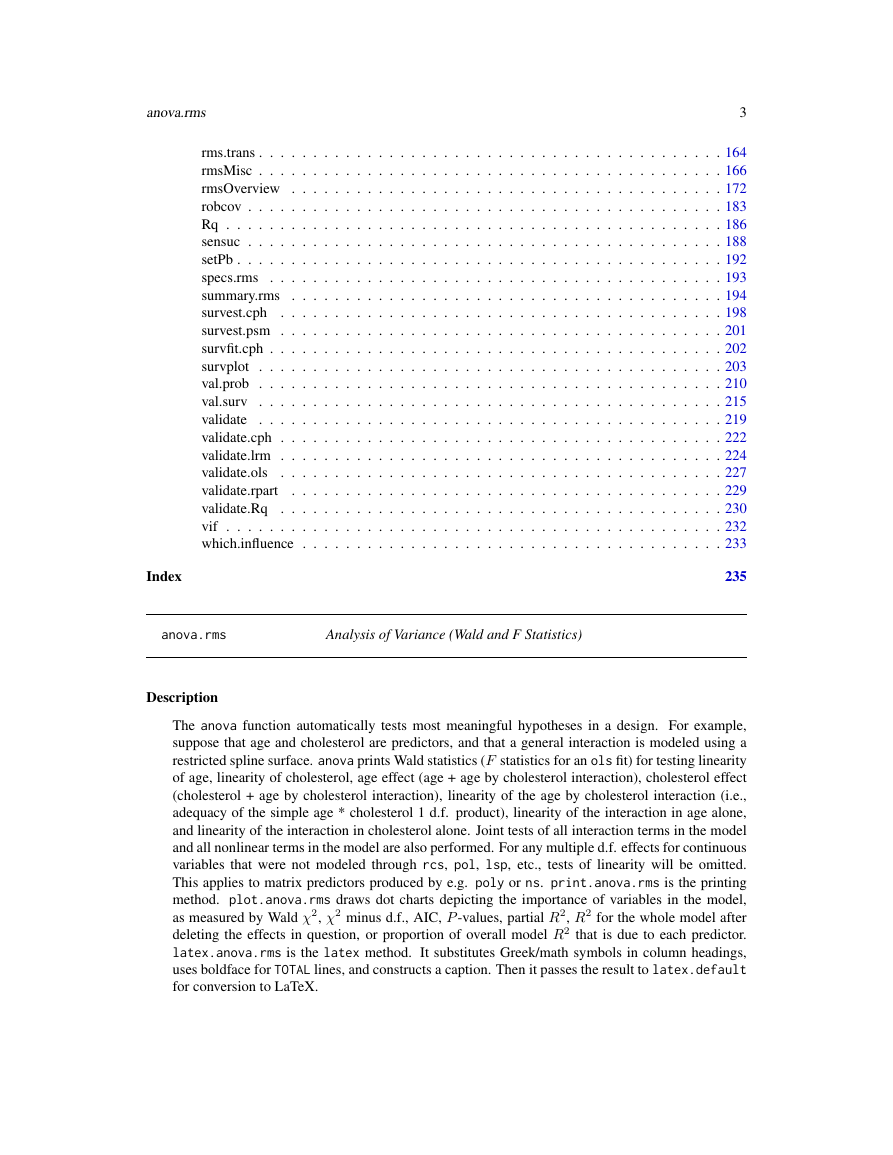
The anova function automatically tests most meaningful hypotheses in a design. For example,
suppose that age and cholesterol are predictors, and that a general interaction is modeled using a
restricted spline surface. anova prints Wald statistics (F statistics for an ols fit) for testing linearity
of age, linearity of cholesterol, age effect (age + age by cholesterol interaction), cholesterol effect
(cholesterol + age by cholesterol interaction), linearity of the age by cholesterol interaction (i.e.,
adequacy of the simple age * cholesterol 1 d.f. product), linearity of the interaction in age alone,
and linearity of the interaction in cholesterol alone. Joint tests of all interaction terms in the model
and all nonlinear terms in the model are also performed. For any multiple d.f. effects for continuous
variables that were not modeled through rcs, pol, lsp, etc., tests of linearity will be omitted.
This applies to matrix predictors produced by e.g. poly or ns. print.anova.rms is the printing
method. plot.anova.rms draws dot charts depicting the importance of variables in the model,
as measured by Wald χ2, χ2 minus d.f., AIC, P -values, partial R2, R2 for the whole model after
deleting the effects in question, or proportion of overall model R2 that is due to each predictor.
latex.anova.rms is the latex method. It substitutes Greek/math symbols in column headings,
uses boldface for TOTAL lines, and constructs a caption. Then it passes the result to latex.default
for conversion to LaTeX.
�
4
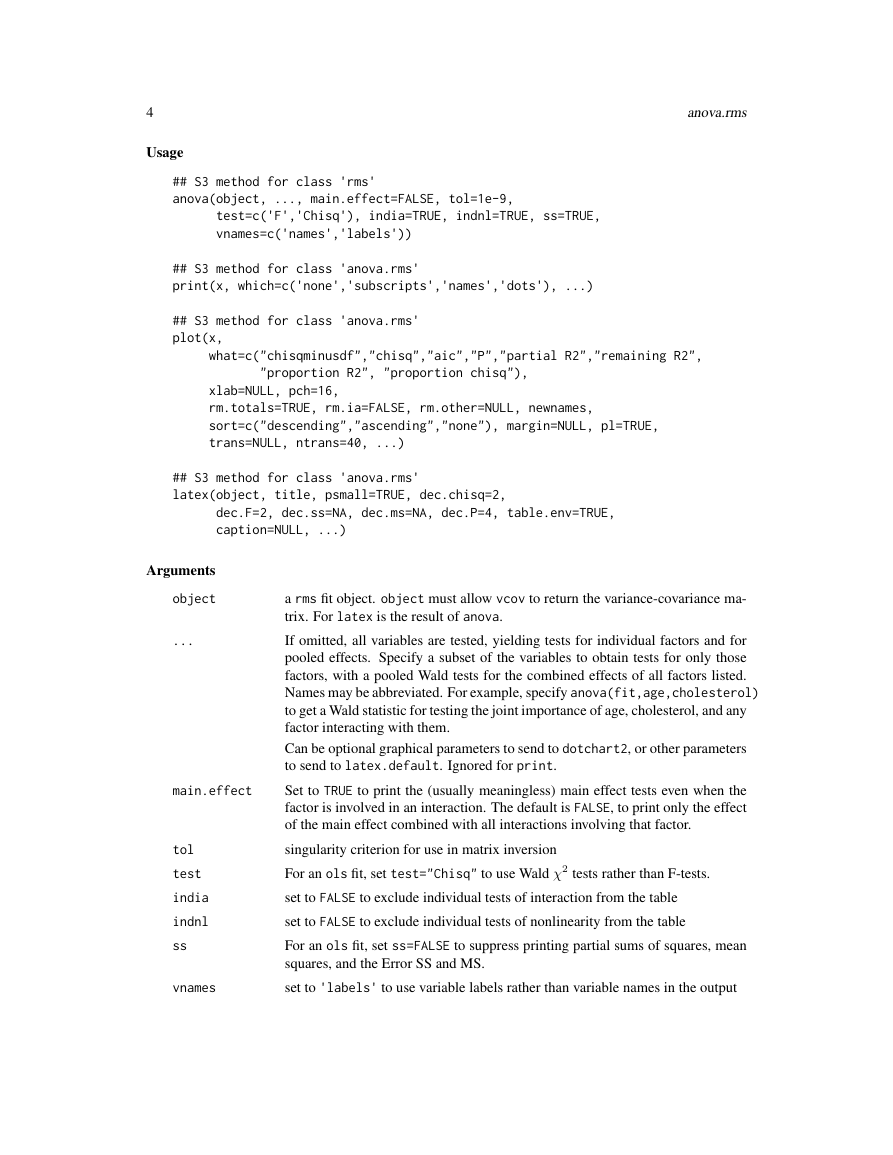
Usage
anova.rms
## S3 method for class ’rms’
anova(object, ..., main.effect=FALSE, tol=1e-9,
test=c(’F’,’Chisq’), india=TRUE, indnl=TRUE, ss=TRUE,
vnames=c(’names’,’labels’))
## S3 method for class ’anova.rms’
print(x, which=c(’none’,’subscripts’,’names’,’dots’), ...)
## S3 method for class ’anova.rms’
plot(x,
what=c("chisqminusdf","chisq","aic","P","partial R2","remaining R2",
"proportion R2", "proportion chisq"),
xlab=NULL, pch=16,
rm.totals=TRUE, rm.ia=FALSE, rm.other=NULL, newnames,
sort=c("descending","ascending","none"), margin=NULL, pl=TRUE,
trans=NULL, ntrans=40, ...)
## S3 method for class ’anova.rms’
latex(object, title, psmall=TRUE, dec.chisq=2,
dec.F=2, dec.ss=NA, dec.ms=NA, dec.P=4, table.env=TRUE,
caption=NULL, ...)
Arguments
object
...
main.effect
tol
test
india
indnl
ss
vnames
a rms fit object. object must allow vcov to return the variance-covariance ma-
trix. For latex is the result of anova.
If omitted, all variables are tested, yielding tests for individual factors and for
pooled effects. Specify a subset of the variables to obtain tests for only those
factors, with a pooled Wald tests for the combined effects of all factors listed.
Names may be abbreviated. For example, specify anova(fit,age,cholesterol)
to get a Wald statistic for testing the joint importance of age, cholesterol, and any
factor interacting with them.
Can be optional graphical parameters to send to dotchart2, or other parameters
to send to latex.default. Ignored for print.
Set to TRUE to print the (usually meaningless) main effect tests even when the
factor is involved in an interaction. The default is FALSE, to print only the effect
of the main effect combined with all interactions involving that factor.
singularity criterion for use in matrix inversion
For an ols fit, set test="Chisq" to use Wald χ2 tests rather than F-tests.
set to FALSE to exclude individual tests of interaction from the table
set to FALSE to exclude individual tests of nonlinearity from the table
For an ols fit, set ss=FALSE to suppress printing partial sums of squares, mean
squares, and the Error SS and MS.
set to ’labels’ to use variable labels rather than variable names in the output
�
anova.rms
x
which
what
xlab
pch
rm.totals
rm.ia
rm.other
newnames
sort
margin
pl
trans
ntrans
title
psmall
dec.chisq
dec.F
dec.ss
dec.ms
dec.P
table.env
caption
5
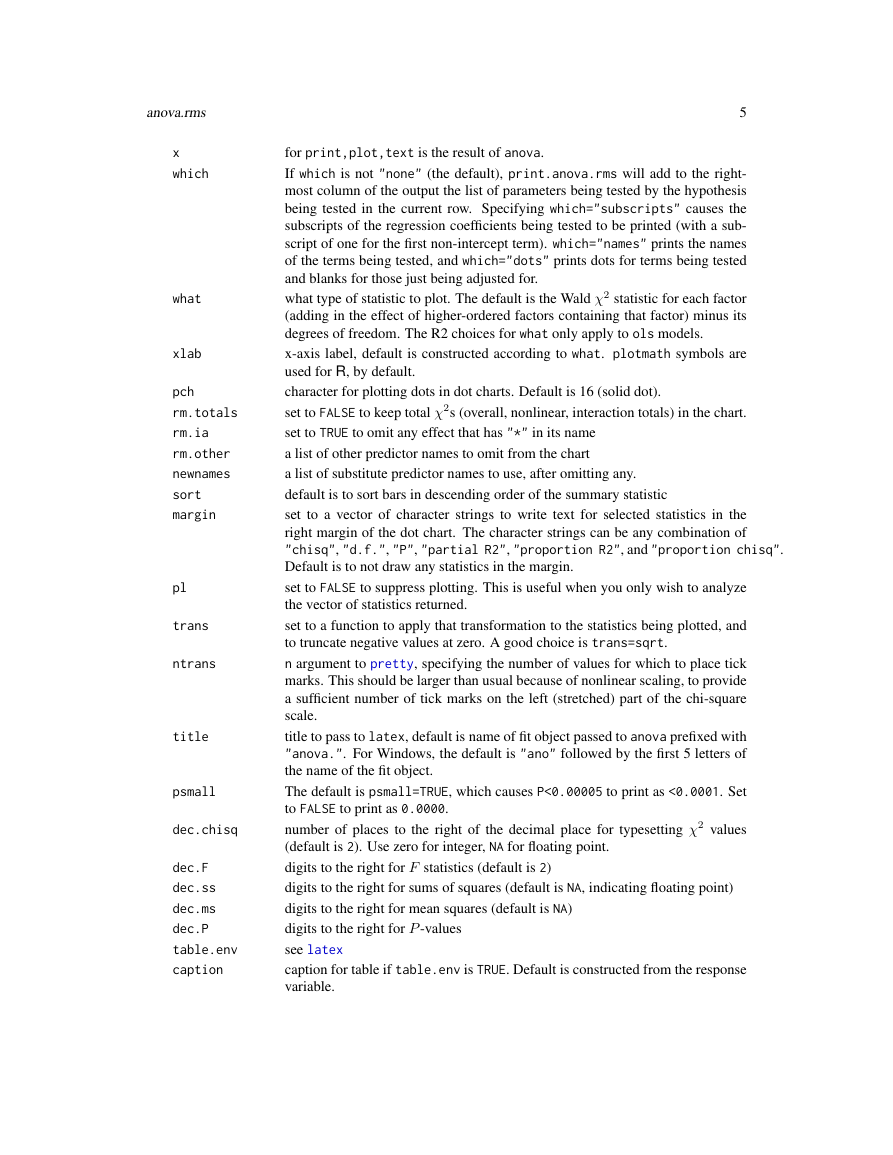
for print,plot,text is the result of anova.
If which is not "none" (the default), print.anova.rms will add to the right-
most column of the output the list of parameters being tested by the hypothesis
being tested in the current row. Specifying which="subscripts" causes the
subscripts of the regression coefficients being tested to be printed (with a sub-
script of one for the first non-intercept term). which="names" prints the names
of the terms being tested, and which="dots" prints dots for terms being tested
and blanks for those just being adjusted for.
what type of statistic to plot. The default is the Wald χ2 statistic for each factor
(adding in the effect of higher-ordered factors containing that factor) minus its
degrees of freedom. The R2 choices for what only apply to ols models.
x-axis label, default is constructed according to what. plotmath symbols are
used for R, by default.
character for plotting dots in dot charts. Default is 16 (solid dot).
set to FALSE to keep total χ2s (overall, nonlinear, interaction totals) in the chart.
set to TRUE to omit any effect that has "*" in its name
a list of other predictor names to omit from the chart
a list of substitute predictor names to use, after omitting any.
default is to sort bars in descending order of the summary statistic
set to a vector of character strings to write text for selected statistics in the
right margin of the dot chart. The character strings can be any combination of
"chisq", "d.f.", "P", "partial R2", "proportion R2", and "proportion chisq".
Default is to not draw any statistics in the margin.
set to FALSE to suppress plotting. This is useful when you only wish to analyze
the vector of statistics returned.
set to a function to apply that transformation to the statistics being plotted, and
to truncate negative values at zero. A good choice is trans=sqrt.
n argument to pretty, specifying the number of values for which to place tick
marks. This should be larger than usual because of nonlinear scaling, to provide
a sufficient number of tick marks on the left (stretched) part of the chi-square
scale.
title to pass to latex, default is name of fit object passed to anova prefixed with
"anova.". For Windows, the default is "ano" followed by the first 5 letters of
the name of the fit object.
The default is psmall=TRUE, which causes P<0.00005 to print as <0.0001. Set
to FALSE to print as 0.0000.
number of places to the right of the decimal place for typesetting χ2 values
(default is 2). Use zero for integer, NA for floating point.
digits to the right for F statistics (default is 2)
digits to the right for sums of squares (default is NA, indicating floating point)
digits to the right for mean squares (default is NA)
digits to the right for P -values
see latex
caption for table if table.env is TRUE. Default is constructed from the response
variable.
�
6
Details
anova.rms
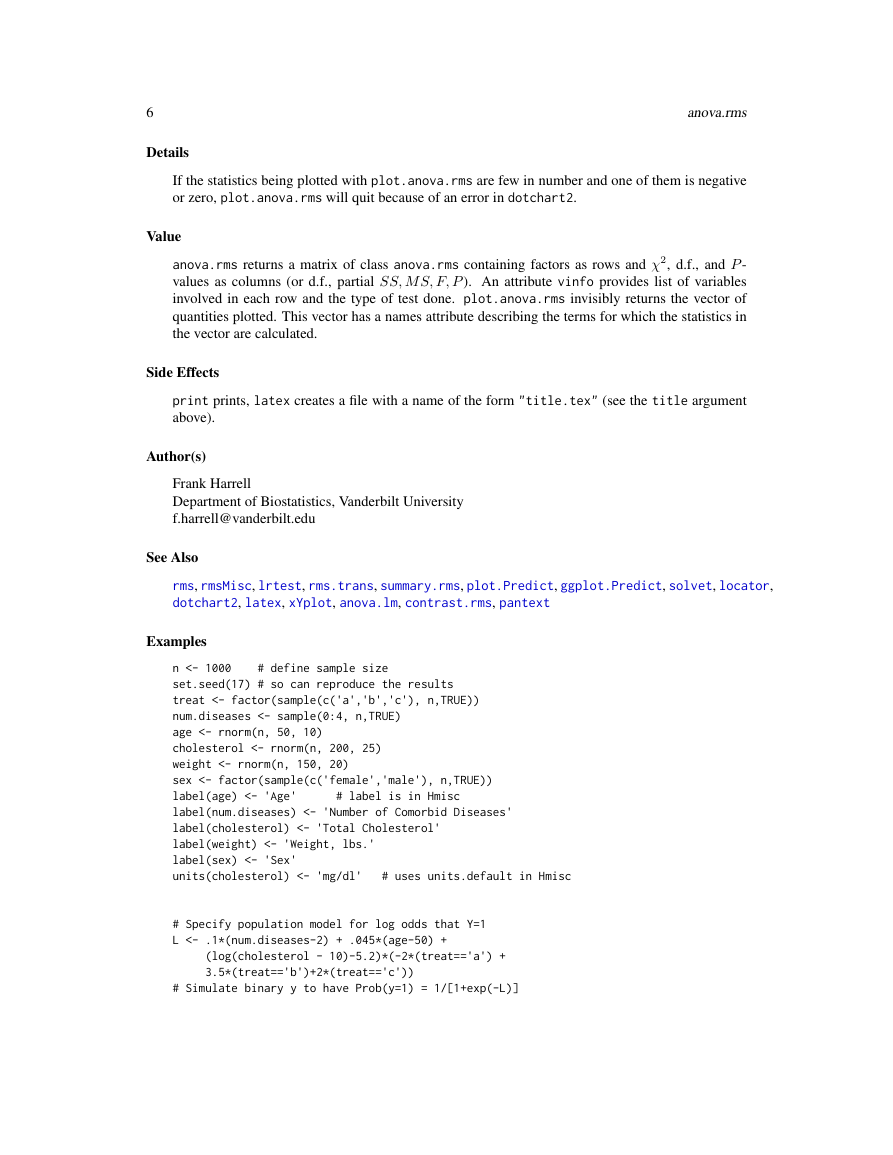
If the statistics being plotted with plot.anova.rms are few in number and one of them is negative
or zero, plot.anova.rms will quit because of an error in dotchart2.
Value
anova.rms returns a matrix of class anova.rms containing factors as rows and χ2, d.f., and P -
values as columns (or d.f., partial SS, M S, F, P ). An attribute vinfo provides list of variables
involved in each row and the type of test done. plot.anova.rms invisibly returns the vector of
quantities plotted. This vector has a names attribute describing the terms for which the statistics in
the vector are calculated.
Side Effects
print prints, latex creates a file with a name of the form "title.tex" (see the title argument
above).
Author(s)
Frank Harrell
Department of Biostatistics, Vanderbilt University
f.harrell@vanderbilt.edu
See Also
rms, rmsMisc, lrtest, rms.trans, summary.rms, plot.Predict, ggplot.Predict, solvet, locator,
dotchart2, latex, xYplot, anova.lm, contrast.rms, pantext
Examples
# define sample size
n <- 1000
set.seed(17) # so can reproduce the results
treat <- factor(sample(c(’a’,’b’,’c’), n,TRUE))
num.diseases <- sample(0:4, n,TRUE)
age <- rnorm(n, 50, 10)
cholesterol <- rnorm(n, 200, 25)
weight <- rnorm(n, 150, 20)
sex <- factor(sample(c(’female’,’male’), n,TRUE))
label(age) <- ’Age’
label(num.diseases) <- ’Number of Comorbid Diseases’
label(cholesterol) <- ’Total Cholesterol’
label(weight) <- ’Weight, lbs.’
label(sex) <- ’Sex’
units(cholesterol) <- ’mg/dl’
# label is in Hmisc
# uses units.default in Hmisc
# Specify population model for log odds that Y=1
L <- .1*(num.diseases-2) + .045*(age-50) +
(log(cholesterol - 10)-5.2)*(-2*(treat==’a’) +
3.5*(treat==’b’)+2*(treat==’c’))
# Simulate binary y to have Prob(y=1) = 1/[1+exp(-L)]
�
anova.rms
7
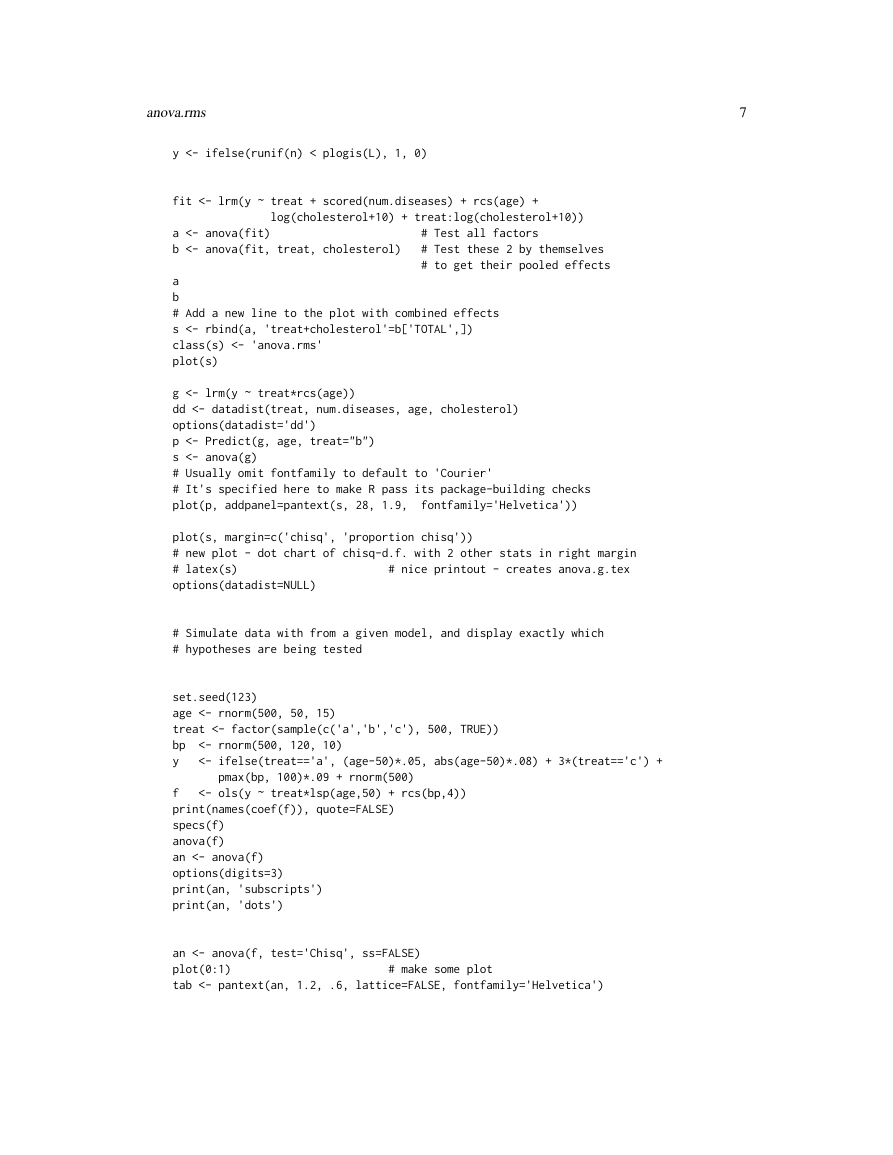
y <- ifelse(runif(n) < plogis(L), 1, 0)
fit <- lrm(y ~ treat + scored(num.diseases) + rcs(age) +
log(cholesterol+10) + treat:log(cholesterol+10))
a <- anova(fit)
b <- anova(fit, treat, cholesterol)
# Test all factors
# Test these 2 by themselves
# to get their pooled effects
a
b
# Add a new line to the plot with combined effects
s <- rbind(a, ’treat+cholesterol’=b[’TOTAL’,])
class(s) <- ’anova.rms’
plot(s)
g <- lrm(y ~ treat*rcs(age))
dd <- datadist(treat, num.diseases, age, cholesterol)
options(datadist=’dd’)
p <- Predict(g, age, treat="b")
s <- anova(g)
# Usually omit fontfamily to default to ’Courier’
# It’s specified here to make R pass its package-building checks
plot(p, addpanel=pantext(s, 28, 1.9,
fontfamily=’Helvetica’))
plot(s, margin=c(’chisq’, ’proportion chisq’))
# new plot - dot chart of chisq-d.f. with 2 other stats in right margin
# latex(s)
# nice printout - creates anova.g.tex
options(datadist=NULL)
# Simulate data with from a given model, and display exactly which
# hypotheses are being tested
set.seed(123)
age <- rnorm(500, 50, 15)
treat <- factor(sample(c(’a’,’b’,’c’), 500, TRUE))
bp
y
<- rnorm(500, 120, 10)
<- ifelse(treat==’a’, (age-50)*.05, abs(age-50)*.08) + 3*(treat==’c’) +
pmax(bp, 100)*.09 + rnorm(500)
<- ols(y ~ treat*lsp(age,50) + rcs(bp,4))
f
print(names(coef(f)), quote=FALSE)
specs(f)
anova(f)
an <- anova(f)
options(digits=3)
print(an, ’subscripts’)
print(an, ’dots’)
an <- anova(f, test=’Chisq’, ss=FALSE)
plot(0:1)
tab <- pantext(an, 1.2, .6, lattice=FALSE, fontfamily=’Helvetica’)
# make some plot
�
8
anova.rms
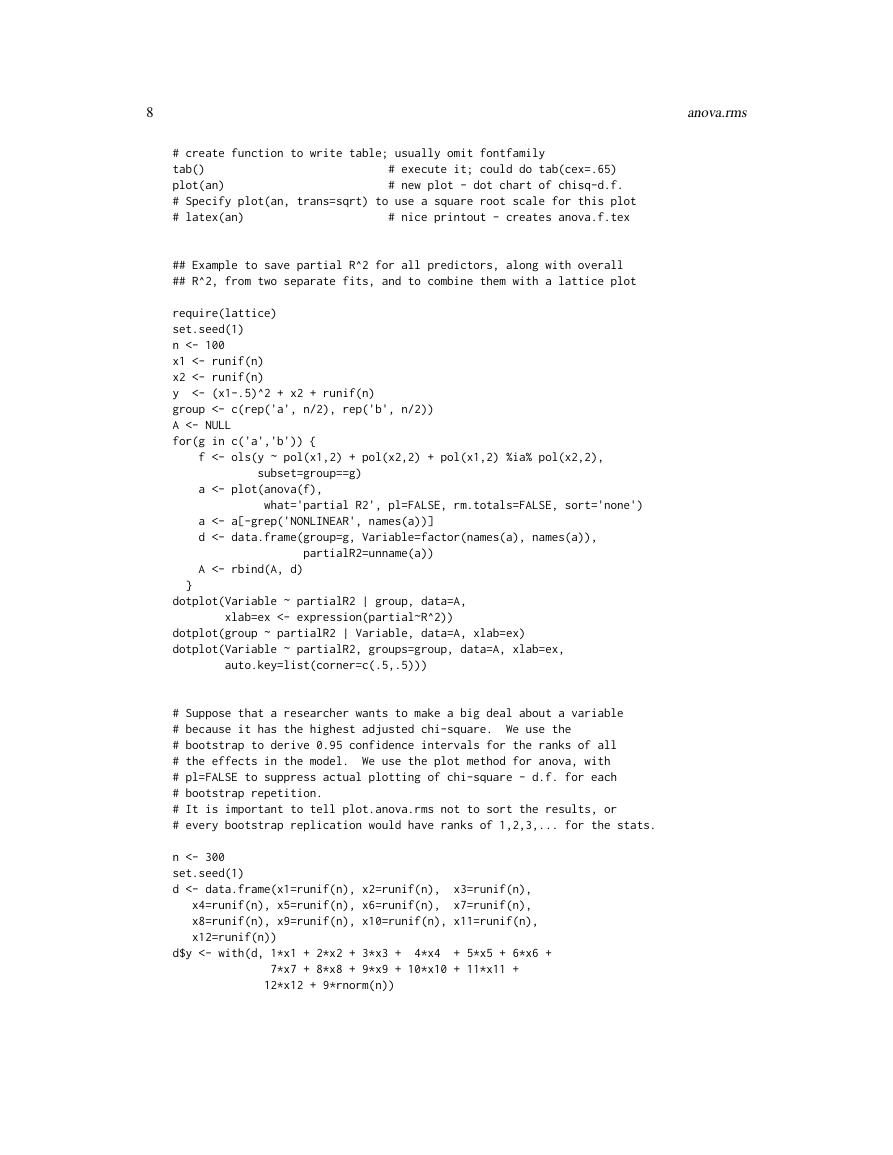
# create function to write table; usually omit fontfamily
tab()
plot(an)
# Specify plot(an, trans=sqrt) to use a square root scale for this plot
# nice printout - creates anova.f.tex
# latex(an)
# execute it; could do tab(cex=.65)
# new plot - dot chart of chisq-d.f.
## Example to save partial R^2 for all predictors, along with overall
## R^2, from two separate fits, and to combine them with a lattice plot
require(lattice)
set.seed(1)
n <- 100
x1 <- runif(n)
x2 <- runif(n)
y <- (x1-.5)^2 + x2 + runif(n)
group <- c(rep(’a’, n/2), rep(’b’, n/2))
A <- NULL
for(g in c(’a’,’b’)) {
f <- ols(y ~ pol(x1,2) + pol(x2,2) + pol(x1,2) %ia% pol(x2,2),
subset=group==g)
a <- plot(anova(f),
what=’partial R2’, pl=FALSE, rm.totals=FALSE, sort=’none’)
a <- a[-grep(’NONLINEAR’, names(a))]
d <- data.frame(group=g, Variable=factor(names(a), names(a)),
partialR2=unname(a))
A <- rbind(A, d)
}
dotplot(Variable ~ partialR2 | group, data=A,
xlab=ex <- expression(partial~R^2))
dotplot(group ~ partialR2 | Variable, data=A, xlab=ex)
dotplot(Variable ~ partialR2, groups=group, data=A, xlab=ex,
auto.key=list(corner=c(.5,.5)))
# Suppose that a researcher wants to make a big deal about a variable
# because it has the highest adjusted chi-square. We use the
# bootstrap to derive 0.95 confidence intervals for the ranks of all
# the effects in the model. We use the plot method for anova, with
# pl=FALSE to suppress actual plotting of chi-square - d.f. for each
# bootstrap repetition.
# It is important to tell plot.anova.rms not to sort the results, or
# every bootstrap replication would have ranks of 1,2,3,... for the stats.
n <- 300
set.seed(1)
x3=runif(n),
d <- data.frame(x1=runif(n), x2=runif(n),
x4=runif(n), x5=runif(n), x6=runif(n),
x7=runif(n),
x8=runif(n), x9=runif(n), x10=runif(n), x11=runif(n),
x12=runif(n))
d$y <- with(d, 1*x1 + 2*x2 + 3*x3 +
4*x4 + 5*x5 + 6*x6 +
7*x7 + 8*x8 + 9*x9 + 10*x10 + 11*x11 +
12*x12 + 9*rnorm(n))
�


 2023年江西萍乡中考道德与法治真题及答案.doc
 2012年重庆南川中考生物真题及答案.doc
 2013年江西师范大学地理学综合及文艺理论基础考研真题.doc
 2020年四川甘孜小升初语文真题及答案I卷.doc
 2020年注册岩土工程师专业基础考试真题及答案.doc
 2023-2024学年福建省厦门市九年级上学期数学月考试题及答案.doc
 2021-2022学年辽宁省沈阳市大东区九年级上学期语文期末试题及答案.doc
 2022-2023学年北京东城区初三第一学期物理期末试卷及答案.doc
 2018上半年江西教师资格初中地理学科知识与教学能力真题及答案.doc
 2012年河北国家公务员申论考试真题及答案-省级.doc
 2020-2021学年江苏省扬州市江都区邵樊片九年级上学期数学第一次质量检测试题及答案.doc
 2022下半年黑龙江教师资格证中学综合素质真题及答案.doc