See discussions, stats, and author profiles for this publication at: https://www.researchgate.net/publication/266911500
A Improved Vogel's Approximatio Method for
the Transportation Problem
Article in Mathematical and Computational Applications · August 2011
DOI: 10.3390/mca16020370
CITATIONS
12
2 authors:
READS
660
Serdar Korukoğlu
Ege University
Serkan Balli
Mugla Üniversitesi
49 PUBLICATIONS 383 CITATIONS
45 PUBLICATIONS 118 CITATIONS
SEE PROFILE
SEE PROFILE
Some of the authors of this publication are also working on these related projects:
Tabakalı Kompozit Plaklardaki Hasar Durumunun Yapay Zeka Teknikleri ile Analiz Edilmesi View
project
All content following this page was uploaded by Serkan Balli on 30 October 2015.
The user has requested enhancement of the downloaded file.
�
Mathematical and Computational Applications, Vol. 16, No. 2, pp. 370-381, 2011.
© Association for Scientific Research
Aҭ IMPROVED VOGEL’S APPROXIMATIOҭ METHOD
FOR THE TRAҭSPORTATIOҭ PROBLEM
1Department of Computer Engineering, Ege University, 35000, Bornova, Đzmir, Turkey
Serdar Korukoğlu1 and Serkan Ballı2
2Department of Statistics, Muğla University, 48187, Muğla, Turkey
serdar.korukoglu@ege.edu.tr
serkan@mu.edu.tr
Abstract- Determining efficient solutions for large scale transportation problems is an
important task in operations research. In this study, Vogel’s Approximation Method
(VAM) which is one of well-known transportation methods in the literature was
investigated to obtain more efficient initial solutions. A variant of VAM was proposed
by using total opportunity cost and regarding alternative allocation costs. Computational
experiments were carried out to evaluate VAM and improved version of VAM (IVAM).
It was seen that IVAM conspicuously obtains more efficient initial solutions for large
scale transportation problems. Performance of IVAM over VAM was discussed in terms
of iteration numbers and CPU times required to reach the optimal solutions.
Keywords- Transportation Problem, Integer Programming, Vogel’s Approximation
Method, Total Opportunity Cost, Simulation Experiments
1. IҭTRODUCTIOҭ
The transportation problem is a special kind of the network optimization
problems. It has the special data structure in solution characterized as a transportation
graph. Transportation models play an important role in logistics and supply chains.
The problem basically deals with the determination of a cost plan for transporting a
single commodity from a number of sources to a number of destinations [16]. The
purpose is to minimize the cost of shipping goods from one location to another so that
the needs of each arrival area are met and every shipping location operates within its
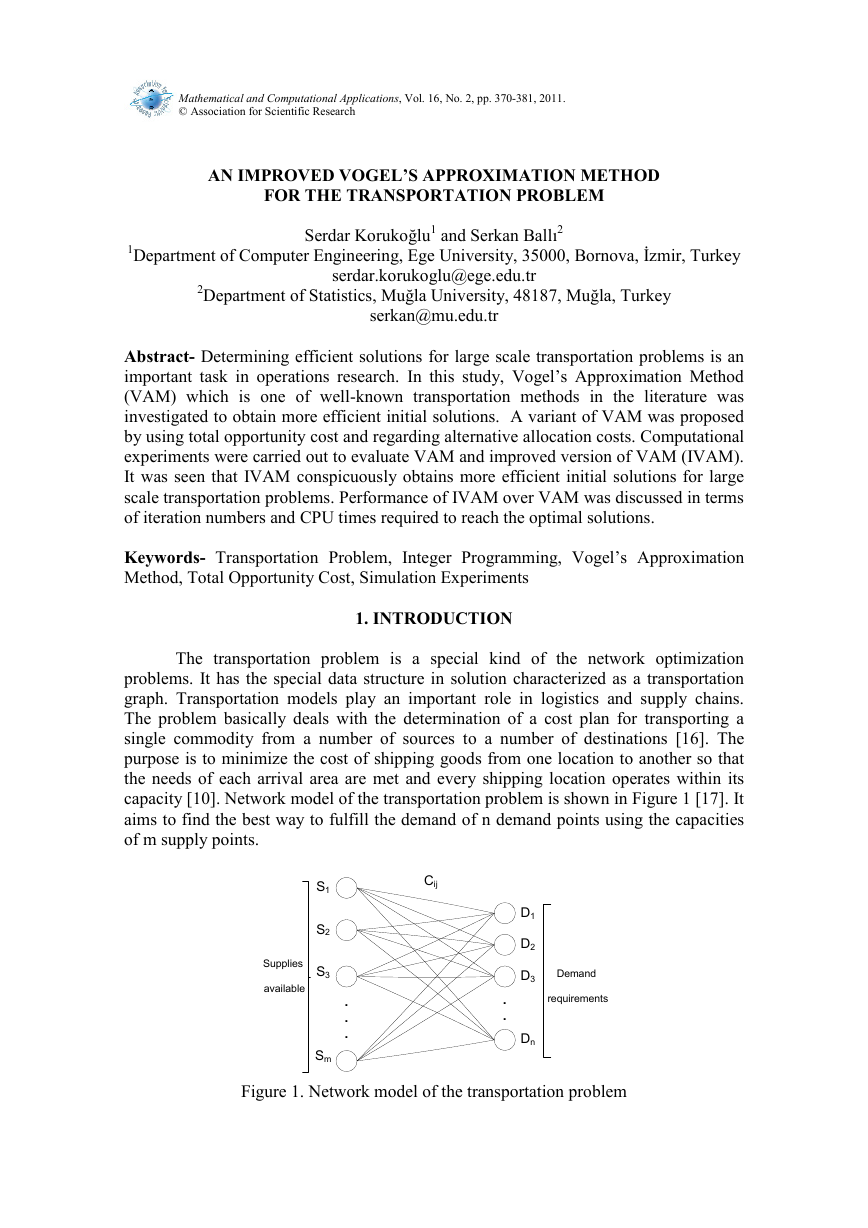
capacity [10]. Network model of the transportation problem is shown in Figure 1 [17]. It
aims to find the best way to fulfill the demand of n demand points using the capacities
of m supply points.
Cij
Supplies
available
S1
S2
S3
Sm
.
.
.
D1
D2
D3
Dn
.
.
Demand
requirements
Figure 1. Network model of the transportation problem
�
S. Korukoğlu and S. Ballı
371
ijx is number of
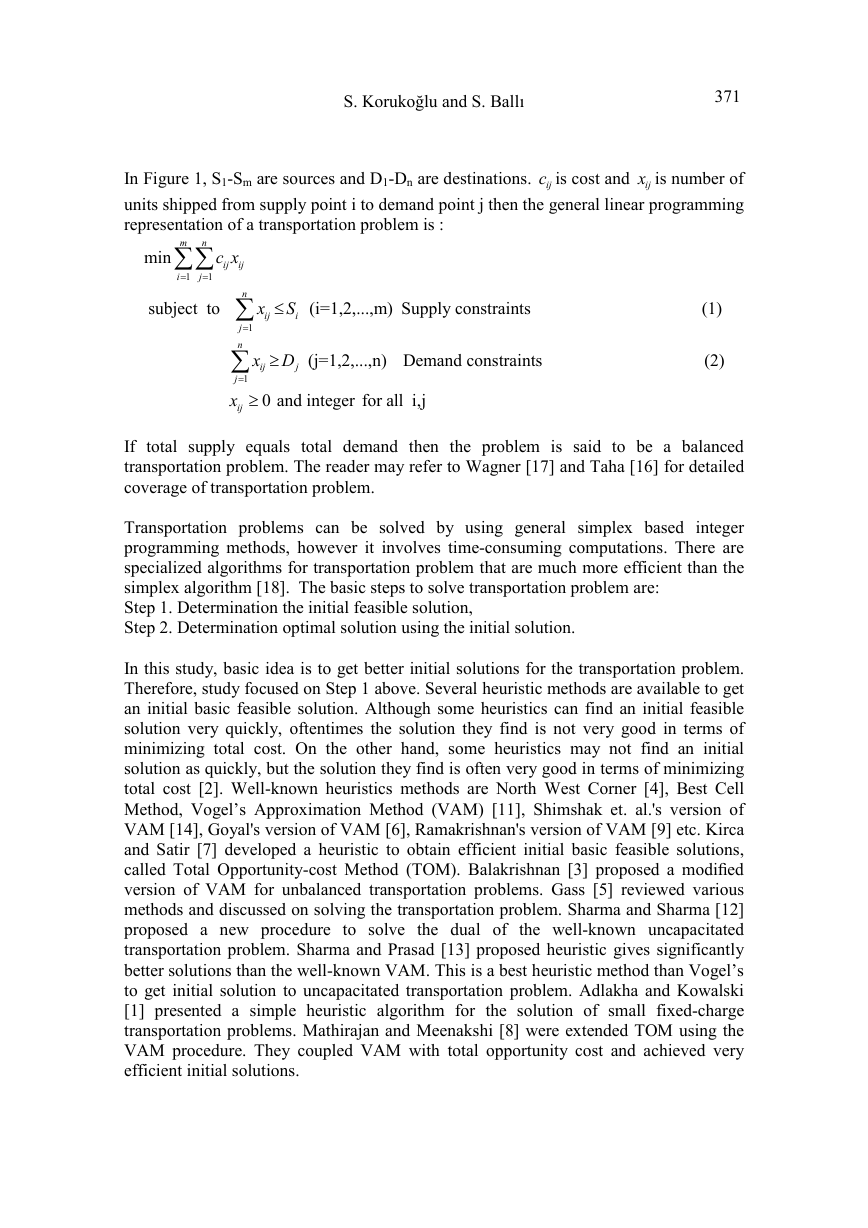
In Figure 1, S1-Sm are sources and D1-Dn are destinations.
units shipped from supply point i to demand point j then the general linear programming
representation of a transportation problem is :
ijc is cost and
m
n
min
∑ ∑
c x
ij
ij
1
=
i
1
=
j
n
subject to
≤∑
S
x
ij
(i=1,2,...,m)
Supply constraints (1)
i
1
=
j
n
≥∑
x D
ij
j
(j=1,2,...,n)
Demand constraints (2)
1
=
j
ijx ≥
0 and integer for all i,j
If total supply equals total demand then the problem is said to be a balanced
transportation problem. The reader may refer to Wagner [17] and Taha [16] for detailed
coverage of transportation problem.
Transportation problems can be solved by using general simplex based integer
programming methods, however it involves time-consuming computations. There are
specialized algorithms for transportation problem that are much more efficient than the
simplex algorithm [18]. The basic steps to solve transportation problem are:
Step 1. Determination the initial feasible solution,
Step 2. Determination optimal solution using the initial solution.
In this study, basic idea is to get better initial solutions for the transportation problem.
Therefore, study focused on Step 1 above. Several heuristic methods are available to get
an initial basic feasible solution. Although some heuristics can find an initial feasible
solution very quickly, oftentimes the solution they find is not very good in terms of
minimizing total cost. On the other hand, some heuristics may not find an initial
solution as quickly, but the solution they find is often very good in terms of minimizing
total cost [2]. Well-known heuristics methods are North West Corner [4], Best Cell
Method, Vogel’s Approximation Method (VAM) [11], Shimshak et. al.'s version of
VAM [14], Goyal's version of VAM [6], Ramakrishnan's version of VAM [9] etc. Kirca
and Satir [7] developed a heuristic to obtain efficient initial basic feasible solutions,
called Total Opportunity-cost Method (TOM). Balakrishnan [3] proposed a modified
version of VAM for unbalanced transportation problems. Gass [5] reviewed various
methods and discussed on solving the transportation problem. Sharma and Sharma [12]
proposed a new procedure to solve the dual of the well-known uncapacitated
transportation problem. Sharma and Prasad [13] proposed heuristic gives significantly
better solutions than the well-known VAM. This is a best heuristic method than Vogel’s
to get initial solution to uncapacitated transportation problem. Adlakha and Kowalski
[1] presented a simple heuristic algorithm for the solution of small fixed-charge
transportation problems. Mathirajan and Meenakshi [8] were extended TOM using the
VAM procedure. They coupled VAM with total opportunity cost and achieved very
efficient initial solutions.
�
An Improved Vogel’s Approximation Method
372
In this paper, VAM was improved by using total opportunity cost and regarding
alternative allocation costs. Mathirajan and Meenakshi [8] applied VAM on the total
opportunity cost matrix. In addition to this method, improved VAM (IVAM) considers
highest three penalty costs and calculates alternative allocation costs in VAM
procedure. Then it selects minimum one of them.
Paper is organized as follows. VAM is summarized and illustrated with solving a
sample transportation problem in the following section. IVAM is explained in the third
section. In the fourth section, simulation experiments are given and performance of
IVAM over VAM is discussed. Results are clarified in fifth section.
2. VOGEL’S APPROXIMATIOҭ METHOD (VAM)
VAM is a heuristic and usually provides a better starting solution than other
methods. Application of VAM to a given problem does not guarantee that an optimal
solution will result. However, a very good solution is invariably obtained with
comparatively little effort [15]. In fact, VAM generally yields an optimum or close to
optimum starting solution for small sized transportation problems [16].
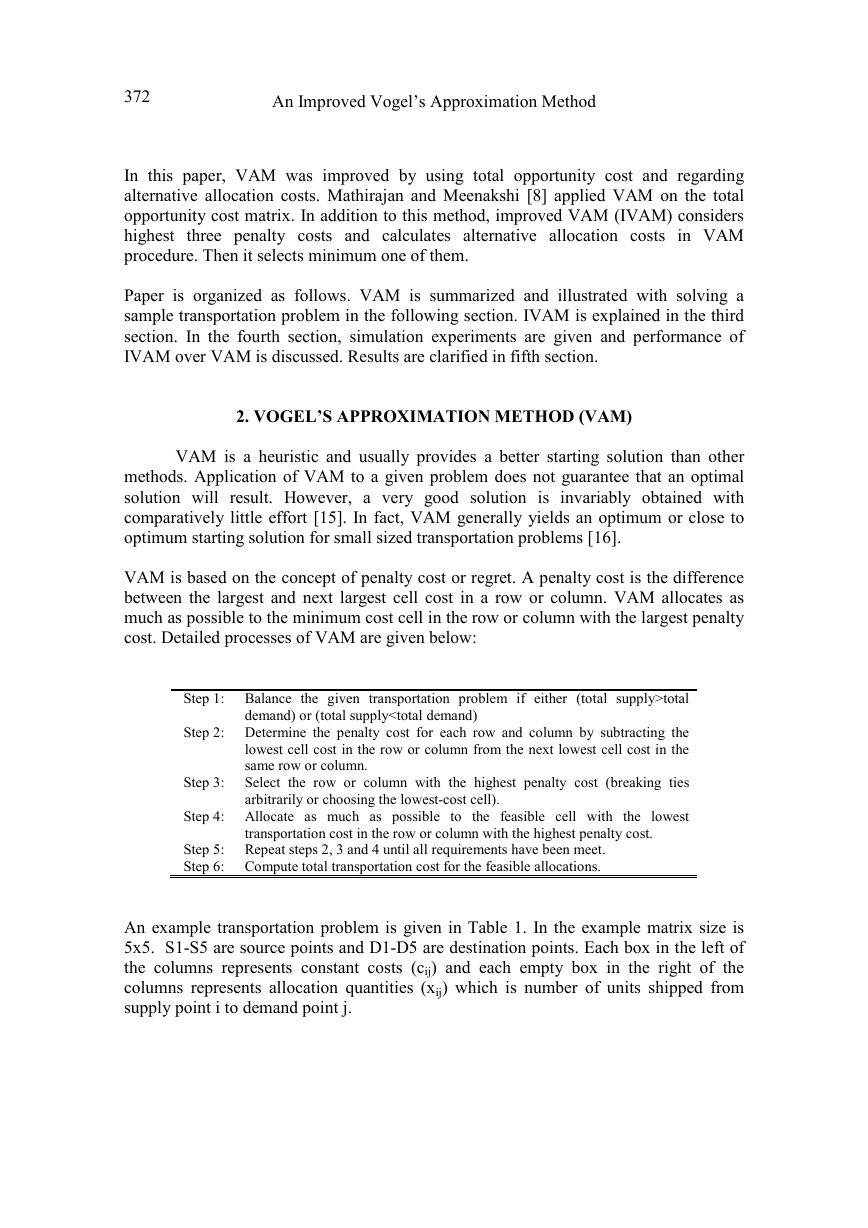
VAM is based on the concept of penalty cost or regret. A penalty cost is the difference
between the largest and next largest cell cost in a row or column. VAM allocates as
much as possible to the minimum cost cell in the row or column with the largest penalty
cost. Detailed processes of VAM are given below:
Step 1: Balance the given transportation problem if either (total supply>total
demand) or (total supply
S. Korukoğlu and S. Ballı
373
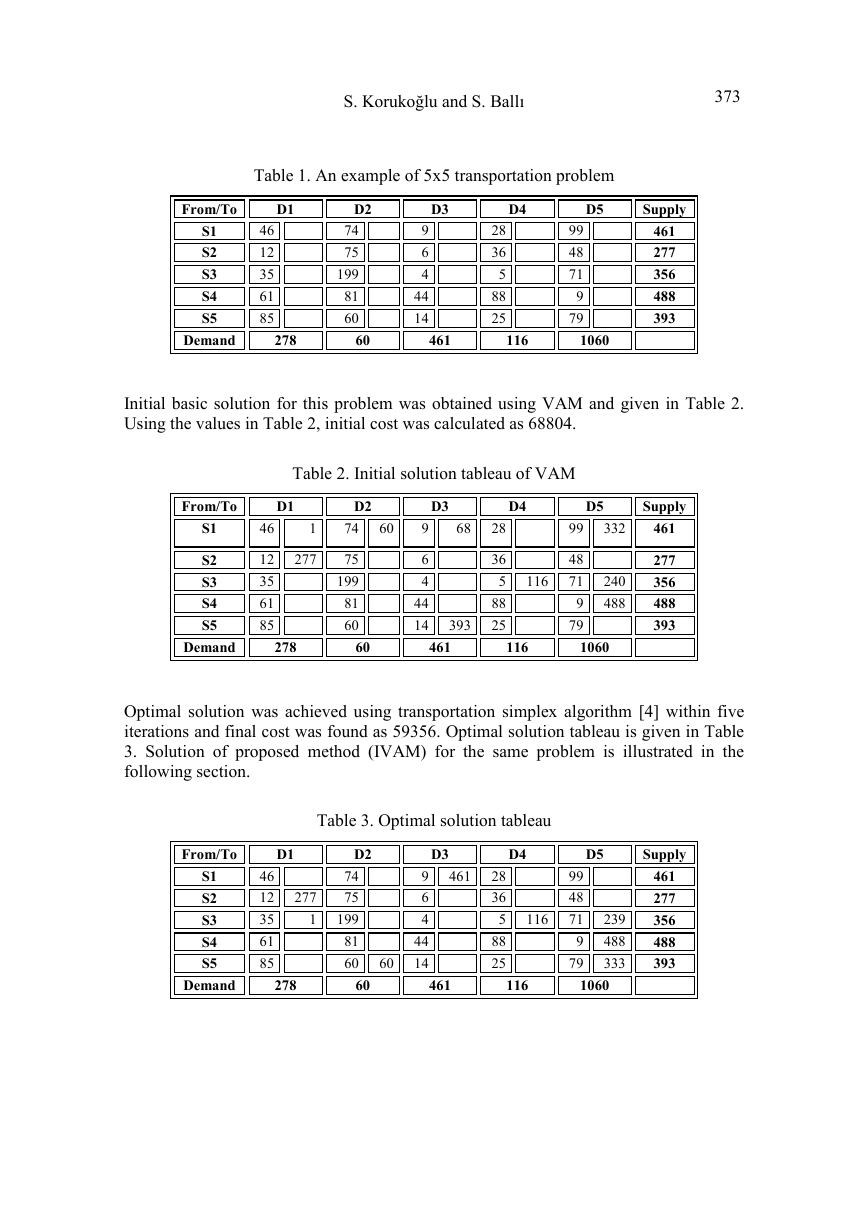
Table 1. An example of 5x5 transportation problem
From/To
D1
D2
D3
D4
D5
Supply
S1
S2
S3
S4
S5
46
12
35
61
85
74
75
199
81
60
9
6
4
44
14
28
36
5
88
25
99
48
71
9
79
Demand
278
60
461
116
1060
461
277
356
488
393
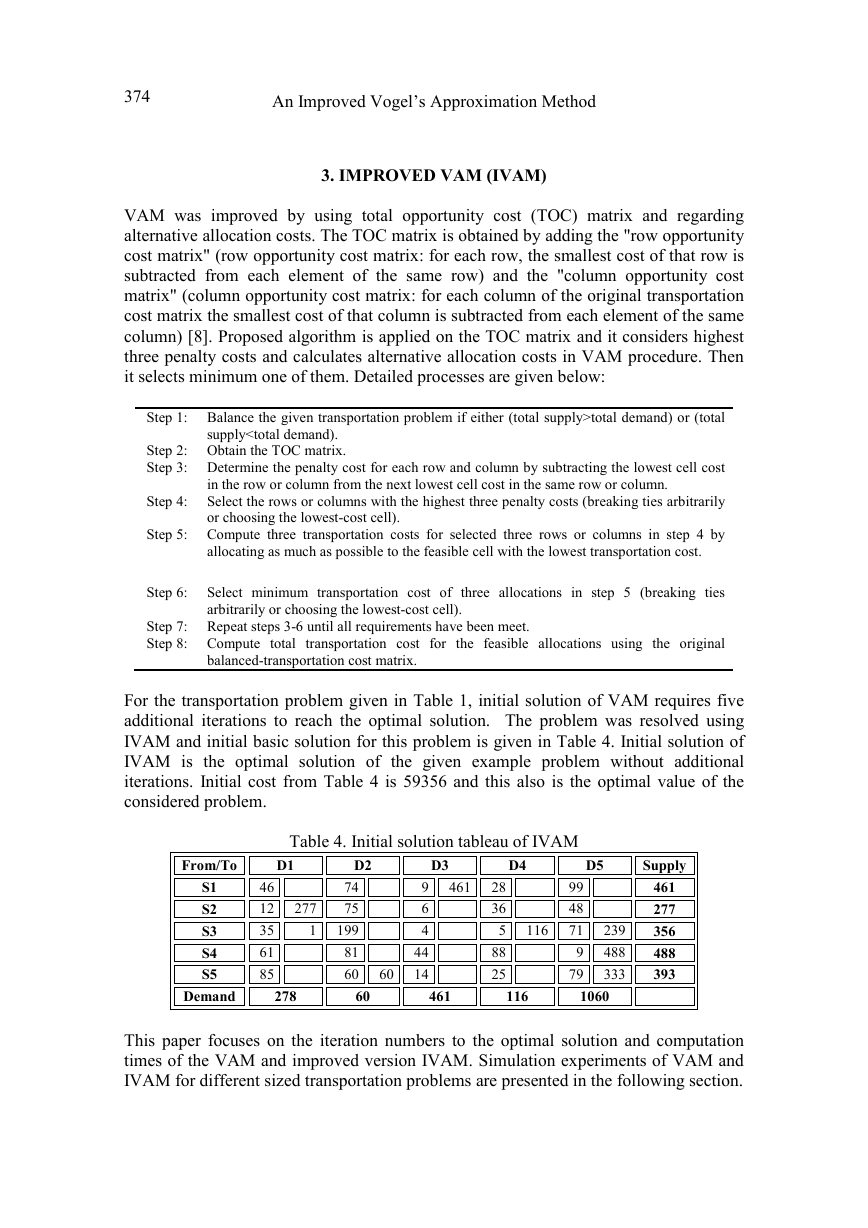
Initial basic solution for this problem was obtained using VAM and given in Table 2.
Using the values in Table 2, initial cost was calculated as 68804.
Table 2. Initial solution tableau of VAM
From/To
D1
D2
D3
D4
D5
Supply
S1
S2
S3
S4
S5
46
12
35
61
85
1
74
60
9
68
28
99
332
461
277
75
199
81
60
6
4
44
14
393
36
5
88
25
116
48
71
9
79
240
488
277
356
488
393
Demand
278
60
461
116
1060
Optimal solution was achieved using transportation simplex algorithm [4] within five
iterations and final cost was found as 59356. Optimal solution tableau is given in Table
3. Solution of proposed method (IVAM) for the same problem is illustrated in the
following section.
Table 3. Optimal solution tableau
From/To
D1
D2
D3
D4
D5
Supply
S1
S2
S3
S4
S5
46
12
35
61
85
277
1
74
75
199
81
60
60
9
6
4
44
14
461
28
36
5
88
25
116
99
48
71
9
79
239
488
333
461
277
356
488
393
Demand
278
60
461
116
1060
�
An Improved Vogel’s Approximation Method
374
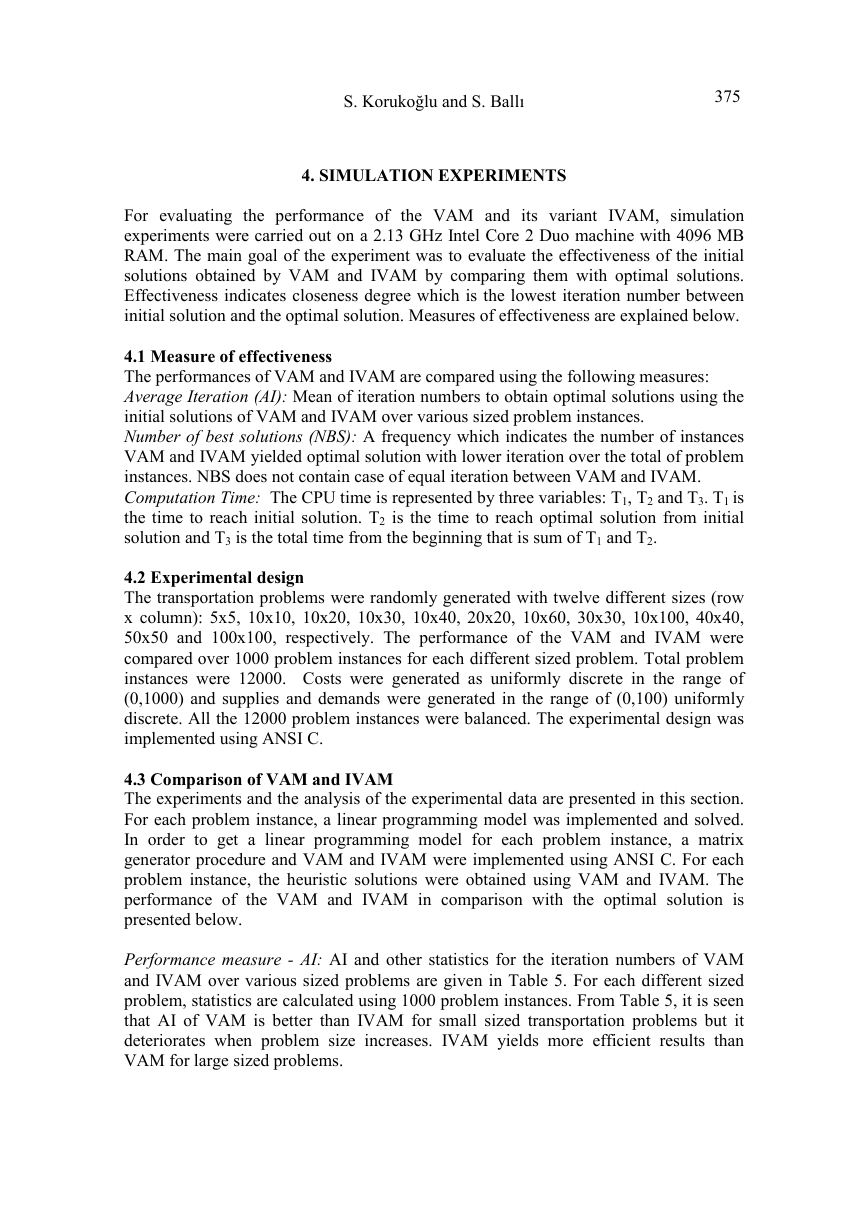
3. IMPROVED VAM (IVAM)
VAM was improved by using total opportunity cost (TOC) matrix and regarding
alternative allocation costs. The TOC matrix is obtained by adding the "row opportunity
cost matrix" (row opportunity cost matrix: for each row, the smallest cost of that row is
subtracted from each element of the same row) and the "column opportunity cost
matrix" (column opportunity cost matrix: for each column of the original transportation
cost matrix the smallest cost of that column is subtracted from each element of the same
column) [8]. Proposed algorithm is applied on the TOC matrix and it considers highest
three penalty costs and calculates alternative allocation costs in VAM procedure. Then
it selects minimum one of them. Detailed processes are given below:
Step 1: Balance the given transportation problem if either (total supply>total demand) or (total
supply
S. Korukoğlu and S. Ballı
375
4. SIMULATIOҭ EXPERIMEҭTS
For evaluating the performance of the VAM and its variant IVAM, simulation
experiments were carried out on a 2.13 GHz Intel Core 2 Duo machine with 4096 MB
RAM. The main goal of the experiment was to evaluate the effectiveness of the initial
solutions obtained by VAM and IVAM by comparing them with optimal solutions.
Effectiveness indicates closeness degree which is the lowest iteration number between
initial solution and the optimal solution. Measures of effectiveness are explained below.
4.1 Measure of effectiveness
The performances of VAM and IVAM are compared using the following measures:
Average Iteration (AI): Mean of iteration numbers to obtain optimal solutions using the
initial solutions of VAM and IVAM over various sized problem instances.
̱umber of best solutions (̱BS): A frequency which indicates the number of instances
VAM and IVAM yielded optimal solution with lower iteration over the total of problem
instances. NBS does not contain case of equal iteration between VAM and IVAM.
Computation Time: The CPU time is represented by three variables: T1, T2 and T3. T1 is
the time to reach initial solution. T2 is the time to reach optimal solution from initial
solution and T3 is the total time from the beginning that is sum of T1 and T2.
4.2 Experimental design
The transportation problems were randomly generated with twelve different sizes (row
x column): 5x5, 10x10, 10x20, 10x30, 10x40, 20x20, 10x60, 30x30, 10x100, 40x40,
50x50 and 100x100, respectively. The performance of the VAM and IVAM were
compared over 1000 problem instances for each different sized problem. Total problem
instances were 12000. Costs were generated as uniformly discrete in the range of
(0,1000) and supplies and demands were generated in the range of (0,100) uniformly
discrete. All the 12000 problem instances were balanced. The experimental design was
implemented using ANSI C.
4.3 Comparison of VAM and IVAM
The experiments and the analysis of the experimental data are presented in this section.
For each problem instance, a linear programming model was implemented and solved.
In order to get a linear programming model for each problem instance, a matrix
generator procedure and VAM and IVAM were implemented using ANSI C. For each
problem instance, the heuristic solutions were obtained using VAM and IVAM. The
performance of the VAM and IVAM in comparison with the optimal solution is
presented below.
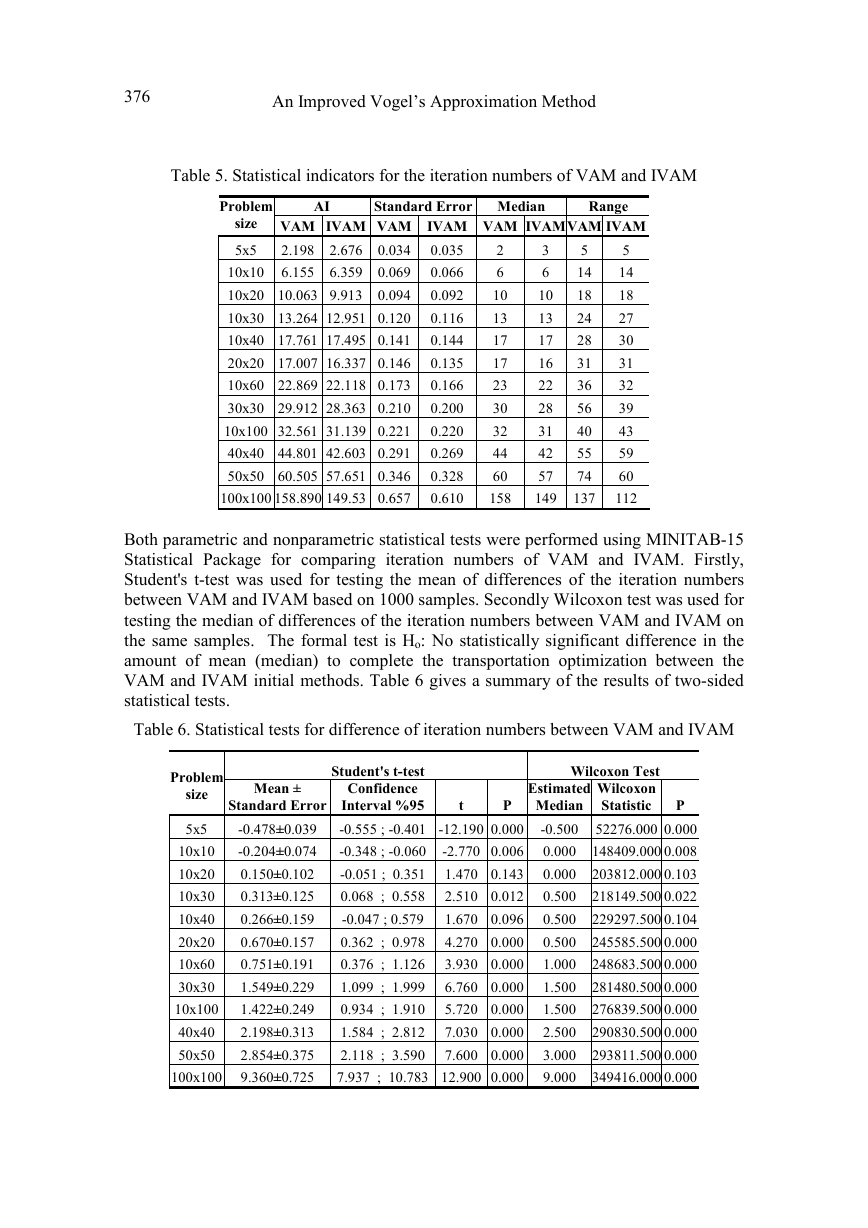
Performance measure - AI: AI and other statistics for the iteration numbers of VAM
and IVAM over various sized problems are given in Table 5. For each different sized
problem, statistics are calculated using 1000 problem instances. From Table 5, it is seen
that AI of VAM is better than IVAM for small sized transportation problems but it
deteriorates when problem size increases. IVAM yields more efficient results than
VAM for large sized problems.
�
An Improved Vogel’s Approximation Method
376
Table 5. Statistical indicators for the iteration numbers of VAM and IVAM
Problem
AI
Standard Error Median
Range
size VAM IVAM VAM
IVAM VAM IVAM VAM IVAM
2.198 2.676 0.034
5x5
10x10 6.155 6.359 0.069
10x20 10.063 9.913 0.094
10x30 13.264 12.951 0.120
10x40 17.761 17.495 0.141
20x20 17.007 16.337 0.146
10x60 22.869 22.118 0.173
30x30 29.912 28.363 0.210
10x100 32.561 31.139 0.221
40x40 44.801 42.603 0.291
50x50 60.505 57.651 0.346
100x100 158.890 149.53 0.657
0.035
0.066
0.092
0.116
0.144
0.135
0.166
0.200
0.220
0.269
0.328
0.610
2
6
10
13
17
17
23
30
32
44
60
158
5
3
14
6
18
10
24
13
28
17
31
16
36
22
56
28
40
31
55
42
74
57
149 137
5
14
18
27
30
31
32
39
43
59
60
112
Both parametric and nonparametric statistical tests were performed using MINITAB-15
Statistical Package for comparing iteration numbers of VAM and IVAM. Firstly,
Student's t-test was used for testing the mean of differences of the iteration numbers
between VAM and IVAM based on 1000 samples. Secondly Wilcoxon test was used for
testing the median of differences of the iteration numbers between VAM and IVAM on
the same samples. The formal test is Ho: No statistically significant difference in the
amount of mean (median) to complete the transportation optimization between the
VAM and IVAM initial methods. Table 6 gives a summary of the results of two-sided
statistical tests.
Table 6. Statistical tests for difference of iteration numbers between VAM and IVAM
Problem
size
5x5
10x10
10x20
10x30
10x40
20x20
10x60
30x30
10x100
40x40
50x50
100x100
Student's t-test
Mean ±
Standard Error
Confidence
Interval %95
t
P
Wilcoxon Test
Wilcoxon
Statistic
Estimated
Median
P
-0.478±0.039
-0.204±0.074
0.150±0.102
0.313±0.125
0.266±0.159
0.670±0.157
0.751±0.191
1.549±0.229
1.422±0.249
2.198±0.313
2.854±0.375
9.360±0.725
-0.555 ; -0.401 -12.190 0.000
-0.348 ; -0.060
-2.770 0.006
1.470 0.143
-0.051 ; 0.351
2.510 0.012
0.068 ; 0.558
-0.047 ; 0.579
1.670 0.096
4.270 0.000
0.362 ; 0.978
3.930 0.000
0.376 ; 1.126
1.099 ; 1.999
6.760 0.000
5.720 0.000
0.934 ; 1.910
7.030 0.000
1.584 ; 2.812
2.118 ; 3.590
7.600 0.000
7.937 ; 10.783 12.900 0.000
-0.500 52276.000 0.000
0.000 148409.000 0.008
0.000 203812.000 0.103
0.500 218149.500 0.022
0.500 229297.500 0.104
0.500 245585.500 0.000
1.000 248683.500 0.000
1.500 281480.500 0.000
1.500 276839.500 0.000
2.500 290830.500 0.000
3.000 293811.500 0.000
9.000 349416.000 0.000
�


 2023年江西萍乡中考道德与法治真题及答案.doc
 2012年重庆南川中考生物真题及答案.doc
 2013年江西师范大学地理学综合及文艺理论基础考研真题.doc
 2020年四川甘孜小升初语文真题及答案I卷.doc
 2020年注册岩土工程师专业基础考试真题及答案.doc
 2023-2024学年福建省厦门市九年级上学期数学月考试题及答案.doc
 2021-2022学年辽宁省沈阳市大东区九年级上学期语文期末试题及答案.doc
 2022-2023学年北京东城区初三第一学期物理期末试卷及答案.doc
 2018上半年江西教师资格初中地理学科知识与教学能力真题及答案.doc
 2012年河北国家公务员申论考试真题及答案-省级.doc
 2020-2021学年江苏省扬州市江都区邵樊片九年级上学期数学第一次质量检测试题及答案.doc
 2022下半年黑龙江教师资格证中学综合素质真题及答案.doc