logo资料库

Data_Mining_with_R__Learning_with_Case_Studies.pdf

第1页 / 共306页
第2页 / 共306页
第3页 / 共306页
第4页 / 共306页
第5页 / 共306页
第6页 / 共306页
第7页 / 共306页
第8页 / 共306页
资料共306页,剩余部分请下载后查看
Front Cover
Data Mining with R , Learning with Case Studies
Contents
1 Introduction
2 Predicting Algae Blooms
3 Predicting Stock Market Returns
4 Detecting Fraudulent Transactions
5 Classifying Microarray Samples
Bibliography
Preface
Acknowledgments
List of Figures
List of Tables
Chapter 1: Introduction
1.1 How to Read This Book?
1.2 A Short Introduction to
1.2.1 Starting with R
1.2.2 R Objects
1.2.3 Vectors
1.2.4 Vectorization
1.2.5 Factors
1.2.6 Generating Sequences
1.2.7 Sub-Setting
1.2.8 Matrices and Arrays
1.2.9 Lists
1.2.10 Data Frames
1.2.11 Creating New Functions
1.2.12 Objects, Classes, and Methods
1.2.13 Managing Your Sessions
1.3 A Short Introduction to
Chapter 2: Predicting Algae Blooms
2.1 Problem Description and Objectives
2.2 Data Description
2.3 Loading the Data into
2.4 Data Visualization and Summarization
2.5 Unknown Values
2.5.1 Removing the Observations with Unknown Values
2.5.2 Filling in the Unknowns with the Most Frequent Values
2.5.3 Filling in the Unknown Values by Exploring Correlations
2.5.4 Filling in the Unknown Values by Exploring Similarities between Cases
2.6 Obtaining Prediction Models
2.6.1 Multiple Linear Regression
2.6.2 Regression Trees
2.7 Model Evaluation and Selection
2.8 Predictions for the Seven Algae
2.9 Summary
Chapter 3: Predicting Stock Market Returns
3.1 Problem Description and Objectives
3.2 The Available Data
3.2.1 Handling Time-Dependent Data in R
3.2.2 Reading the Data from the CSV File
3.2.3 Getting the Data from the Web
3.2.4 Reading the Data from a MySQL Database
3.2.4.1 Loading the Data into R Running on Windows
3.2.4.2 Loading the Data into R Running on Linux
3.3 De.ning the Prediction Tasks
3.3.1 What to Predict?
FIGURE 3.1
3.3.2 Which Predictors?
FIGURE 3.2
3.3.3 The Prediction Tasks
3.3.4 Evaluation Criteria
TABLE 3.1
Predictions
True
Values
3.4 The Prediction Models
3.4.1 How Will the Training Data Be Used?
FIGURE 3.3
3.4.2 The Modeling Tools
3.4.2.1 Arti.cial Neural Networks
3.4.2.2 Support Vector Machines
FIGURE 3.4
x
y
x
y
3.4.2.3 Multivariate Adaptive Regression Splines
x
FIGURE 3.5
3.5 From Predictions into Actions
3.5.1 How Will the Predictions Be Used?
3.5.2 Trading-Related Evaluation Criteria
3.5.3 Putting Everything Together: A Simulated Trader
FIGURE 3.6
3.6 Model Evaluation and Selection
3.6.1 Monte Carlo Estimates
FIGURE 3.7
3.6.2 Experimental Comparisons
3.6.3 Results Analysis
FIGURE 3.8
3.7 The Trading System
3.7.1 Evaluation of the Final Test Data
FIGURE 3.9
FIGURE 3.10
FIGURE 3.11
3.7.2 An Online Trading System
3.8 Summary
Chapter 4: Detecting Fraudulent Transactions
4.1 Problem Description and Objectives
4.2 The Available Data
4.2.1 Loading the Data into R
4.2.2 Exploring the Dataset
4.2.3 Data Problems
4.2.3.1 Unknown Values
4.2.3.2 Few Transactions of Some Products
4.3 De.ning the Data Mining Tasks
4.3.1 Di.erent Approaches to the Problem
4.3.1.1 Unsupervised Techniques
4.3.1.2 Supervised Techniques
4.3.1.3 Semi-Supervised Techniques
4.3.2 Evaluation Criteria
4.3.2.1 Precision and Recall
4.3.2.2 Lift Charts and Precision/Recall Curves
4.3.2.3 Normalized Distance to Typical Price
4.3.3 Experimental Methodology
4.4 Obtaining Outlier Rankings
4.4.1 Unsupervised Approaches
4.4.1.1 The Modi.ed Box Plot Rule
FIGURE 4.7
4.4.1.2 Local Outlier Factors (
)
FIGURE 4.8
4.4.1.3 Clustering-Based Outlier Rankings (
)
4.4.2 Supervised Approaches
FIGURE 4.9
4.4.2.1 The Class Imbalance Problem
FIGURE 4.10
4.4.2.2 Naive Bayes
FIGURE 4.11
FIGURE 4.12
4.4.2.3 AdaBoost
FIGURE 4.13
4.4.3 Semi-Supervised Approaches
FIGURE 4.14
FIGURE 4.15
4.5 Summary
Chapter 5: Classifying Microarray Samples
5.1 Problem Description and Objectives
5.1.1 Brief Background on Microarray Experiments
5.1.2 The ALL Dataset
5.2 The Available Data
5.2.1 Exploring the Dataset
5.3 Gene (Feature) Selection
5.3.1 Simple Filters Based on Distribution Properties
FIGURE 5.2
5.3.2 ANOVA Filters
FIGURE 5.3
5.3.3 Filtering Using Random Forests
5.3.4 Filtering Using Feature Clustering Ensembles
FIGURE 5.4
5.4 Predicting Cytogenetic Abnormalities
5.4.1 De.ning the Prediction Task
5.4.2 The Evaluation Metric
5.4.3 The Experimental Procedure
5.4.4 The Modeling Techniques
5.4.4.1 Random Forests
5.4.4.2 k-Nearest Neighbors
5.4.5 Comparing the Models
5.5 Summary
Bibliography
Subject Index
Index of Data Mining Topics
Index of R Functions
Back Cover
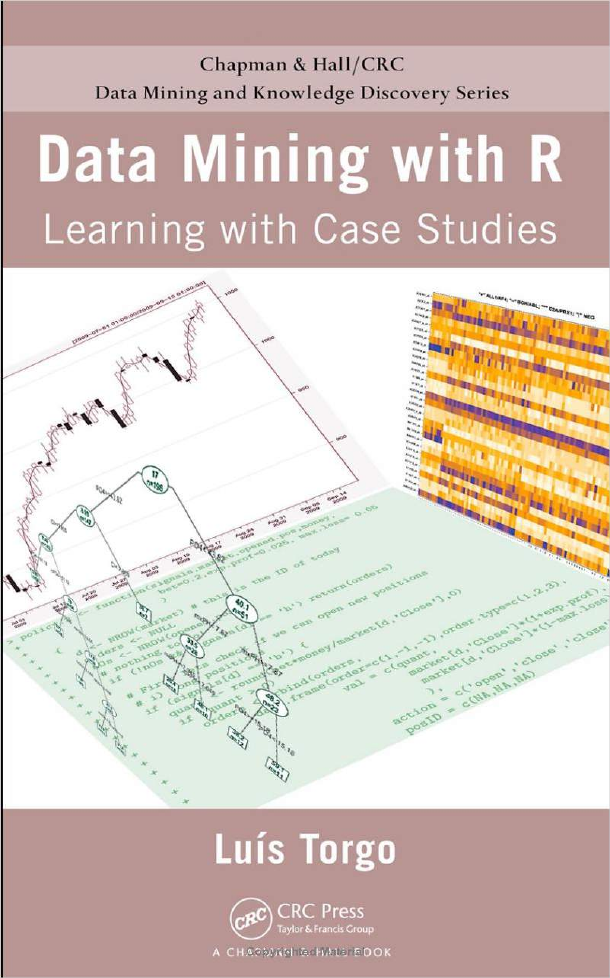
Data Mining with R Learning with Case Studies
Chapman & Hall/CRC Data Mining and Knowledge Discovery Series SERIES EDITOR Vipin Kumar University of Minnesota Department of Computer Science and Engineering Minneapolis, Minnesota, U.S.A AIMS AND SCOPE This series aims to capture new developments and applications in data mining and knowledge discovery, while summarizing the computational tools and techniques useful in data analysis. This series encourages the integration of mathematical, statistical, and computational methods and techniques through the publication of a broad range of textbooks, reference works, and hand- books. The inclusion of concrete examples and applications is highly encouraged. The scope of the series includes, but is not limited to, titles in the areas of data mining and knowledge discovery methods and applications, modeling, algorithms, theory and foundations, data and knowledge visualization, data mining systems and tools, and privacy and security issues. PUBLISHED TITLES UNDERSTANDING COMPLEX DATASETS: DATA MINING WITH MATRIX DECOMPOSITIONS David Skillicorn COMPUTATIONAL METHODS OF FEATURE SELECTION Huan Liu and Hiroshi Motoda CONSTRAINED CLUSTERING: ADVANCES IN ALGORITHMS, THEORY, AND APPLICATIONS Sugato Basu, Ian Davidson, and Kiri L. Wagstaff KNOWLEDGE DISCOVERY FOR COUNTERTERRORISM AND LAW ENFORCEMENT David Skillicorn MULTIMEDIA DATA MINING: A SYSTEMATIC INTRODUCTION TO CONCEPTS AND THEORY Zhongfei Zhang and Ruofei Zhang NEXT GENERATION OF DATA MINING Hillol Kargupta, Jiawei Han, Philip S. Yu, Rajeev Motwani, and Vipin Kumar DATA MINING FOR DESIGN AND MARKETING Yukio Ohsawa and Katsutoshi Yada THE TOP TEN ALGORITHMS IN DATA MINING Xindong Wu and Vipin Kumar BIOLOGICAL DATA MINING Jake Y. Chen and Stefano Lonardi INFORMATION DISCOVERY ON ELECTRONIC HEALTH RECORDS Vagelis Hristidis TEMPORAL DATA MINING Theophano Mitsa RELATIONAL DATA CLUSTERING: MODELS, ALGORITHMS, AND APPLICATIONS Bo Long, Zhongfei Zhang, and Philip S. Yu KNOWLEDGE DISCOVERY FROM DATA STREAMS João Gama STATISTICAL DATA MINING USING SAS APPLICATIONS, SECOND EDITION George Fernandez INTRODUCTION TO PRIVACY-PRESERVING DATA PUBLISHING: CONCEPTS AND TECHNIQUES Benjamin C. M. Fung, Ke Wang, Ada Wai-Chee Fu, and Philip S. Yu HANDBOOK OF EDUCATIONAL DATA MINING Cristóbal Romero, Sebastian Ventura, Mykola Pechenizkiy, and Ryan S.J.d. Baker GEOGRAPHIC DATA MINING AND KNOWLEDGE DISCOVERY, SECOND EDITION Harvey J. Miller and Jiawei Han DATA MINING WITH R: LEARNING WITH CASE STUDIES Luís Torgo TEXT MINING: CLASSIFICATION, CLUSTERING, AND APPLICATIONS Ashok N. Srivastava and Mehran Sahami
Chapman & Hall/CRC Data Mining and Knowledge Discovery Series Data Mining with R Learning with Case Studies Luís Torgo
Chapman & Hall/CRC Taylor & Francis Group 6000 Broken Sound Parkway NW, Suite 300 Boca Raton, FL 33487-2742 © 2011 by Taylor and Francis Group, LLC Chapman & Hall/CRC is an imprint of Taylor & Francis Group, an Informa business No claim to original U.S. Government works Printed in the United States of America on acid-free paper 10 9 8 7 6 5 4 3 2 1 International Standard Book Number: 978-1-4398-1018-7 (Hardback) This book contains information obtained from authentic and highly regarded sources. Reasonable efforts have been made to publish reliable data and information, but the author and publisher cannot assume responsibility for the validity of all materials or the consequences of their use. The authors and publishers have attempted to trace the copyright holders of all material reproduced in this publication and apologize to copyright holders if permission to publish in this form has not been obtained. If any copyright material has not been acknowledged please write and let us know so we may rectify in any future reprint. Except as permitted under U.S. Copyright Law, no part of this book may be reprinted, reproduced, transmit- ted, or utilized in any form by any electronic, mechanical, or other means, now known or hereafter invented, including photocopying, microfilming, and recording, or in any information storage or retrieval system, without written permission from the publishers. For permission to photocopy or use material electronically from this work, please access www.copyright. com (http://www.copyright.com/) or contact the Copyright Clearance Center, Inc. (CCC), 222 Rosewood Drive, Danvers, MA 01923, 978-750-8400. CCC is a not-for-profit organization that provides licenses and registration for a variety of users. For organizations that have been granted a photocopy license by the CCC, a separate system of payment has been arranged. Trademark Notice: Product or corporate names may be trademarks or registered trademarks, and are used only for identification and explanation without intent to infringe. Library of Congress Cataloging-in-Publication Data Torgo, Luís. Data mining with R : learning with case studies / Luís Torgo. p. cm. -- (Chapman & Hall/CRC data mining and knowledge discovery series) Includes bibliographical references and index. ISBN 978-1-4398-1018-7 (hardback) 1. Data mining--Case studies. 2. R (Computer program language) I. Title. QA76.9.D343T67 2010 006.3’12--dc22 Visit the Taylor & Francis Web site at http://www.taylorandfrancis.com and the CRC Press Web site at http://www.crcpress.com 2010036935
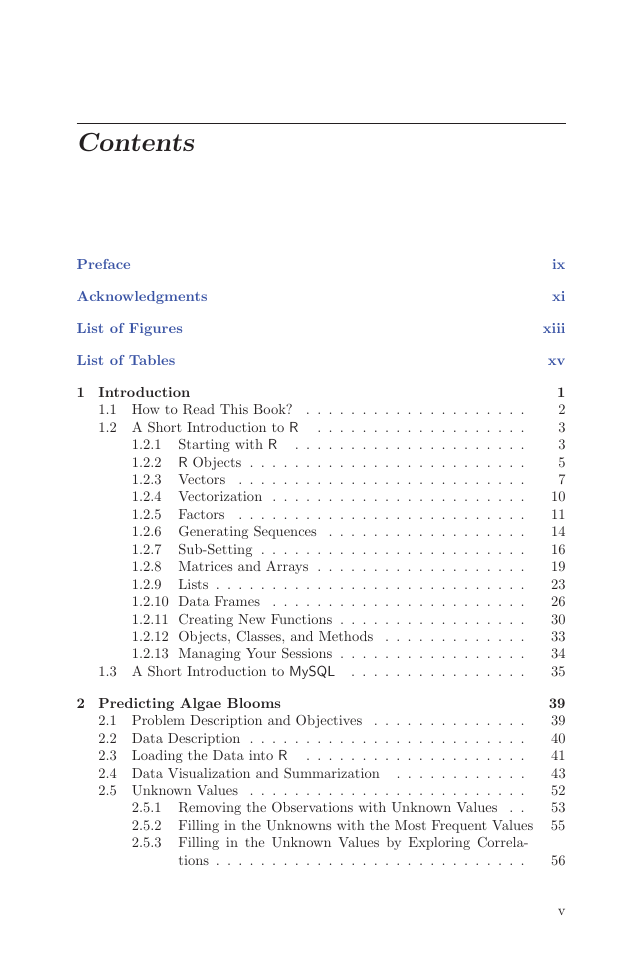
Contents Preface Acknowledgments List of Figures List of Tables 1 Introduction 1.1 How to Read This Book? . . . . . . . . . . . . . . . . . . . . 1.2 A Short Introduction to R . . . . . . . . . . . . . . . . . . . Starting with R . . . . . . . . . . . . . . . . . . . . . 1.2.1 1.2.2 R Objects . . . . . . . . . . . . . . . . . . . . . . . . . 1.2.3 Vectors . . . . . . . . . . . . . . . . . . . . . . . . . . 1.2.4 Vectorization . . . . . . . . . . . . . . . . . . . . . . . 1.2.5 Factors . . . . . . . . . . . . . . . . . . . . . . . . . . 1.2.6 Generating Sequences . . . . . . . . . . . . . . . . . . 1.2.7 Sub-Setting . . . . . . . . . . . . . . . . . . . . . . . . 1.2.8 Matrices and Arrays . . . . . . . . . . . . . . . . . . . 1.2.9 Lists . . . . . . . . . . . . . . . . . . . . . . . . . . . . 1.2.10 Data Frames . . . . . . . . . . . . . . . . . . . . . . . 1.2.11 Creating New Functions . . . . . . . . . . . . . . . . . 1.2.12 Objects, Classes, and Methods . . . . . . . . . . . . . 1.2.13 Managing Your Sessions . . . . . . . . . . . . . . . . . . . . . . . . . . . . . . . . . 1.3 A Short Introduction to MySQL 2 Predicting Algae Blooms 2.1 Problem Description and Objectives . . . . . . . . . . . . . . 2.2 Data Description . . . . . . . . . . . . . . . . . . . . . . . . . 2.3 Loading the Data into R . . . . . . . . . . . . . . . . . . . . 2.4 Data Visualization and Summarization . . . . . . . . . . . . . . . . . . . . . . . . . . . . . . . . . . . . . 2.5 Unknown Values . . 2.5.1 Removing the Observations with Unknown Values 2.5.2 Filling in the Unknowns with the Most Frequent Values 2.5.3 Filling in the Unknown Values by Exploring Correla- tions . . . . . . . . . . . . . . . . . . . . . . . . . . . . ix xi xiii xv 1 2 3 3 5 7 10 11 14 16 19 23 26 30 33 34 35 39 39 40 41 43 52 53 55 56 v
vi between Cases 2.6 Obtaining Prediction Models 2.5.4 Filling in the Unknown Values by Exploring Similarities . . . . . . . . . . . . . . . . . . . . . . . . . . . . . . . . . . . . . . . . 2.6.1 Multiple Linear Regression . . . . . . . . . . . . . . . 2.6.2 Regression Trees . . . . . . . . . . . . . . . . . . . . . . . . . . . . . . . . . . . . . 2.7 Model Evaluation and Selection 2.8 Predictions for the Seven Algae . . . . . . . . . . . . . . . . 2.9 Summary . . . . . . . . . . . . . . . . . . . . . . . . . . . . . 60 63 64 71 77 91 94 3 Predicting Stock Market Returns 3.1 Problem Description and Objectives 3.2 The Available Data 3.2.4.1 3.2.4.2 3.3 Defining the Prediction Tasks 3.4 The Prediction Models . . . . . . . . . . . . . . . . . . . . . . . . . . . . . . . . . . . . . 3.2.1 Handling Time-Dependent Data in R . . . . . . . . . 3.2.2 Reading the Data from the CSV File . . . . . . . . . . 3.2.3 Getting the Data from the Web . . . . . . . . . . . . . 3.2.4 Reading the Data from a MySQL Database . . . . . . 95 95 96 97 101 102 104 Loading the Data into R Running on Windows 105 Loading the Data into R Running on Linux . 107 108 . . . . . . . . . . . . . . . . . 108 3.3.1 What to Predict? . . . . . . . . . . . . . . . . . . . . . 3.3.2 Which Predictors? . . . . . . . . . . . . . . . . . . . . 111 117 3.3.3 The Prediction Tasks . . . . . . . . . . . . . . . . . . 118 3.3.4 Evaluation Criteria . . . . . . . . . . . . . . . . . . . . 120 . . . . . . . . . . . . . . . . . . . . . 3.4.1 How Will the Training Data Be Used? . . . . . . . . . 121 123 . . . . . . . . . . . . . . . . . . . 3.4.2 The Modeling Tools 123 . . . . . . . . . . 3.4.2.1 Artificial Neural Networks 126 3.4.2.2 Support Vector Machines . . . . . . . . . . . 3.4.2.3 Multivariate Adaptive Regression Splines . . 129 130 . . . . . . . . . . . . . . . . . 130 3.5.1 How Will the Predictions Be Used? . . . . . . . . . . . 132 3.5.2 Trading-Related Evaluation Criteria . . . . . . . . . . 3.5.3 Putting Everything Together: A Simulated Trader . . 133 141 . . . . . . . . . . . . . . . . 141 . . . . . . . . . . . . . . . . . 143 . . . . . . . . . . . . . . . 148 . . . . . . . . . . . . . . . . . . . . . 3.7 The Trading System . . . . . . . . . . . . . . . . . . . . . . . 156 156 3.7.1 Evaluation of the Final Test Data . . . . . . . . . . . 162 3.7.2 An Online Trading System . . . . . . . . . . . . . . . 3.8 Summary . . . . . . . . . . . . . . . . . . . . . . . . . . . . . 163 3.6 Model Evaluation and Selection 3.6.1 Monte Carlo Estimates 3.6.2 Experimental Comparisons 3.6.3 Results Analysis 3.5 From Predictions into Actions
4 Detecting Fraudulent Transactions 4.3 Defining the Data Mining Tasks 4.1 Problem Description and Objectives 4.2 The Available Data . . . . . . . . . . . . . . . . . . . . . . . . . . . . . . . . . . . . . 4.2.1 Loading the Data into R . . . . . . . . . . . . . . . . 4.2.2 Exploring the Dataset . . . . . . . . . . . . . . . . . . 4.2.3 Data Problems . . . . . . . . . . . . . . . . . . . . . . 4.2.3.1 Unknown Values . . . . . . . . . . . . . . . . 4.2.3.2 Few Transactions of Some Products . . . . . . . . . . . . . . . . . . . . . 4.3.1 Different Approaches to the Problem . . . . . . . . . . 4.3.1.1 Unsupervised Techniques . . . . . . . . . . . 4.3.1.2 Supervised Techniques . . . . . . . . . . . . . . . . . . . . . . Semi-Supervised Techniques 4.3.1.3 4.3.2 Evaluation Criteria . . . . . . . . . . . . . . . . . . . . 4.3.2.1 Precision and Recall . . . . . . . . . . . . . . 4.3.2.2 Lift Charts and Precision/Recall Curves . . . 4.3.2.3 Normalized Distance to Typical Price . . . . 4.3.3 Experimental Methodology . . . . . . . . . . . . . . . . . . . . . . . . . . . . . . . . . 4.4.1 Unsupervised Approaches . . . . . . . . . . . . . . . . 4.4.1.1 The Modified Box Plot Rule . . . . . . . . . Local Outlier Factors (LOF ) . . . . . . . . . 4.4.1.2 4.4.1.3 Clustering-Based Outlier Rankings (ORh) . Supervised Approaches . . . . . . . . . . . . . . . . . 4.4.2.1 The Class Imbalance Problem . . . . . . . . 4.4.2.2 Naive Bayes . . . . . . . . . . . . . . . . . . 4.4.2.3 AdaBoost . . . . . . . . . . . . . . . . . . . . Semi-Supervised Approaches . . . . . . . . . . . . . . 4.5 Summary . . . . . . . . . . . . . . . . . . . . . . . . . . . . . 4.4 Obtaining Outlier Rankings 4.4.2 4.4.3 5 Classifying Microarray Samples 5.1 Problem Description and Objectives 5.2 The Available Data 5.3 Gene (Feature) Selection . . . . . . . . . . . . . . 5.1.1 Brief Background on Microarray Experiments . . . . . . . . . . . . . . . . . . . . . . . . . 5.1.2 The ALL Dataset . . . . . . . . . . . . . . . . . . . . . . . 5.2.1 Exploring the Dataset . . . . . . . . . . . . . . . . . . . . . . . . . . . . . . . . . . . . . . 5.3.1 Simple Filters Based on Distribution Properties . . . . 5.3.2 ANOVA Filters . . . . . . . . . . . . . . . . . . . . . . 5.3.3 Filtering Using Random Forests . . . . . . . . . . . . 5.3.4 Filtering Using Feature Clustering Ensembles . . . . . . . . . . . . . . . . . . 5.4.1 Defining the Prediction Task . . . . . . . . . . . . . . 5.4.2 The Evaluation Metric . . . . . . . . . . . . . . . . . . 5.4.3 The Experimental Procedure . . . . . . . . . . . . . . 5.4 Predicting Cytogenetic Abnormalities vii 165 165 166 166 167 174 175 179 183 183 184 185 186 187 188 188 193 194 195 196 196 201 205 208 209 211 217 223 230 233 233 233 234 235 238 241 241 244 246 248 251 251 252 253
分享到:
收藏