Analysis of
Questionnaire
Data with R
Bruno Falissard
�
CRC Press
Taylor & Francis Group
6000 Broken Sound Parkway NW, Suite 300
Boca Raton, FL 33487-2742
© 2012 by Taylor & Francis Group, LLC
CRC Press is an imprint of Taylor & Francis Group, an Informa business
No claim to original U.S. Government works
Printed in the United States of America on acid-free paper
Version Date: 20110816
International Standard Book Number: 978-1-4398-1766-7 (Hardback)
This book contains information obtained from authentic and highly regarded sources. Reasonable
efforts have been made to publish reliable data and information, but the author and publisher cannot
assume responsibility for the validity of all materials or the consequences of their use. The authors and
publishers have attempted to trace the copyright holders of all material reproduced in this publication
and apologize to copyright holders if permission to publish in this form has not been obtained. If any
copyright material has not been acknowledged please write and let us know so we may rectify in any
future reprint.
Except as permitted under U.S. Copyright Law, no part of this book may be reprinted, reproduced,
transmitted, or utilized in any form by any electronic, mechanical, or other means, now known or
hereafter invented, including photocopying, microfilming, and recording, or in any information stor-
age or retrieval system, without written permission from the publishers.
For permission to photocopy or use material electronically from this work, please access www.copy-
right.com (http://www.copyright.com/) or contact the Copyright Clearance Center, Inc. (CCC), 222
Rosewood Drive, Danvers, MA 01923, 978-750-8400. CCC is a not-for-profit organization that pro-
vides licenses and registration for a variety of users. For organizations that have been granted a pho-
tocopy license by the CCC, a separate system of payment has been arranged.
Trademark Notice: Product or corporate names may be trademarks or registered trademarks, and are
used only for identification and explanation without intent to infringe.
Visit the Taylor & Francis Web site at
http://www.taylorandfrancis.com
and the CRC Press Web site at
http://www.crcpress.com
�
Contents
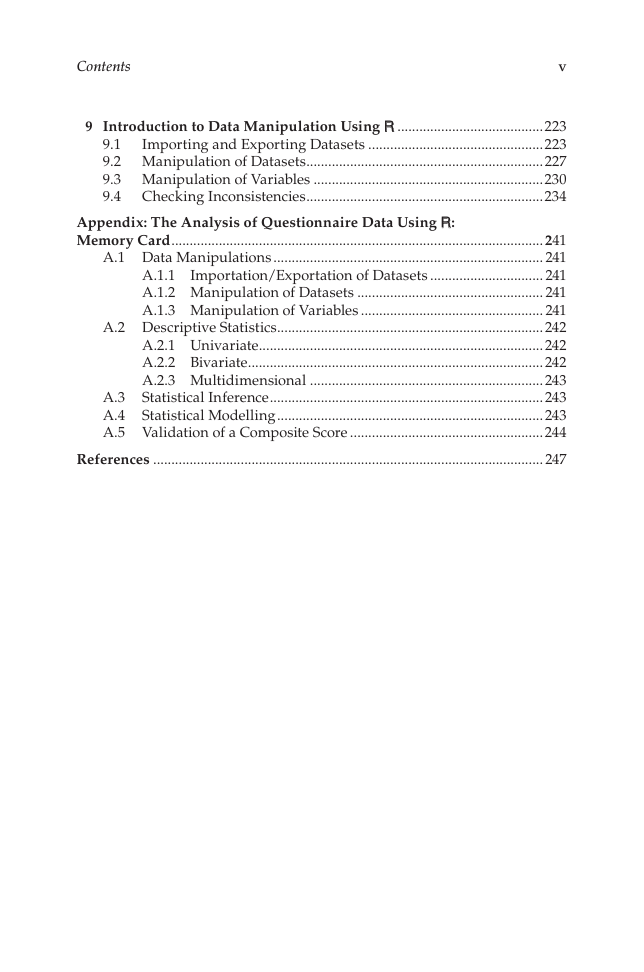
Preface..................................................................................................................... vii
Acknowledgments..................................................................................................ix
1 Introduction......................................................................................................1
1.1. About.Questionnaires...........................................................................1
1.2. Principles.of.Analysis............................................................................2
1.2.1. Overviews..................................................................................2
1.2.2.
Specific.Aspects.of.Questionnaire.Data.Analysis................3
1.3. The.Mental.Health.in.Prison.(MHP).Study........................................3
If.You.Are.a.Complete.R.Beginner......................................................4
1.4.
1.4.1. First.Steps...................................................................................4
1.4.2. Functions.from.Optional.Packages........................................7
1.4.3. When.Assistance.Is.Needed....................................................7
1.4.4.
Importing.a.Dataset..................................................................7
1.4.5. More.about.the.R.Language....................................................8
2 Description of Responses..............................................................................9
2.1. Description.Using.Summary.Statistics...............................................9
2.2.
Summary.Statistics.in.Subgroups..................................................... 13
2.3. Histograms............................................................................................ 17
2.4. Boxplots................................................................................................. 21
2.5. Barplots..................................................................................................23
2.6. Pie.Charts.............................................................................................. 24
2.7. Evolution.of.a.Numerical.Variable across Time.
(Temperature.Diagram).......................................................................25
3 Description of Relationships between Variables...................................29
3.1. Relative.Risks.and.Odds.Ratios.........................................................29
3.2. Correlation.Coefficients......................................................................33
3.3. Correlation.Matrices............................................................................34
3.4. Cartesian.Plots...................................................................................... 37
3.5. Hierarchical.Clustering....................................................................... 39
3.6. Principal.Component.Analysis..........................................................42
3.7. A.Spherical.Representation.of.a.Correlation.Matrix.......................47
3.8.
Focused.Principal.Component.Analysis..........................................48
4 Confidence Intervals and Statistical Tests of Hypothesis..................... 51
4.1. Confidence.Interval.of.a.Proportion.................................................. 51
4.2. Confidence.Interval.of.a.Mean...........................................................55
iii
�
iv
Contents
4.3. Confidence.Interval.of.a.Relative.Risk.or.an.Odds.Ratio...............56
4.4.
Statistical.Tests.of.Hypothesis:.Comparison.of.Two.Percentages....58
Statistical.Tests.of.Hypothesis:.Comparison.of.Two.Means............ 61
4.5.
Statistical.Tests.of.Hypothesis:.Correlation.Coefficient..................64
4.6.
Statistical.Tests.of.Hypothesis:.More.than.Two.Groups.................66
4.7.
Sample.Size.Requirements:.Survey.Perspective..............................71
4.8.
4.9.
Sample.Size.Requirements:.Inferential.Perspective........................72
5 Introduction to Linear, Logistic, Poisson, and Other Regression
Models..............................................................................................................75
5.1. Linear.Regression.Models.for.Quantitative.Outcomes..................75
5.2. Logistic.Regression.for.Binary.Outcome..........................................89
5.3. Logistic.Regression.for.a.Categorical Outcome.with.More.
than.Two.Levels...................................................................................97
5.4. Logistic.Regression.for.an.Ordered.Outcome............................... 101
5.5. Regression.Models.for.an.Outcome.Resulting.from.a.Count...... 104
6 About Statistical Modelling...................................................................... 113
6.1. Coding.Numerical.Predictors.......................................................... 113
6.2. Coding.Categorical.Predictors......................................................... 120
6.3. Choosing.Predictors.......................................................................... 130
6.4.
Interaction.Terms............................................................................... 139
6.5. Assessing.the.Relative.Importance.of.Predictors.......................... 148
6.6. Dealing.with.Missing.Data............................................................... 155
6.7. Bootstrap............................................................................................. 165
6.8. Random.Effects.and.Multilevel.Modelling.................................... 170
7.1.
7.2.
7 Principles for the Validation of a Composite Score.............................. 177
Item.Analysis.(1):.Distribution......................................................... 177
Item.Analysis.(2):.The.Multi-Trait.Multi-Method.Approach.to.
Confirm.a.Subscale.Structure.......................................................... 180
7.3. Assessing.the.Unidimensionality.of.a.Set.of.Items....................... 185
7.4.
Factor.Analysis.to.Explore.the.Structure.of.a.Set.of.Items........... 191
7.5. Measurement.Error.(1):.Internal.Consistency.and.the.
Cronbach.Alpha................................................................................. 197
7.6. Measurement.Error.(2):.Inter-Rater.Reliability.............................. 199
8 Introduction to Structural Equation Modelling...................................205
8.1. Linear.Regression.as.a.Particular.Instance of.Structural.
Equation.Modelling...........................................................................205
Factor.Analysis.as.a.Particular.Instance of.Structural.
Equation.Modelling...........................................................................209
Structural.Equation.Modelling.in.Practice.................................... 212
8.2.
8.3.
�
Contents
v
9 Introduction to Data Manipulation Using R.........................................223
Importing.and.Exporting.Datasets.................................................223
9.1.
9.2. Manipulation.of.Datasets..................................................................227
9.3. Manipulation.of.Variables................................................................230
9.4. Checking.Inconsistencies..................................................................234
Appendix: The Analysis of Questionnaire Data Using R:
Memory Card....................................................................................................... 241
A.1. Data.Manipulations........................................................................... 241
A.1.1.
Importation/Exportation.of.Datasets................................ 241
A.1.2. Manipulation.of.Datasets.................................................... 241
A.1.3. Manipulation.of.Variables................................................... 241
A.2. Descriptive.Statistics.......................................................................... 242
A.2.1. Univariate............................................................................... 242
A.2.2. Bivariate.................................................................................. 242
A.2.3. Multidimensional................................................................. 243
A.3. Statistical.Inference............................................................................ 243
A.4. Statistical.Modelling.......................................................................... 243
A.5. Validation.of.a.Composite.Score......................................................244
References............................................................................................................ 247
�
�
Preface
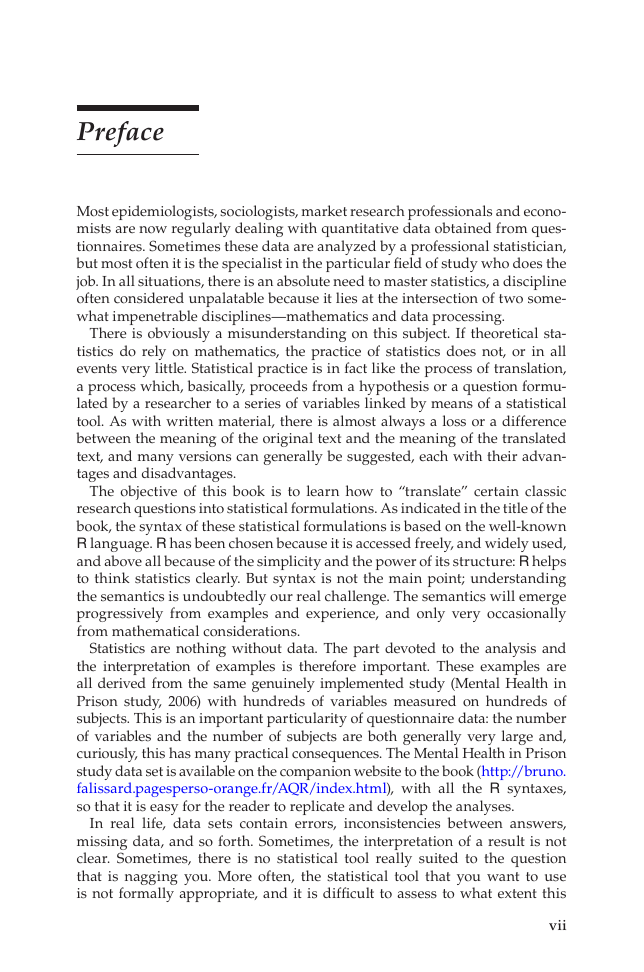
Most.epidemiologists,.sociologists,.market.research.professionals.and.econo-
mists.are.now.regularly.dealing.with.quantitative.data.obtained.from.ques-
tionnaires..Sometimes.these.data.are.analyzed.by.a.professional.statistician,.
but.most.often.it.is.the.specialist.in.the.particular.field.of.study.who.does.the.
job..In.all.situations,.there.is.an.absolute.need.to.master.statistics,.a.discipline.
often.considered.unpalatable.because.it.lies.at.the.intersection.of.two.some-
what.impenetrable.disciplines—mathematics.and.data.processing.
There.is.obviously.a.misunderstanding.on.this.subject..If.theoretical.sta-
tistics. do. rely. on. mathematics,. the. practice. of. statistics. does. not,. or. in. all.
events.very.little..Statistical.practice.is.in.fact.like.the.process.of.translation,.
a.process.which,.basically,.proceeds.from.a.hypothesis.or.a.question.formu-
lated.by.a.researcher.to.a.series.of.variables.linked.by.means.of.a.statistical.
tool..As with.written.material,.there.is.almost.always.a.loss.or.a.difference.
between.the.meaning.of.the.original.text.and.the.meaning.of.the.translated.
text,.and.many.versions.can.generally.be.suggested,.each.with.their.advan-
tages.and disadvantages.
The. objective. of. this. book. is. to. learn. how. to. “translate”. certain. classic.
research.questions.into.statistical.formulations..As.indicated.in.the.title.of.the.
book,.the.syntax.of.these.statistical.formulations.is.based.on.the.well-known.
R.language..R.has.been.chosen.because.it.is.accessed.freely,.and.widely.used,.
and.above.all.because.of.the.simplicity.and.the.power.of.its.structure:.R.helps.
to.think.statistics.clearly..But.syntax.is.not.the.main.point;.understanding.
the.semantics.is.undoubtedly.our.real.challenge..The.semantics.will.emerge.
.progressively. from. examples. and. experience,. and. only. very. occasionally.
from.mathematical.considerations.
Statistics. are. nothing. without. data.. The. part. devoted. to. the. analysis. and.
the. interpretation. of. examples. is. therefore. important.. These. examples. are.
all.derived.from.the.same.genuinely.implemented.study.(Mental.Health.in.
Prison. study,. 2006). with. hundreds. of. variables. measured. on. hundreds. of.
.subjects..This.is.an.important.particularity.of.questionnaire.data:.the..number.
of. .variables. and. the. number. of. subjects. are. both. generally. very. large. and,.
.curiously,.this.has.many.practical.consequences..The.Mental.Health.in.Prison.
study.data.set.is.available.on.the.companion.website.to.the.book.(http://bruno.
falissard.pagesperso-orange.fr/AQR/index.html),. with. all. the. R. syntaxes,.
so that.it.is.easy.for.the.reader.to.replicate.and.develop.the.analyses.
In. real. life,. data. sets. contain. errors,. inconsistencies. between. answers,.
missing.data,.and.so.forth..Sometimes,.the.interpretation.of.a.result.is.not.
clear.. Sometimes,. there. is. no. statistical. tool. really. suited. to. the. question.
that. is. .nagging. you.. More. often,. the. statistical. tool. that. you. want. to. use.
is.not.formally.appropriate,.and.it.is.difficult.to.assess.to.what.extent.this.
vii
�
viii
Preface
slight.inadequacy.affects.the.interpretation.of.results..These.are.also.certain.
.common.situations.that.will.be.tackled.in.the.following.pages..
I.hope.that.researchers.and.Master’s.or.PhD.students.will.find.material.
here. that. will. help. them. to. gain. some. insight. into. their. data.. This. is. the.
.ultimate.achievement.for.a.statistician.
�



 2023年江西萍乡中考道德与法治真题及答案.doc
 2012年重庆南川中考生物真题及答案.doc
 2013年江西师范大学地理学综合及文艺理论基础考研真题.doc
 2020年四川甘孜小升初语文真题及答案I卷.doc
 2020年注册岩土工程师专业基础考试真题及答案.doc
 2023-2024学年福建省厦门市九年级上学期数学月考试题及答案.doc
 2021-2022学年辽宁省沈阳市大东区九年级上学期语文期末试题及答案.doc
 2022-2023学年北京东城区初三第一学期物理期末试卷及答案.doc
 2018上半年江西教师资格初中地理学科知识与教学能力真题及答案.doc
 2012年河北国家公务员申论考试真题及答案-省级.doc
 2020-2021学年江苏省扬州市江都区邵樊片九年级上学期数学第一次质量检测试题及答案.doc
 2022下半年黑龙江教师资格证中学综合素质真题及答案.doc