logo资料库

SIL等级验证、评估技术专题培训课件.pdf

第1页 / 共182页
第2页 / 共182页
第3页 / 共182页
第4页 / 共182页
第5页 / 共182页
第6页 / 共182页
第7页 / 共182页
第8页 / 共182页
资料共182页,剩余部分请下载后查看
组合 3
组合 2
组合 1
第一讲 SIL等级验证、评估技术专题培训课程
第二讲 确定SIL等级的简化方程
第三讲 SIL等级验证方法
第四讲 SIL等级验证方法
附录B-应用指南最终版打印
ISA TR84.00.02 PART 2-2002
ISA TR84.00.02 PART 3-2002
Preface
Contents
Foreword
Introduction
1 Scope
2 References
3 Introduction to Fault Tree Analysis
4 Definition of terms and symbols
5 Assumptions for Fault Tree calculations for a SIF
6 Procedure
7 Base case example calculation for an SIF using FTA - without common cause failures and systematic failures
8 Example FTA calculations for an SIF including common cause and systematic failure
Annex A (informative) — Fault tree symbols and logic
Annex B (informative) — Mathematics
Annex C — Index
FIGURES
Figure I.1 — Safety lifecycle model
Figure I.2 — Definition of Safety Instrumented System (SIS)
Figure I.3 — ISA-TR84.00.02-2002 overall framework
Figure 7.1 — Base case example process diagram
Figure 7.2 — Base case example SIF configuration
Figure 7.3 — Fault tree for the determination of PFDavg
Figure 7.4 — Fault tree for the determination of MTTFspurious
Figure 8.1 — Fault tree for the determination of PFDavg transmitter miscalibrated
Figure 8.2 — Case 8.2 fault tree for the determination of PFDavg transmitter calibration with procedural safeguard
Figure A.1 — Examples of fault tree symbols
Figure B.1 — Intersection of PFDPT101A and PFDPT101B
Figure B.2 — The union of PFDPT101A and PFDPT101B
Figure B.3 — Representation of the states of a device
TABLES
Table 7.1 — Data used in fault tree analysis
Table 7.2 — Fault tree cut sets
Table 7.3 — Calculated data for each component
Table 7.4 — Percent contribution to PFDavg base case 7.1
Table 7.5 — Calculated data for each component
Table 7.6 — Average after logic solution time series (excerpt)
Table 7.7 — Percent contribution to MTTFspurious
Table 7.8 — Case 7.2 percent contribution to PFDavg (temperature switches tested every 3 months instead of annually)
Table 7.9 — Case 7.3 percent contribution to PFDavg (logic solver with higher MTTFD)
Table 8.1 — Case 8.1 percent contribution to PFDavg transmitter miscalibrated
Table 8.2 — Percent contribution to PFDavg
Table B.1 — PFDavg comparison of average before logic and average after logic
ISA TR84.00.02 PART 4-2002
Preface
Contents
Foreword
Introduction
1 Scope
2 References
3 Definitions
4 Introduction to Markov
5 Modeling and calculation procedures
6 Assumptions for Markov calculations for an SIF
7 Overview examples
8 Example 1
9 Quantifying a Markov model
10 Results Example 1
11 Example 2
12 Results Example 2
13 Example 3
14 Base example calculation for an SIF using Markov models
15 Results base example
16 Index
FIGURES
Figure I.1 — Safety life cycle model
Figure I.2 — Definition of Safety Instrumented System (SIS)
Figure I.3 — ISA-TR84.00.02-2002 overall framework
Figure 4.1 — Simple Markov model
Figure 8.1 — Example 1 (demand mode process)
Figure 8.2 — Fully developed Markov model - Example 1
Figure 8.3 — Simplified Markov model - Example 1
Figure 10.1 — PFD and sensitivity plot - Example 1
Figure 10.2 — Probability of spurious trip and sensitivity plot - Example 1
Figure 11.1 — Simplified Markov model with diagnostics - Example 2
Figure 12.1 — Probability of fail on demand and sensitivity plot with diagnostics - Example 2
Figure 12.2 — PFS and sensitivity plot with diagnostics - Example 2
Figure 13.1 — PFD before and after periodic and imperfect testing
Figure 14.1 — SIS process diagram - Base example
Figure 14.2 — SIS configuration - Base example
Figure 14.3 — Simplified Markov model - Base example
Figure 15.1 — Probability of failure on demand - Base example
Figure 15.2 — Probability of spurious trip - Base example
TABLES
Table 7.1 — Overview results examples
Table 8.1 — Resulting state after single failure - Example 1
Table 8.2 — Description of the different states of the SIS - Example 1
Table 11.1 — Resulting state after single failure with diagnostic capabilities - Examples 2
Table 11.2 — Description of the different states of the SIS - Example 2
Table 14.1 — Resulting state after single failure - Base example
Table 14.2 — Description of the different states of the SIS - Base example
2015/1/14 SIL等级验证、评估技术专题培训第一讲 第一讲: 功能安全相关标准知识 唐蓉唐蓉 2015.01 1 SIL等级验证、评估技术专题培训课程 第一讲简介 一 、 SIL等级验证、评估技术相关标准 三、 相关术语与定义 三、 SIL等级验证、评估计算相关参数 三、 SIL等级验证、评估计算相关参数 四、示例 2 1
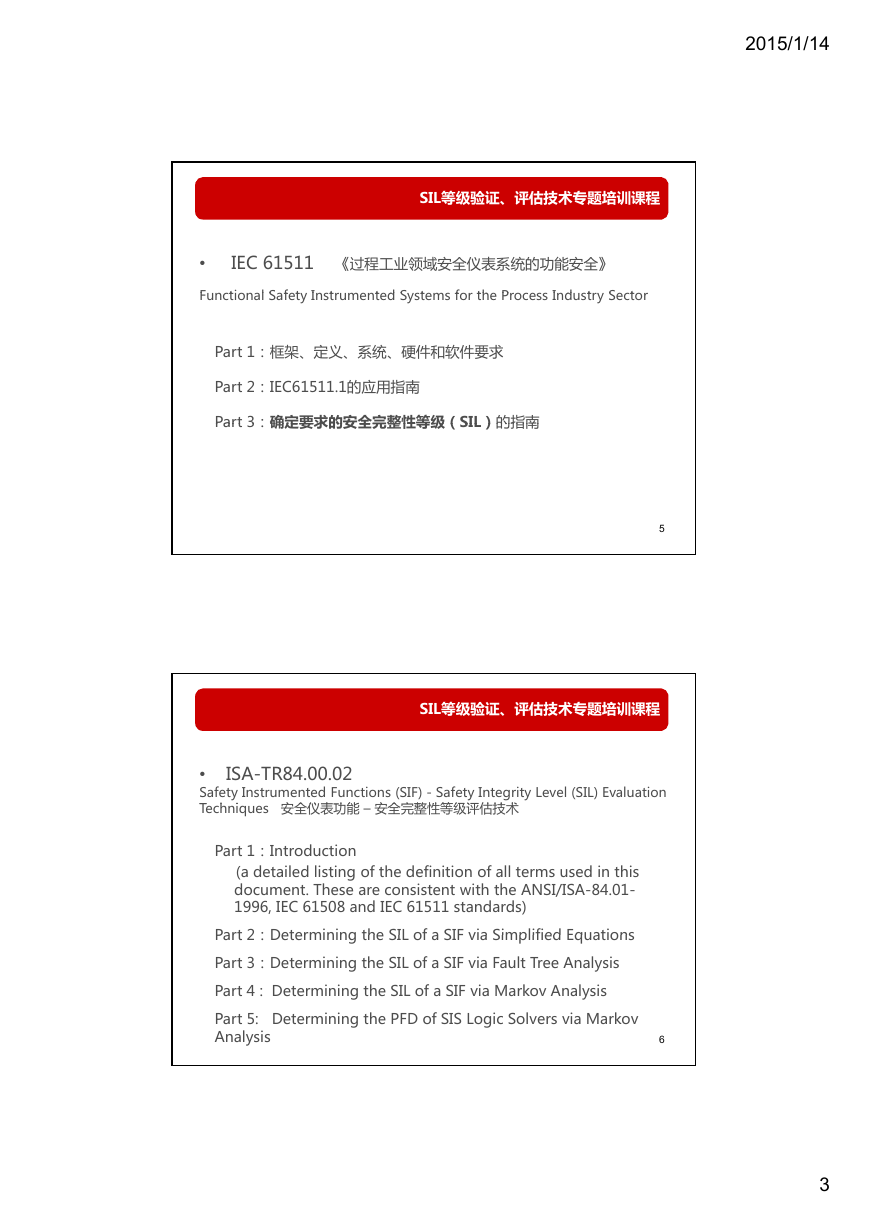
SIL等级验证、评估技术专题培训课程 一 、 功能安全相关标准 SIL等级验证 评估技术相关标准: SIL等级验证、评估技术相关标准: • • • • IEC61508 IEC61511 ISA-TR84.00.02 ANSI/ISA-84.01 3 SIL等级验证、评估技术专题培训课程 • IEC61508《电气/电子/可编程电子安全相关系统的功能安全》 在20世纪80年代中期,国际电工委员会(IEC)开始为安全系统设计制定通用国际 在 0世纪80年代中期,国际电工委员会( C)开始为安全系统设计制定通用国际 标准,2000年发布 IEC 61508(FunctionalSafetyofElectrical/Electronic/ ProgrammableElectronic(E/E/PES)Safety-RelatedSystems)。 Part1:一般要求,描述了主要概念、组织、生命期、文档编制、引导证据及SIL的定义 Part2:电子/电气/电子可编程电子安全相关系统的要求,包括对设备和系统的要求,它的很 多内容与第7部分的鉴别方法的应用有关,这些方法解决了随机或系统失效问题 Part 3:软件要求,描述避免失效的方法,与第7部分的附录相关 Part3:软件要求,描述避免失效的方法,与第7部分的附录相关 Part4:定义和缩略语 Part5:确定安全完整性等级(SIL)的方法示例 Part6:IEC61508.2和IEC61508.3的应用指南 Part7:给出测试方法,技术和措施概述 4 2015/1/14 2
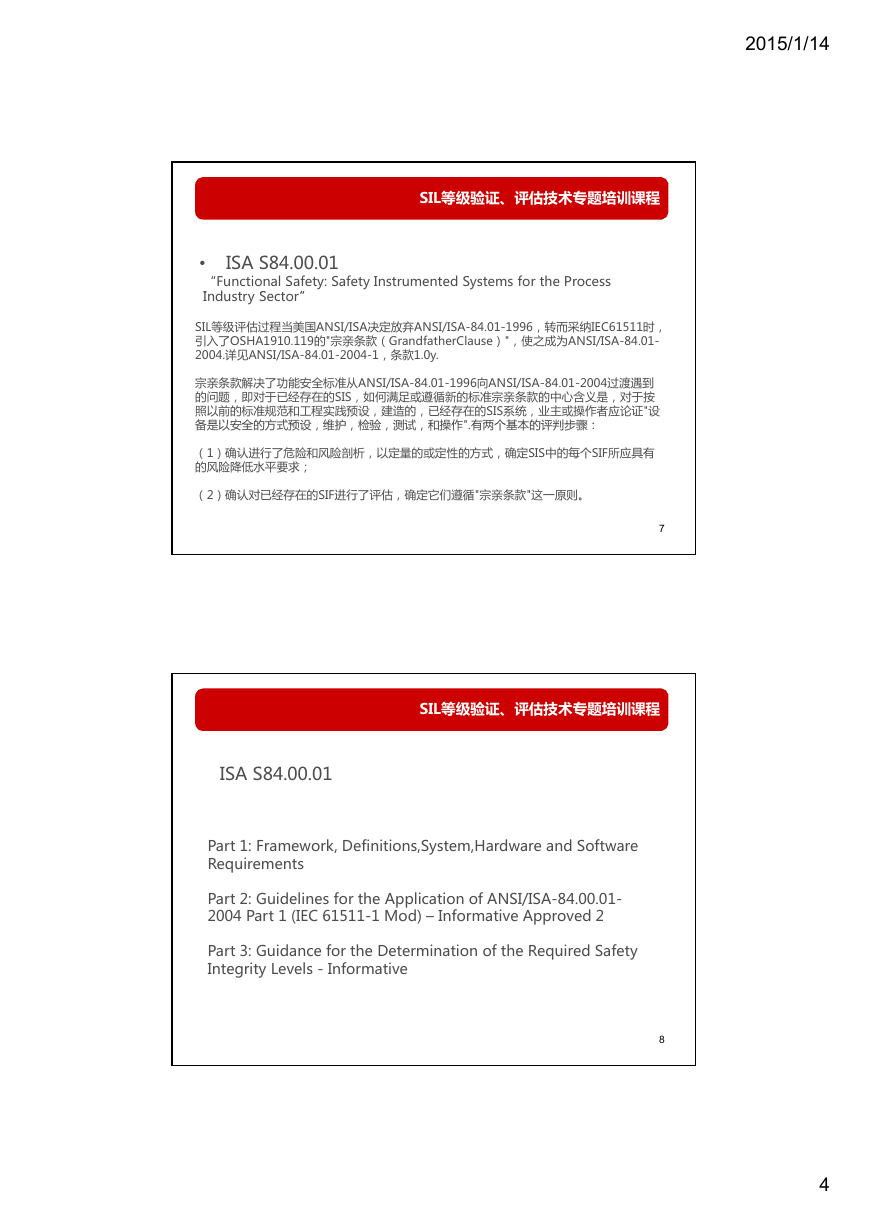
SIL等级验证、评估技术专题培训课程 • IEC61511《过程工业领域安全仪表系统的功能安全》 F FunctionalSafetyInstrumentedSystemsfortheProcessIndustrySector t d S t I d t th P S t ti l S f t I t f Part1:框架、定义、系统、硬件和软件要求 Part2:IEC61511.1的应用指南 Part 3:确定要求的安全完整性等级(SIL)的指南 Part3:确定要求的安全完整性等级(SIL)的指南 5 SIL等级验证、评估技术专题培训课程 ISA-TR84.00.02 • SafetyInstrumentedFunctions(SIF)- SafetyIntegrityLevel(SIL)Evaluation 安全仪表功能 安全完整性等级评估技术 Techniques安全仪表功能 – 安全完整性等级评估技术 T h i Part1:Introduction (adetailedlistingofthedefinitionofalltermsusedinthis document.TheseareconsistentwiththeANSI/ISA-84.01- 1996,IEC61508andIEC61511standards) Part 2:Determining the SIL of a SIF via Simplified Equations Part2:DeterminingtheSILofaSIFviaSimplifiedEquations Part3:DeterminingtheSILofaSIFviaFaultTreeAnalysis Part4:DeterminingtheSILofaSIFviaMarkovAnalysis Part5:DeterminingthePFDofSISLogicSolversviaMarkov Analysis 6 2015/1/14 3
2015/1/14 SIL等级验证、评估技术专题培训课程 ISAS84.00.01 • “FunctionalSafety:SafetyInstrumentedSystemsfortheProcess ” IndustrySector” I d S SIL等级评估过程当美国ANSI/ISA决定放弃ANSI/ISA-84.01-1996,转而采纳IEC61511时, 引入了OSHA1910.119的"宗亲条款(GrandfatherClause)",使之成为ANSI/ISA-84.01- 2004.详见ANSI/ISA-84.01-2004-1,条款1.0y. 宗亲条款解决了功能安全标准从ANSI/ISA-84.01-1996向ANSI/ISA-84.01-2004过渡遇到 的问题,即对于已经存在的SIS,如何满足或遵循新的标准宗亲条款的中心含义是,对于按 照以前的标准规范和工程实践预设,建造的,已经存在的SIS系统,业主或操作者应论证"设 备是以安全的方式预设 维护 检验 测试 和操作" 有两个基本的评判步骤: 备是以安全的方式预设,维护,检验,测试,和操作 .有两个基本的评判步骤: (1)确认进行了危险和风险剖析,以定量的或定性的方式,确定SIS中的每个SIF所应具有 的风险降低水平要求; (2)确认对已经存在的SIF进行了评估,确定它们遵循"宗亲条款"这一原则。 7 SIL等级验证、评估技术专题培训课程 ISAS84.00.01 Part1:Framework,Definitions,System,Hardware andSoftware Requirements Part2:GuidelinesfortheApplicationofANSI/ISA-84.00.01- 2004Part1(IEC61511-1Mod)– InformativeApproved2 Part3:GuidancefortheDeterminationoftheRequiredSafety IntegrityLevels- Informative 8 4
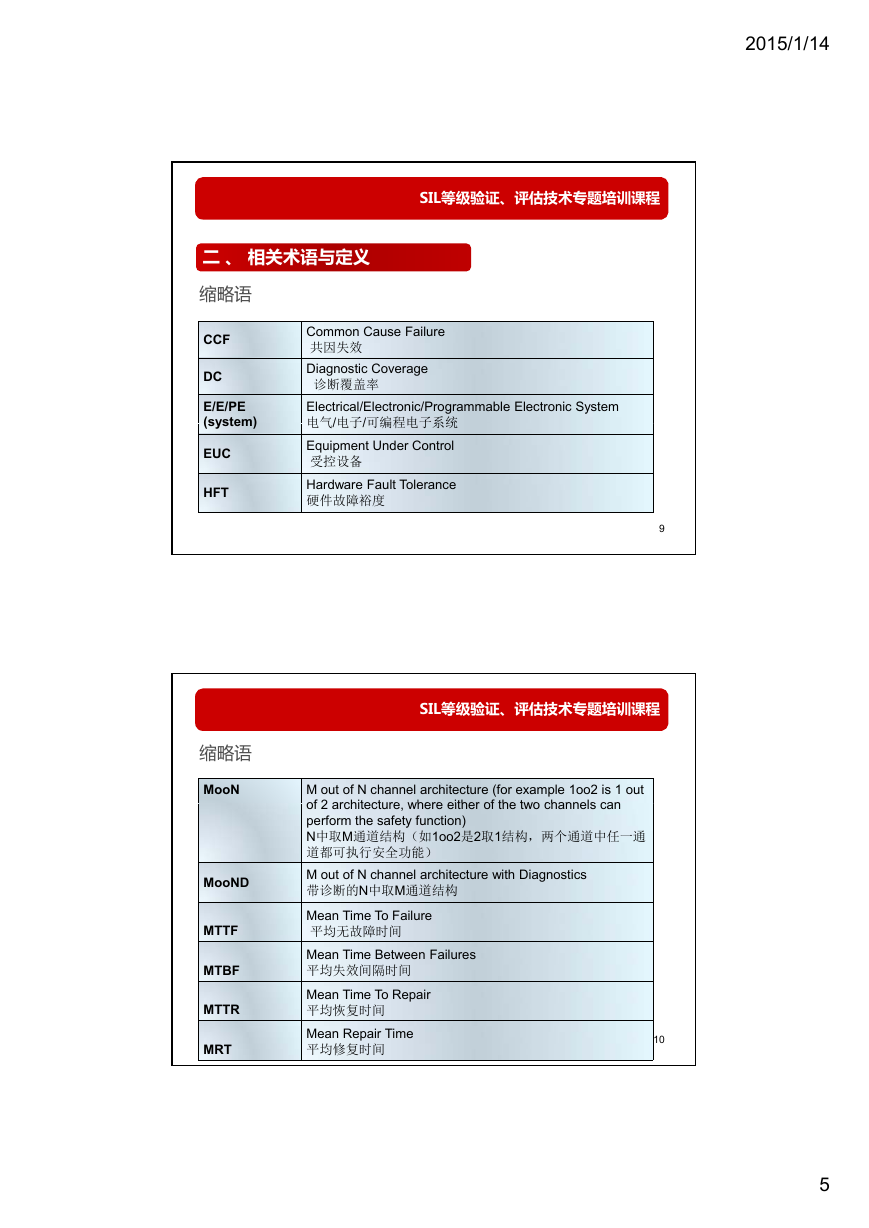
SIL等级验证、评估技术专题培训课程 二 、 相关术语与定义 缩略语缩略语 CCF DC E/E/PE (system) (system) EUC HFT 缩略语 MooN MooND MTTF MTTF MTBF MTTR MRT Common Cause Failure 共因失效 Diagnostic Coverage 诊断覆盖率 Electrical/Electronic/Programmable Electronic System 电气/电子/可编程电子系统 电气/电子/可编程电子系统 Equipment Under Control 受控设备 Hardware Fault Tolerance 硬件故障裕度 9 SIL等级验证、评估技术专题培训课程 M out of N channel architecture (for example 1oo2 is 1 out of 2 architecture where either of the two channels can of 2 architecture, where either of the two channels can perform the safety function) N中取M通道结构(如1oo2是2取1结构,两个通道中任一通 道都可执行安全功能) M out of N channel architecture with Diagnostics 带诊断的N中取M通道结构 Mean Time To Failure 平均无故障时间 平均无故障时间 Mean Time Between Failures 平均失效间隔时间 Mean Time To Repair 平均恢复时间 Mean Repair Time 平均修复时间 10 2015/1/14 5
SIL等级验证、评估技术专题培训课程 Probability of Dangerous Failure on Demand 要求时的危险失效概率 要求时的危险失效概率 Average Probability of dangerous Failure on Demand 要求时的危险失效平均概率 Average frequency of dangerous failure [h-1] 每小时危险失效平均频率[h-1] Safe Failure Fraction 安全失效分数 Safety Integrity Level 安全完整性等级 Safety instrumented function 安全仪表功能 Safety instrumented system 安全仪表系统 11 缩略语 PFD PFDavg PFH SFF SIL SIF SIS SIL等级验证、评估技术专题培训课程 定义 1. Channel 通道 element or group of elements that independently implement an element safety function 独立执行一个组件安全功能的一个或一组组件。 EXAMPLE A two-channel (or dual-channel) configuration is one with two channels that independently perform the same function. 两通道(或双通道)配置是指具有两个能独立执行相同功能的通道构成的配置。 NOTE The term can be used to describe a complete system, or a portion of a system (for example, sensors or final elements). 注:该术语可用来描述一个完整的系统或一个系统的一部分(如传感器或最终元 件)。 12 2015/1/14 6
SIL等级验证、评估技术专题培训课程 定义 2. common cause failure 共因失效 CCF failure that is the result of one or more events causing concurrent failures of failure, that is the result of one or more events, causing concurrent failures of two or more separate channels in a multiple channel system, leading to system failure 在多通道系统中由一个或多个事件导致的引起两个或多个分离通道同时失效 ,从而导致系统失效的一种失效。 3. safe failure 安全失效 a failure which does not have the potential to put the safety instrumented a failure which does not have the potential to put the safety instrumented function in a dangerous or failto-function state. 指不可能使安全系统处于潜在的危险或丧失功能状态的失效 危险失效 ─ 指使安全系统处于潜在的危险或丧失功能状态的失效 一个系统内发生危险故障的概率越低,则其安全性越高。 13 SIL等级验证、评估技术专题培训课程 2015/1/14 7
2015/1/14 SIL等级验证、评估技术专题培训课程 定义 4. fault tolerance 容错 built in capability of a system to provide continued correct execution of its built-in capability of a system to provide continued correct execution of its assigned function in the presence of a limited number of hardware and software faults. 在出现故障或误差的情况下,功能单元继续执行安全功能的能力 Redundancy冗余 the existence of more than one means for performing a required function or for representing information [based on IEC 62059-11] for representing information.[based on IEC 62059 11] 对于执行一个要求的功能或对于表示信息而言,存在多于一种的方法。 • NOTE 1 Redundancy is used primarily to improve reliability (probability of functioning properly over a given period of time) or availability (probability of functioning at given instant). It may also be used in order to minimize spurious actions through architectures such as 2oo3. 冗余主要用于提高可靠性或可用性,也可通过像2oo3这样的架构来使误动作最 15 小化。 SIL等级验证、评估技术专题培训课程 定义 5. diagnostic coverage 诊断覆盖率 DC fraction of dangerous failures detected by automatic on-line diagnostic tests fraction of dangerous failures detected by automatic on-line diagnostic tests. The fraction of dangerous failures is computed by using the dangerous failure rates associated with the detected dangerous failures divided by the total rate of dangerous failures 通过自动在线诊断测试检测到的危险失效分数。危险失效分数是由检测到的 危险失效率除以总危险失效率计算出的。 NOTE 1 The dangerous failure diagnostic coverage is computed using the following equation, where DC is the diagnostic coverage, λDD is the detected dangerous failure rate and λDtotal rate: 危险失效诊断覆盖率是由下式计算的,式中DC表示诊断覆盖率,λDD表示检 测到的危险失效率,λDtotal表示总的危险失效率。 is the total dangerous failure t DC= ΣλDD /Σλtotal NOTE 2 The diagnostic coverage is used to compute the detected(λD) and undetected failure rates (λU) from the total failure rate(λT) as follows: λD = DC x λT and λ U = (1-DC) x λT 16 8
分享到:
收藏