Propagation Times and Critical Length
How They Interrelate
In a recent article I drew an analogy between signal reflections on electrical traces and echoes in a
gym.1 In each case, the echo or reflection can interfere with the receiver’s ability to understand the
message being communicated. I suggested that there were five possible solutions to this communication
problem. Two of them were (a) slow down the message (use a slower rise time) or (b) move closer to the
speaker (shorten the trace).
This suggests that there might be a relationship between trace length and rise time. That is, for a given
rise time, communication problems caused by reflections are worse for longer traces than for shorter
traces. Similarly, for a given trace length, slower rise times cause fewer communications problems than
faster rise times. And indeed this is true. To look at this relationship, we need first to look at propagation
times in general.
Think about this experiment. Let’s string two bare copper wires across a body of water (a small lake or
a river). One of the wires is suspended in the air above the water; the other is strung under the water.
We’ll design this experiment so that the lengths of copper wire are equal. Then we will measure the
propagation time for an electrical signal down the length of each wire. Our results will show that the
propagation time for the signal along the wire under the water is almost nine times longer than for the
signal along the wire above the water!
Electromagnetic waves:
Current, by definition, is the flow of electrons. To help us think about our experiment, let’s think about
the signal consisting of a flow of individual electrons moving along the trace.2 A change in the signal
(for example between a logical 1 and a logical 0) represents a change in the number of electrons passing
a single point per unit time.
Electrons have a negative charge. Perhaps you recall from school days that “like charges repel” and
“unlike charges attract.” The electrons moving along the wire repel other electrons that might be nearby.
In order to do this, there must be an electrical field radiating from the wire caused by the presence of the
electrons. There is, indeed, such a field around a wire carrying current. It radiates outward from the wire
and is proportional to the magnitude of the current. A changing current causes a changing electrical
field.
In addition, when current flows along a wire, a magnetic field is generated around the wire. This is the
fundamental principle behind an electrical motor. A changing electrical field generates a changing
magnetic field. This is related to the principle behind an electrical generator.
These two fields, one electrical (or charge related) and one magnetic, are collectively referred to as the
“electromagnetic field” around a wire. While the current flows within the wire, the electromagnetic field
flows in the medium around the wire. It is important to note that the electrons forming the current, the
electrical field and the magnetic field all must move together. One can’t get out in front of or lag behind
either of the other two. We now have the basis for understanding why the signal flowing along the wire
under water propagates so much more slowly than along the wire above the water. The limiting factor is
Copyright 2002 by UltraCAD Design, Inc. and Mentor Graphics Corporation
1
�
Propagation Times and Critical Length
How They Interrelate
not the speed with which the electrons can flow along the copper; the limiting factor is how fast the
electromagnetic field can propagate through the medium surrounding the wire.
Propagation Times:
Electrical signals in a vacuum travel at the speed of light, 186,280 miles/second. If you do the units
conversion,3 this reduces to 11.8 in/nsec, or approximately a foot a nanosecond, a rule of thumb perhaps
you are familiar with. They travel at almost exactly the same speed in air at the Equator. But signals
slow down in any other medium, because the electromagnetic field is slowed down in any other
medium. For those of us in the printed circuit design field, the parameter that relates to this change in
speed is called the “relative dielectric coefficient” and is generally represented by the symbol er .
Specifically, the propagation speed of a signal in any homogeneous medium is given by the expression:
11.8
rε
in/nsec
This formula is considered very accurate for traces in stripline environments where the traces are
surrounded by a (reasonably) homogeneous medium. For example, FR4 has an er of approximately 4.
The square root of 4 is 2. So the propagation speed of signals along traces in FR4 stripline environments
is approximately 6”/nsec. The er for water is approximately 80, depending, of course, on the purity of the
water. The square root of this is approximately 9, explaining why the signal along the wire under water
travels at one-ninth the speed of the signal traveling along the wire suspended in the air. A trace in a
microstrip environment is not surrounded by a homogeneous medium. There might be FR4 underneath
the trace and air above the trace, each with different values for er. The general practice in the industry is
to use the following formula to approximate the effective value for er for microstrip traces:4
e’r = .475er + .67 for 2 < er < 6
Critical Length:
Now back to the issue of reflections. It seems intuitive that if a trace is “short”, reflections will not be
much of a problem. That is because the reflection occurs almost coincident with the signal or at the same
time the signal is transitioning between levels. “Short”, in this sense, means that the time it takes for the
signal to travel down to the end of the trace and return as a reflection is shorter that the rise time of the
signal. A “long” trace, however, is one in which the signal reflection returns after the message (after the
signal transitions from one state to another) and then interferes with the signal level. “Long,” in this
sense, means that the length of time it takes a signal to travel down a trace and reflect back is
significantly longer than the rise time of the signal.
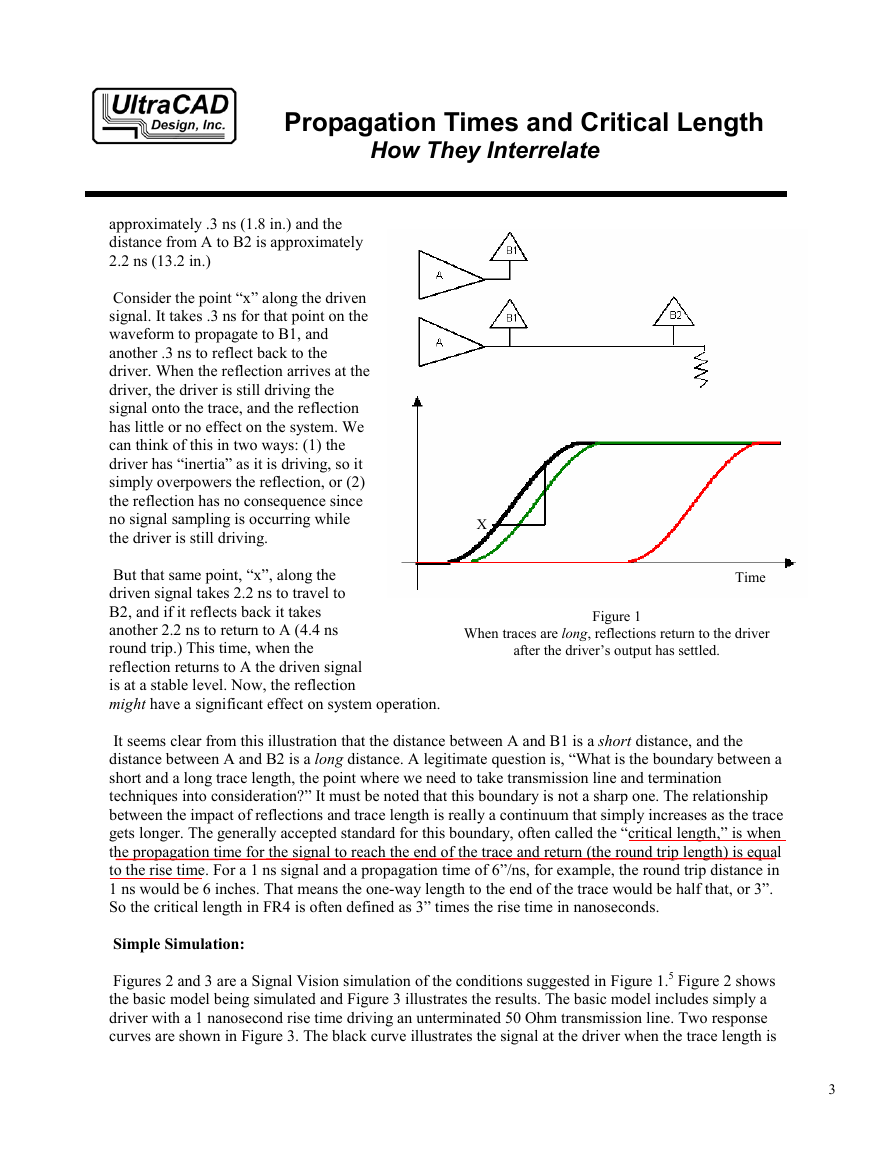
Figure 1 illustrates these points. A is a driver driving a signal down a trace. B1 and B2 are receivers.
The black curve represents the signal being driven by A. The green and red curves represent the signals
as they arrive at B1 and B2, respectively. The curves are approximately scaled. If the rise time of the
driven signal is 1 nanosecond, and the propagation speed is 6”/ns, then the distance from A to B1 is
2
�
Propagation Times and Critical Length
How They Interrelate
X
Time
approximately .3 ns (1.8 in.) and the
distance from A to B2 is approximately
2.2 ns (13.2 in.)
Consider the point “x” along the driven
signal. It takes .3 ns for that point on the
waveform to propagate to B1, and
another .3 ns to reflect back to the
driver. When the reflection arrives at the
driver, the driver is still driving the
signal onto the trace, and the reflection
has little or no effect on the system. We
can think of this in two ways: (1) the
driver has “inertia” as it is driving, so it
simply overpowers the reflection, or (2)
the reflection has no consequence since
no signal sampling is occurring while
the driver is still driving.
But that same point, “x”, along the
driven signal takes 2.2 ns to travel to
B2, and if it reflects back it takes
another 2.2 ns to return to A (4.4 ns
round trip.) This time, when the
reflection returns to A the driven signal
is at a stable level. Now, the reflection
might have a significant effect on system operation.
It seems clear from this illustration that the distance between A and B1 is a short distance, and the
distance between A and B2 is a long distance. A legitimate question is, “What is the boundary between a
short and a long trace length, the point where we need to take transmission line and termination
techniques into consideration?” It must be noted that this boundary is not a sharp one. The relationship
between the impact of reflections and trace length is really a continuum that simply increases as the trace
gets longer. The generally accepted standard for this boundary, often called the “critical length,” is when
the propagation time for the signal to reach the end of the trace and return (the round trip length) is equal
to the rise time. For a 1 ns signal and a propagation time of 6”/ns, for example, the round trip distance in
1 ns would be 6 inches. That means the one-way length to the end of the trace would be half that, or 3”.
So the critical length in FR4 is often defined as 3” times the rise time in nanoseconds.
Simple Simulation:
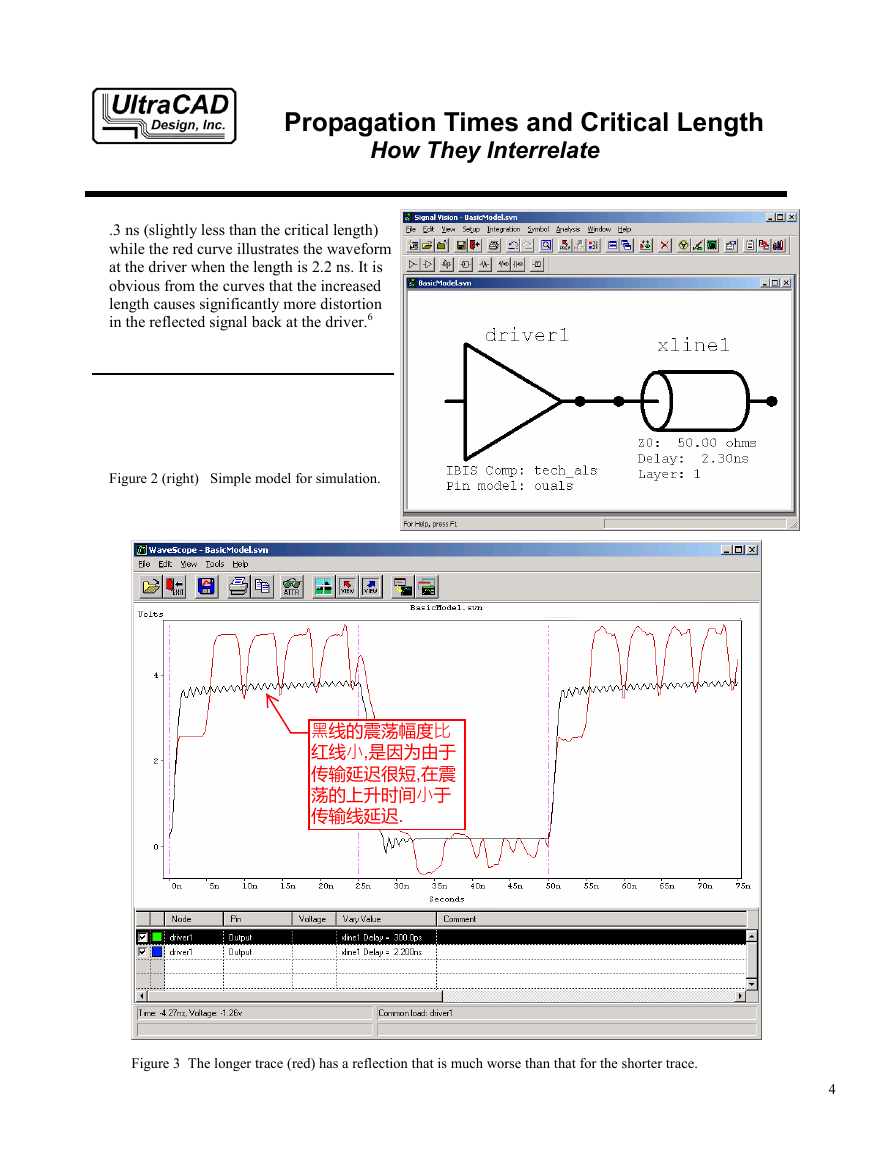
Figures 2 and 3 are a Signal Vision simulation of the conditions suggested in Figure 1.5 Figure 2 shows
the basic model being simulated and Figure 3 illustrates the results. The basic model includes simply a
driver with a 1 nanosecond rise time driving an unterminated 50 Ohm transmission line. Two response
curves are shown in Figure 3. The black curve illustrates the signal at the driver when the trace length is
When traces are long, reflections return to the driver
after the driver’s output has settled.
Figure 1
3
�
Propagation Times and Critical Length
How They Interrelate
.3 ns (slightly less than the critical length)
while the red curve illustrates the waveform
at the driver when the length is 2.2 ns. It is
obvious from the curves that the increased
length causes significantly more distortion
in the reflected signal back at the driver.6
Figure 2 (right) Simple model for simulation.
Figure 3 The longer trace (red) has a reflection that is much worse than that for the shorter trace.
4
�
Propagation Times and Critical Length
How They Interrelate
Summary:
Signal propagation speed is directly related to the relative dielectric coefficient of the material(s)
surrounding the signal trace. Traces are considered short, from a reflection standpoint, if the signal can
travel to the end of the trace and return to the driver in a time period shorter than the rise time of the
signal. Long traces are those where the round trip propagation time is longer than the rise time. In our
industry, the critical length – the length where we need to consider using transmission line design and
termination techniques – is generally considered to be the length where the round trip propagation time
of the trace equals the rise time of the signal.
Footnotes:
1. See “Basic Transmission Lines; Why Use ‘Em At All?” available at
www.mentor.com/pcb/tech_papers.cfm
2. This is not exactly correct, but it helps give us an intuitive feel of what is happening. The definition of
one Amp of current is one Coulomb of charge passing a point in one second. One Coulomb of
charge is defined as 6.25 x 10¹⁸ electrons. A more thorough discussion of this point can be found in
“Electrical Engineering For The Non-Degreed Engineer” available through www.ultracad.com.
Miles
186,280
Sec
3.
4. See IPC-D-317A, Design Guidelines for Electronic Packaging Utilizing High-Speed Techniques,
5, 280
Mile
in
12
Ft
S
10
9
ec
n
sec
=
11.8 /
in n
sec
X
Ft
X
X
January, 1995, Equation 5.17, Page 18.
5. In a subsequent article I will cover some basic simulation techniques using Signal Vision.
6. It is worth noting that if the trace in Figure 2 were correctly terminated, the two curves in Figure 3
would be perfectly smooth and indistinguishable from each other.
About the author:
Douglas Brooks has a B.S and an M.S in Electrical Engineering from Stanford University and a
PhD from the University of Washington. During his career has held positions in engineering,
marketing, and general management with such companies as Hughes Aircraft, Texas Instruments
and ELDEC.
Brooks has owned his own manufacturing company and he formed UltraCAD Design Inc. in 1992.
UltraCAD is a service bureau in Bellevue, WA, that specializes in large, complex, high density,
high speed designs, primarily in the video and data processing industries. Brooks has written
numerous articles through the years, including articles and a column for Printed Circuit Design magazine, and has been
a frequent seminar leader at PCB Design Conferences. His primary objective in his speaking and writing has been to
make complex issues easily understandable to those without a technical background. You can visit his web page at
http://www.ultracad.com and e-mail him at doug@ultracad.com.
5
�


 2023年江西萍乡中考道德与法治真题及答案.doc
 2012年重庆南川中考生物真题及答案.doc
 2013年江西师范大学地理学综合及文艺理论基础考研真题.doc
 2020年四川甘孜小升初语文真题及答案I卷.doc
 2020年注册岩土工程师专业基础考试真题及答案.doc
 2023-2024学年福建省厦门市九年级上学期数学月考试题及答案.doc
 2021-2022学年辽宁省沈阳市大东区九年级上学期语文期末试题及答案.doc
 2022-2023学年北京东城区初三第一学期物理期末试卷及答案.doc
 2018上半年江西教师资格初中地理学科知识与教学能力真题及答案.doc
 2012年河北国家公务员申论考试真题及答案-省级.doc
 2020-2021学年江苏省扬州市江都区邵樊片九年级上学期数学第一次质量检测试题及答案.doc
 2022下半年黑龙江教师资格证中学综合素质真题及答案.doc