Atmospheric and Climate Sciences, 2018, 8, 97-110
http://www.scirp.org/journal/acs
ISSN Online: 2160-0422
ISSN Print: 2160-0414
Weather Impact on Heat-Related Illness in a
Tropical City State, Singapore
Hai-Yan Xu1, Xiuju Fu1, Chin Leong Lim2, Stefan Ma3, Tian Kuay Lim4,
Paul Anantharajah Tambyah5, Mohd Salahuddin Habibullah1, Gary Kee Khoon Lee6,
Lee Ching Ng7, Kee Tai Goh8, Rick Siow Mong Goh1, Lionel Kim Hock Lee2
1Institute of High Performance Computing, Singapore
2Lee Kong Chian School of Medicine, Nanyang Technological University, Singapore
3Ministry of Health, Singapore
4Urban Redevelopment Authority, Singapore
5National University of Hospital, Singapore
6Rolls-Royce Singapore Pte Ltd., Singapore
7National Environment Agency, Singapore
8Saw Swee Hock School of Public Health, National University of Singapore, Singapore
How to cite this paper: Xu, H.-Y., Fu, X.J.,
Lim, C.L., Ma, S., Lim, T.K., Tambyah, P.A.,
Habibullah, M.S., Lee, G.K.K., Ng, L.C., Goh,
K.T., Goh, R.S.M. and Lee, L.K.H. (2018)
Weather Impact on Heat-Related Illness in a
Tropical City State, Singapore. Atmospheric
and Climate Sciences, 8, 97-110.
https://doi.org/10.4236/acs.2018.81007
Received: September 10, 2017
Accepted: January 21, 2018
Published: January 24, 2018
Copyright © 2018 by authors and
Scientific Research Publishing Inc.
This work is licensed under the Creative
Commons Attribution International
License (CC BY 4.0).
http://creativecommons.org/licenses/by/4.0/
Open Access
Abstract
In this article we propose a novel hurdle negative binomial (HNB) regression
combined with a distributed lag nonlinear model (DLNM) to model weather
factors’ impact on heat related illness (HRI) in Singapore. AIC criterion is
adopted to help select proper combination of weather variables and check
their lagged effect as well as nonlinear effect. The process of model selection
and validation is demonstrated. It is observed that the predicted occurrence
rate is close to the observed one. The proposed combined model can be used
to predict HRI cases for mitigating HRI occurrences and provide inputs for
related public health policy considering climate change impact.
Keywords
Distributed Lag Nonlinear Model, Heat-Related Illness, Hurdle Model,
Negative Binomial distribution, Weather Factors
1. Introduction
Heat related illness (HRI) is a well-known hazard for workers under high tem-
perature environments and people exercising in extreme heat. The understand-
ing of the association of weather factors on HRI is important for making preven-
tive measures and related policy in workplace and schools, or during sports ac-
DOI: 10.4236/acs.2018.81007 Jan. 24, 2018
97
Atmospheric and Climate Sciences
�
H.-Y. Xu et al.
tivities.
Several modeling studies had investigated the association between weather
conditions and HRI [1] [2] [3]. These studies were based mainly on summer da-
ta from temperate countries. An additive linear model was applied to investigate
the association between meteorological variables and the logarithm of HRI rate
in these studies. Temperature was found to have adverse effect on the occur-
rence of HRI and there is no consensus on the impact of other meteorological
variables.
Previous studies on HRI in Singapore have been documented [4] [5] [6] [7]
[8]. Preventive measures have been implemented in Singapore to manage heat
injuries, especially in the Singapore Armed Forces [9] [10]. The annual inci-
dence of HRI cases admitted to hospital had decreased from over 200 in the early
1990’s to fewer than 100 in the 2000’s (see Figure 1). However, the incidence has
been increasing since 2008, with 55, 79, 88 and 106 reported HRI cases admitted
to hospital in 2007, 2008, 2009, and 2010, respectively. This reversal in HRI
trends requires a thorough understanding of the factors impacting HRI in Sin-
gapore.
Factors that impact HRI may include weather, social activity, and individual
health status. In our study, we focused on modeling weather impact on HRI.
Other factors were also considered by categorized parameters like holidays and
weekdays.
For modeling the impact of weather on HRI in Singapore, we employed hur-
dle negative binomial (HNB) models together with distributed lag non-linear
models (DLNMs). As many zero counts were found in our HRI data, a hurdle
was assumed when the count of HRI cases turns from zero to non-zero. For the
HNB model, a censored Poisson (right-censoring at 0) governed the binary out-
come of the impact of weather on the occurrence and non-occurrence of HRI
cases. If the counts of HRI cases were not zero, the conditional distribution of
Figure 1. Annual counts of hospital admissions for heat related illness in Singapore,
1991-2020.
98
Atmospheric and Climate Sciences
DOI: 10.4236/acs.2018.81007
�
H.-Y. Xu et al.
the counts was governed by a zero truncated negative binomial model [11] [12]
[13].
The DLNMs were developed and had been used, simultaneously, to estimate
the nonlinear and delayed effects of temperature (or air pollution) on mortality
[14] [15] [16]. In this study, we used the DLNMs to investigate delayed and non-
linear effect of weather variables on the daily incidence of hospital admission for
HRI cases.
2. Materials and Methods
2.1. Data Description
Singapore is a city-state in Southeast Asia and located at 01˚22'N and 103˚48'E.
Because of its geographical location and maritime exposure, the climate of Sin-
gapore is tropical with daily ambient temperature ranging from 25˚C to 33˚C
and daily humidity between 60% and 95%. There are two main monsoon sea-
sons, the northeast monsoon (December-early March) and the southwest mon-
soon season (June-September), separated by two relatively short inter-monsoon
periods (late March-May and October-November).
The HRI data, provided by the Singapore Ministry of Health, recorded daily
incidence of hospital admission for HRI cases (categorized as 992.0, 992.3, 992.5
under ICD-9 CM codes) from 1 January 1991 to 31 December 2010 in Singa-
pore. The summary of the data is listed in Table 1. Daily Singapore weather da-
ta, including maximum temperature (MaxT), mean temperature (MeanT),
minimum temperature (MinT), relative humidity (RH) and wind speed (Wdsp),
were provided by the Singapore National Environment Agency for the years
1991 to 2010. The daily weather conditions and daily incidence of hospital ad-
mission for heat related illness cases are shown in Table 2.
Table 1. Summary of the daily incidence of hospital admissions for heat-related illness
cases by each day in a week, and public holiday, Singapore, 1991-2010.
Number of daily HRI
0
1
2
3
4
5
6
7
8
9
12
15
Counts of days corresponding to the number of illness cases
Overall
5626 1222 289
88
Public holiday 236 16
Sunday
874 121
Monday
830 142
Tuesday
785 192
Wednesday 792 193
Thursday
769 194
Friday
767 202
Saturday
809 178
3
21
47
46
37
52
46
40
−
8
16
14
15
12
15
8
40
−
23
−
6
6
3
3
8
8
6
5
1
3
4
5
5
−
5
−
2
1
−
−
2
−
−
5
−
1
−
1
−
2
1
2
−
1
−
−
−
−
1
−
3
−
3
−
−
−
−
−
−
1
−
1
−
−
−
−
−
−
1
−
−
−
−
−
−
1
Proportion of
days
withHRI (%)
22.98
7.46
16.20
20.42
24.81
24.14
26.34
26.53
22.44
DOI: 10.4236/acs.2018.81007
99
Atmospheric and Climate Sciences
�
H.-Y. Xu et al.
Table 2. Summary statistics of daily weather conditions and daily incidence of hospital
admission for heat related illness cases in Singapore, 1991-2010.
Min.
1st Qu.
Median
3rd Qu.
Max.
MinT
MeanT MaxT
20.2
24.0
24.8
25.7
29.1
23.1
26.9
27.7
28.6
30.9
23.6
30.8
31.8
32.6
36.0
RH
66.0
79.8
83.1
86.8
99.5
Wdsp WBGT_MeanT
HRI
0.1
1.1
1.7
2.5
5.9
26.1
28.8
29.5
30.1
32.3
0
0
0
0
15
Mean (sd) 24.9 (1.2) 27.7 (1.2) 31.6 (1.6) 83.4 (5.0) 1.9 (1.0)
29.4 (0.9)
0.34 (0.80)
1st Qu. and 3rd Qu. represent the 25th and 75th percentiles, respectively.
Wet-bulb globe temperature index (WBGT) is a common index for measuring
environmental heat stress and is used widely as an assessment for the risks of
HRI [17] [18]. In this study, no actual WBGT data was available, and theoretical
WBGT data was only available for the years 2000-2001 and 2003-2006. We used
in our model approximated WBGT, which was calculated based on ambient
temperature and relative humidity. This is an indicator to reflect the compound
effect of weather variables on HRI. The approximated WBGT used in this study,
followed that used in Australia [19], which was successfully employed during the
2000 summer Olympics in Sydney, Australia [20], and was found to “most relia-
bly” predict environmental heat stress [21]. High correlation (the Pearson’s cor-
relation coefficient was 0.93) was found between theoretical WBGT and ap-
proximated WBGT based on available data in the years including 2000-2001 and
2003-2006. The expression of the approximated WBGT is shown as the follow-
ing,
+
e
=
×
Ta
0.393
× +
e
3.94
WBGT 0.567
≈
(1)
where e is environmental water vapor pressure, calculated from temperature and
,
relative humidity using
RH is the relative humidity and Ta is dry bulb temperature (˚C). In this study,
Ta was the daily mean temperature, and the corresponding approximated
WBGT based on Formula (1) was denoted WBGT_MeanT. Formula (1) was first
proposed by [22], and subsequently it was recommended by the American Col-
lege of Sports Medicine [23].
6.105 exp 17.27
273.7
×
Ta
+
Ta
100
(
RH
)
×
×
(
)
2.2. Data Analysis
A hurdle negative binomial (HNB) regression model combined with a distri-
buted lag non-linear model (DLNM) was applied here to explore the association
between daily HRI counts with weather conditions. The hurdle model was sug-
gested by [11] [12] [13] to deal with counts data with extra zeros. In this study,
we employed a hurdle model as, in about 77.02% (100% - 22.98%) days of the
studied period, no HRI cases were observed in our data (see Table 1). The hur-
dle model was aimed to explore the impact of weather factors on binary result of
100
Atmospheric and Climate Sciences
DOI: 10.4236/acs.2018.81007
�
H.-Y. Xu et al.
the presence of HRI or not, as well as the impact on the count of HRI cases if the
count is not zero.
Actually, the occurrence of HRI is a comprehensive impact of weather factors
and other factors, such as physical activities, the lack of environmental acclima-
tization, poor physical fitness, and illness [17] [24]. In consensus, if the count of
HRI is abnormally high, it implies a high possibility that other than weather fac-
tors have stepped in. For example, according to our collected HRI counts
(2002-2010) on the dates when Standard Chartered Marathon was held in Sin-
gapore (see Table 3), the counts of HRI cases were in a range from 4 to 12 com-
pared to the overall mean of 0.34 cases (see Table 2). We need to arrange dif-
ferent models to reflect the different scenarios. Here, the separation line was as-
sumed to be at the location where the counts of HRI cases were zero or more as
more than normal zeros were observed. Therefore, the hurdle model was em-
ployed where the zero counts and the positive counts of HRI cases were modeled
by different distributions.
On the other hand, the positive count of HRI cases could be accounted for
different origins. Hence, zero-truncated Negative binomial (ZNB) distribution
was applied to describe the count, as a NB distribution is a mixture of Poisson
distribution [25]. Furthermore, according to Table 1, HRI counts exhibited a
long and flat tail. Again, the NB distribution was adopted, as it was similar to a
Poisson model but with a longer, fatter tail to the extent that the variance ex-
ceeds the mean [26].
A DLNM was used to check if weather conditions had delayed adverse effect
on the occurrence of HRI. At the same time, linear or nonlinear effect was also
investigated through DLNMs.
For the zero hurdle part, a censored Poisson (right-censoring at zero) was em-
ployed to model the impact of weather on the occurrence and non-occurrence of
HRI cases. The Poisson mean on day t was denoted as
0tµ . On the other hand,
the positive counts part was modeled by a ZNB model with the negative binomi-
1tµ and shape parameter of θ on day t. Modeling processes for the
al mean of
two parts could be conducted separately according to the work by [27]. In this
study,
Weather
tj
)
+
δ
k
⋅
Dow
t
+
γ
k
⋅
Holiday
t
(2)
(
)
kt
+
=
log
µ α
k
ktµ was assumed to satisfy:
(
)
log Pop
t
( )
⋅
∑
(
s
k
+
j
+
trend
kt
kα was the intercept,
was a smoothing function. It was noted
where
that the default knots were equally-spaced percentiles.
were ob-
tained by applying a DLNM to Weatherjt (i.e., MinT, MeanT, MaxT, RH,
Weather
tj
s
k
ks
(
)
Table 3. Count of HRI on the day of Standard Chartered Marathon Singapore (2002-
2010).
Date 12/8/2002 12/7/2003 12/5/2004 12/4/2005 12/3/2006 12/2/2007 12/7/2008 12/6/2009 12/5/2010
HRI
4
9
12
5
5
6
5
4
9
101
Atmospheric and Climate Sciences
DOI: 10.4236/acs.2018.81007
�
H.-Y. Xu et al.
Wdsp and WBGT_MeanT). Dowt was day t of the week, and
kδ was vector
of coefficient. Holidayt was a binary variable that was “1” if day t was a holi-
day, and
kγ was the coefficient. Dowt and Holidayt were used to reflect the
impact of social activities related with heat illness. For the offset term, Popt
was the total population of Singapore on day t. As only the mid-year population
was obtained (from the Department of Statistics, Singapore), daily population
was approximated by linear interpolation. trendkt was determined through
n-phase piecewise linear functions. n-phase piecewise linear function means that
the piecewise linear function has n phases.
R software (version 3.1.1; R Development Core Team, 2014) was used to fit all
models. The “dlnm” package was used to create the DLNM [28]. For the zero
hurdle part, let
tπ denote the probability of at least one case of HRI observed
on day t, then
. Hence, the
= −
π
t
censored Poisson was modeled by a binomial regression model with a “pois” link
in the “glm” function. For the positive counts part, a ZNB model with a “log”
link was used. “countreg” package was employed to create the ZNB model and
“pscl” package to create the final HNB model.
)0
µ
−
1 exp
(
log 1
, i.e.,
−
π
t
=
log
log
(
µ
0
t
)
(
−
(
t
)
)
The modeling process was as follows. The first step was to determine the trend
of HRI cases through n-phase piecewise linear functions. The intercept and slope
might differ for different phases. Corresponding knots were chosen among a
sequence of the last day of dual months: “02/28/1991”, “04/30/1991”, …,
“10/31/2010”, “12/31/2010”. The Akaike information criterion (AIC) was used to
determine the best trend. For the zero hurdle part, a three phase piecewise linear
function with knots “2/28/1994” and “6/30/2002” was detected. On the other
hand, for the positive counts part, a two phase piecewise linear function with the
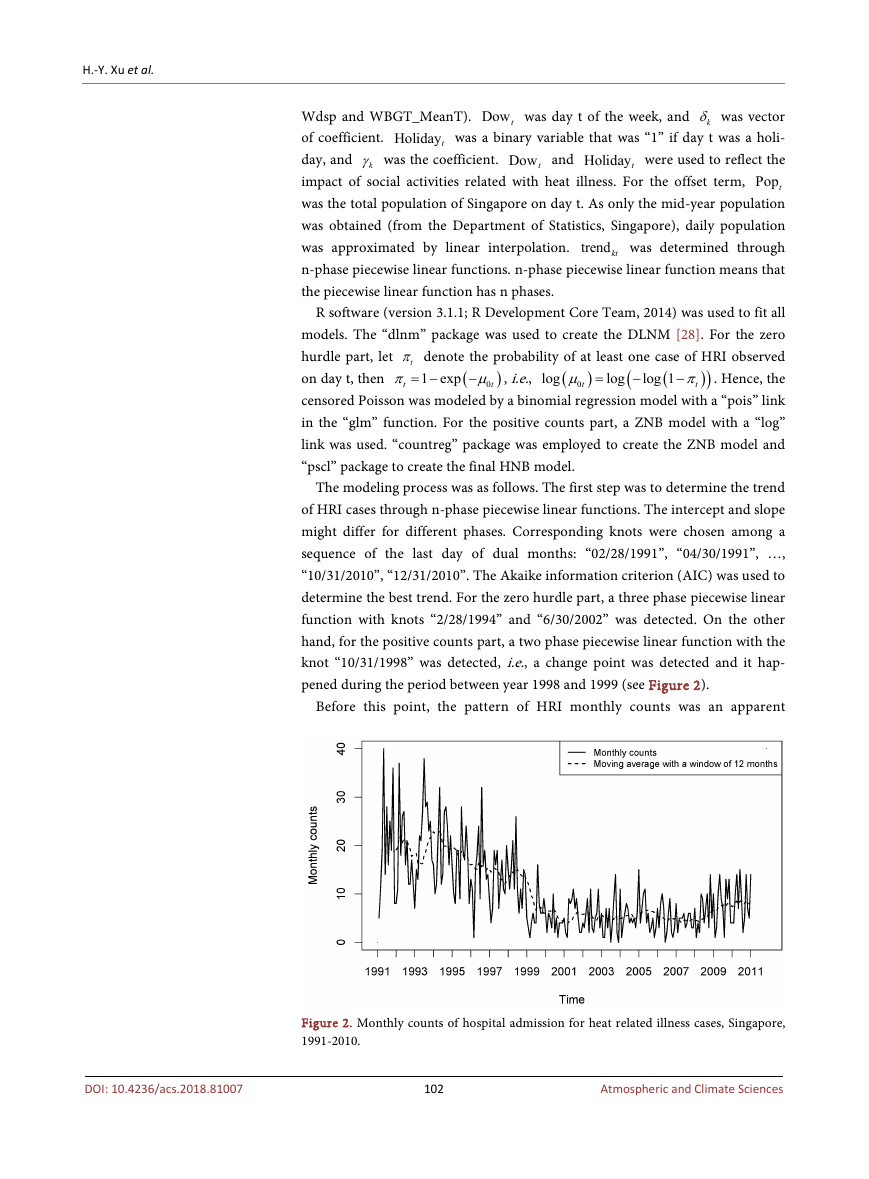
knot “10/31/1998” was detected, i.e., a change point was detected and it hap-
pened during the period between year 1998 and 1999 (see Figure 2).
Before this point, the pattern of HRI monthly counts was an apparent
Figure 2. Monthly counts of hospital admission for heat related illness cases, Singapore,
1991-2010.
102
Atmospheric and Climate Sciences
DOI: 10.4236/acs.2018.81007
�
H.-Y. Xu et al.
decreasing trend with higher number of cases and higher variance. After this
point, the pattern showed a relatively stable trend with relatively lower number
of cases, lower variance.
The second step was to explore the weather predictors that best predicted the
occurrence of HRI after adjusting for trend, holiday and specific days in a week.
A DLNM was used to find the best weather predictors. A natural splines (ns)
function, with degree of freedom (df) of 3 and knots placed at equally-spaced
quantiles, was applied to reflect the nonlinear effect of each weather predictor.
In the censored Poisson model, both single lag effect and distributed lag effect
were investigated with a maximum lag number of 14 days. For a single lag mod-
el, AIC of the single lag models was used to determine the best lag. In our study,
the best lag numbers found for weather predictors were all 0s. For the distri-
buted lagged effect model (DLNM), a different ns function with df of 2 was used
to describe the effect of lags. Nevertheless, constrained DLNM does not exist
when the maximum lag number is less than 2. Hence unconstrained DLNM was
used for the lag number 0 and 1. During this process, we also found that the best
lags for weather predictors were all 0’s.
In the TZBN model, similar model selection procedure was conducted as de-
scribed above for the binomial model. For a single lag model, the current effect
(lag number = 0) of all considered weather parameters was found with smaller
AIC values than other lagged effect. For the distributed lagged effect model, un-
der AIC, the best maximum number of lags of all considered weather predictors
were all 0’s except for approximated WBGT, in which the maximum number of
lag 3 was associated with the smallest AIC values. We then applied Vuong test
(in “pscl” package, R software, version 3.1.1), which was designed to do model
selection between two non-nested models [29], to test the significance of the
improvement of the model only considering current effect to the model cumu-
lating up to 3 lagged effects. It was interesting to observe that the model with
only current effect was significantly better than the other model (p-value < 0.01).
The reason is because in the Vuong test, there is more punishment on the num-
ber of parameter than an AIC does. On the other hand, the AIC value of the
current-effect model was slightly higher than the cumulative-lag-effect model.
Hence, only current effect of approximated WBGT was considered in the fol-
lowing step of the modeling process.
The third step was to explore the linear or nonlinear effect of the weather pre-
dictors on HRI. The ns functions with df from 1 to 5 was compared to reflect the
impact of the weather predictors. When df = 1, the ns function was actually a li-
near function. AIC was also used to determine the best model.
The forth step was to examine the best combination of weather predictors.
The first weather predictor was selected if it was associated with the smallest AIC
value among all candidate weather predictors. After the first weather predictor
was included, a second predictor variable was included if the AIC value of the
new model was reduced. The process continued until no new entry could reduce
103
Atmospheric and Climate Sciences
DOI: 10.4236/acs.2018.81007
�
H.-Y. Xu et al.
the AIC value or all weather predictors were included in the model. During the
selection procedure, the best ns function was selected and used for each new en-
try.
During the process, if a complicated model was first selected according to AIC
values, the significance of its superiority against a corresponding simple model
was further tested. If it was not significant, the simple model would be chosen.
3. Results
There were 2474 HRI cases admitted to hospital from year 1991 to 2010 (7035
days) with a daily mean of 0.34 cases (see Figure 1). The daily incidence of HRI
was sparse and the proportion of days with HRI was only 22.98% (1679 days, see
Figure 1 and Table 1). The proportion of days with HRI cases was the lowest
(7.46%) in the “public holiday” category, followed by the “Sunday” category
(16.2%). However, high incidence of HRI occurred mostly on Sundays (32.5% of
days with 5 and more cases).
In the study period, the average daily maximum temperature (MaxT) was
31.6˚C, mean temperature (MeanT) was 27.7˚C, minimum temperature (MinT)
was 24.9˚C, mean relative humidity was 83.4%, and mean wind speed was 1.9
m/sec (see Table 2). The correlation was 0.53 between MaxT and MinT, 0.81
between MaxT and MeanT, and 0.80 between MeanT and MinT (see Table 4).
The correlation between relative humidity and the three types of temperatures
were all negative. The highest negative correlation was -0.76 between RH and
MeanT (see Table 4). The correlation between WBGT_MeanT and MeanT was
the highest (0.91). Hence, in the model selection procedure, we avoided putting
both WBGT_MeanT and MeanT in the same model.
Mean temperature and approximated WBGT were associated with lower AIC
values (see Table 5). In the binomial model for the occurrence of HRI or not,
MeanT was associated with the lowest AIC. Hence, MeanT was first selected into
the model. On the other hand, approximated WBGT was associated with the
lowest AIC in the ZTNB model for the non-zero counts part of HRI. Neverthe-
less, the AIC associated with approximated WBGT was only slightly lower than
that associated with MeanT (Table 5). A Vuong test was further applied to test
Table 4. Pearson’s correlation coefficients among weather conditions in Singapore, 1991-
2010.
MinT
MeanT
MaxT
RH
Wdsp
MeanT
0.80
MaxT
0.53
0.81
RH
−0.53
−0.76
−0.66
Wdsp
WBGT_ MeanT
0.24
0.27
0.17
−0.50
0.77
0.91
0.71
−0.41
0.05
All the correlation coefficients are statistically significant with p < 0.001.
104
Atmospheric and Climate Sciences
DOI: 10.4236/acs.2018.81007
�


 2023年江西萍乡中考道德与法治真题及答案.doc
 2012年重庆南川中考生物真题及答案.doc
 2013年江西师范大学地理学综合及文艺理论基础考研真题.doc
 2020年四川甘孜小升初语文真题及答案I卷.doc
 2020年注册岩土工程师专业基础考试真题及答案.doc
 2023-2024学年福建省厦门市九年级上学期数学月考试题及答案.doc
 2021-2022学年辽宁省沈阳市大东区九年级上学期语文期末试题及答案.doc
 2022-2023学年北京东城区初三第一学期物理期末试卷及答案.doc
 2018上半年江西教师资格初中地理学科知识与教学能力真题及答案.doc
 2012年河北国家公务员申论考试真题及答案-省级.doc
 2020-2021学年江苏省扬州市江都区邵樊片九年级上学期数学第一次质量检测试题及答案.doc
 2022下半年黑龙江教师资格证中学综合素质真题及答案.doc