Defined at every point in time, and at all possible amplitudes.
Defined only at certain points in time, and only at certain
amplitudes.
less dependent on component tolerances
less affected by noise
Chapter 1 Solutions
1.1
Analog:
Digital:
lower power consumption
1.2
more predictable behavior
smaller in size
easier to redesign
1.3
(a)
(b)
(c)
(d)
(e)
(f)
(g)
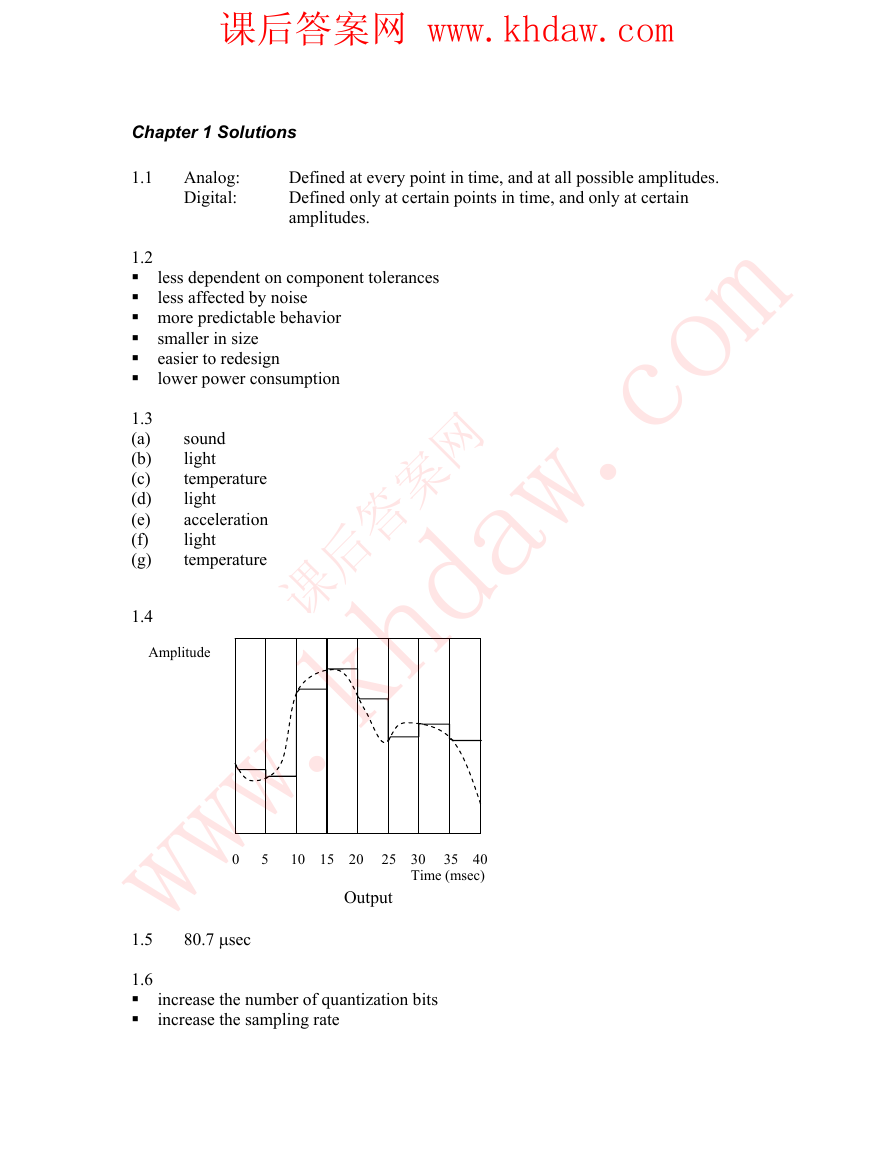
1.4
sound
light
temperature
light
acceleration
light
temperature
Amplitude
1.5
1.6
0 5 10 15 20 25 30 35 40
Time (msec)
Output
80.7 μsec
increase the number of quantization bits
increase the sampling rate
课后答案网 www.khdaw.com�
The output analog signal will differ from the input signal as a result of:
1.7
aliasing, if the maximum frequency in the input signal exceeds half of the sampling
rate because the anti-aliasing filter is non-ideal
time shift, caused by the anti-aliasing and anti-imaging filters
quantization, since the number of bits used by the converter is finite
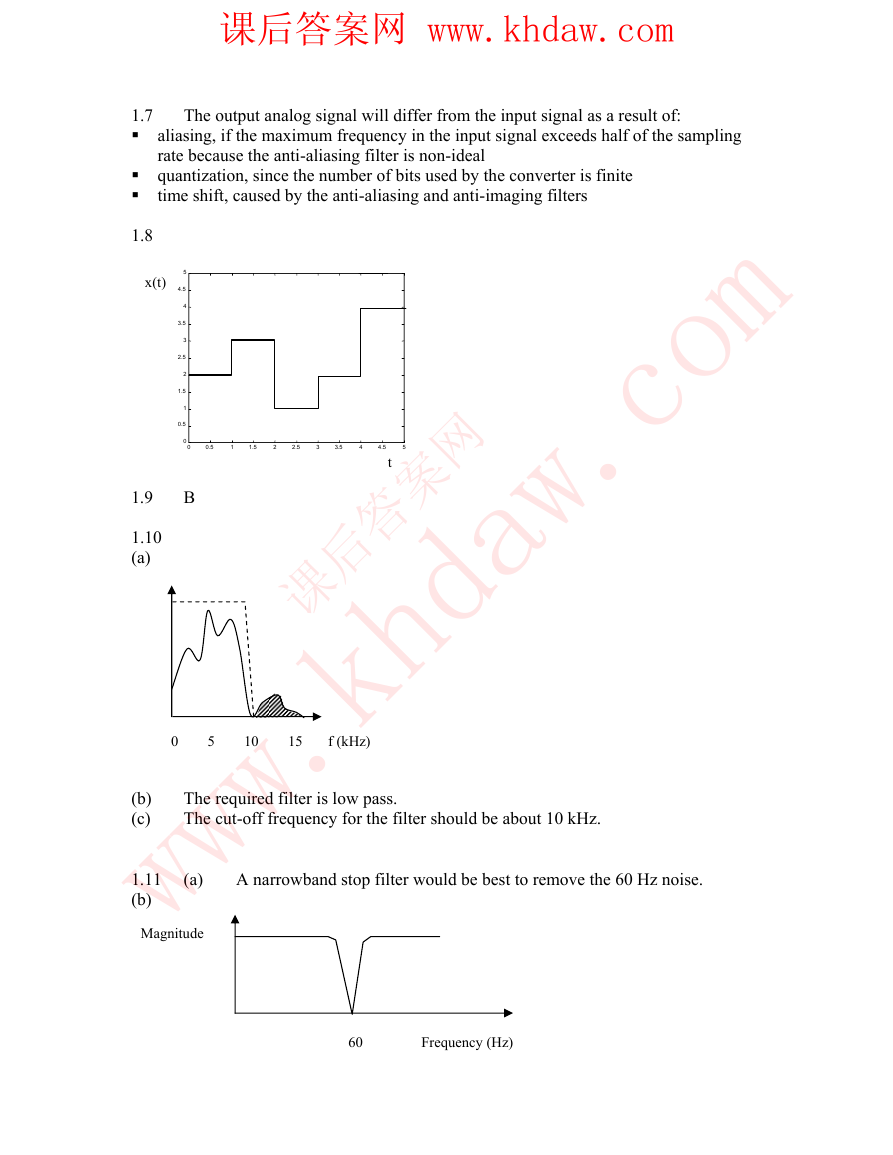
1.8
0.5
1
1.5
2
2.5
3
3.5
4
4.5
5
t
5
4.5
4
3.5
3
2.5
2
1.5
1
0.5
0
0
B
x(t)
1.9
1.10
(a)
(b)
(c)
1.11
(b)
0 5 10 15 f (kHz)
The required filter is low pass.
The cut-off frequency for the filter should be about 10 kHz.
(a)
Magnitude
A narrowband stop filter would be best to remove the 60 Hz noise.
60 Frequency (Hz)
课后答案网 www.khdaw.com�
A low pass filter with a cut-off frequency of about 1 kHz
(a)
A high pass filter with a cut-off frequency of about 1 kHz
(a)
Choir
Low
Pass
Band
Pass
Bass and Alto
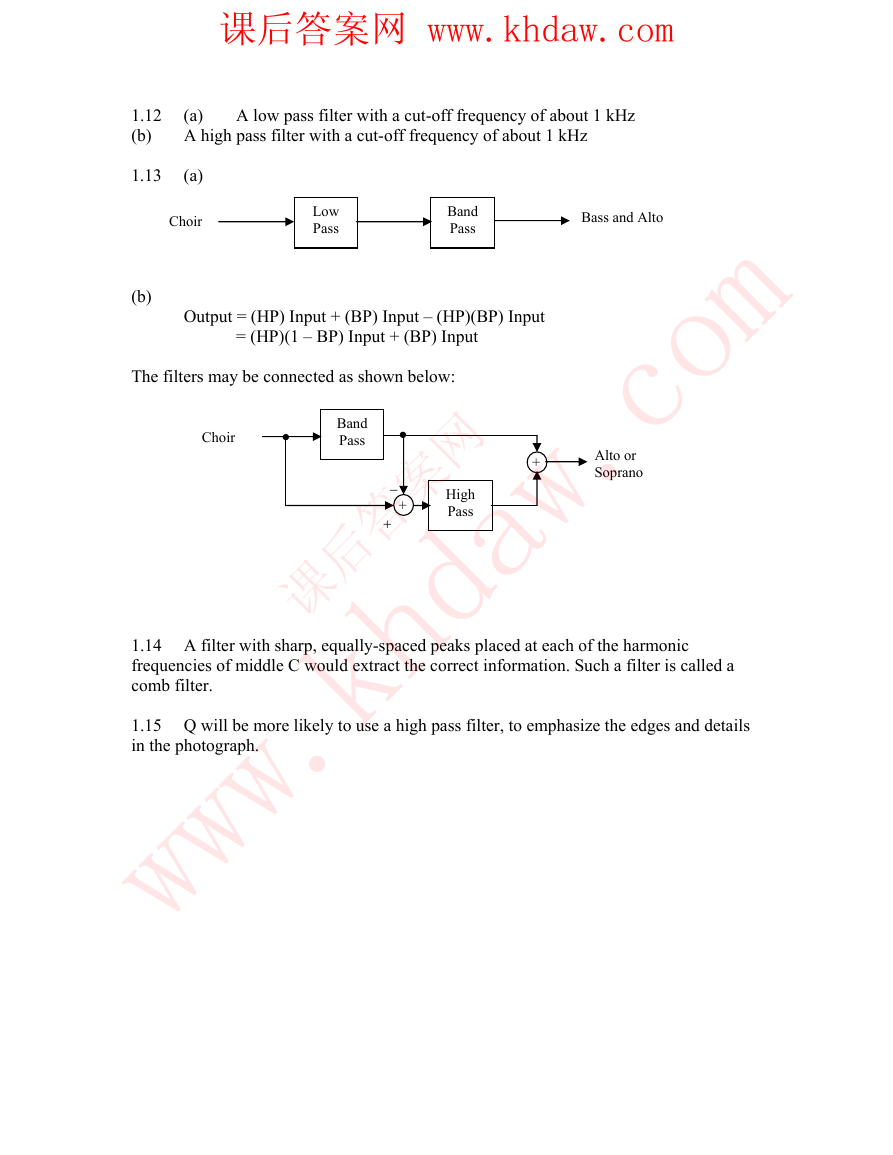
1.12
(b)
1.13
(b)
Output = (HP) Input + (BP) Input – (HP)(BP) Input
= (HP)(1 – BP) Input + (BP) Input
The filters may be connected as shown below:
Band
Pass
Choir
+
Alto or
Soprano
−
+
High
Pass
+
1.14 A filter with sharp, equally-spaced peaks placed at each of the harmonic
frequencies of middle C would extract the correct information. Such a filter is called a
comb filter.
1.15 Q will be more likely to use a high pass filter, to emphasize the edges and details
in the photograph.
课后答案网 www.khdaw.com�
The Nyquist rate for the signal is 6.37 Hz
(a)
The Nyquist rate is 1666.7 Hz.
The Nyquist rate is 428.6 Hz.
1
f
S
=
1
8000
=
125
μs
44.1 kHz.
Chapter 2 Solutions
2.1
2.2
(b)
(c)
2.3
(a)
T
S
=
4000 kHz.
40.
(b)
2.4
9
2.5
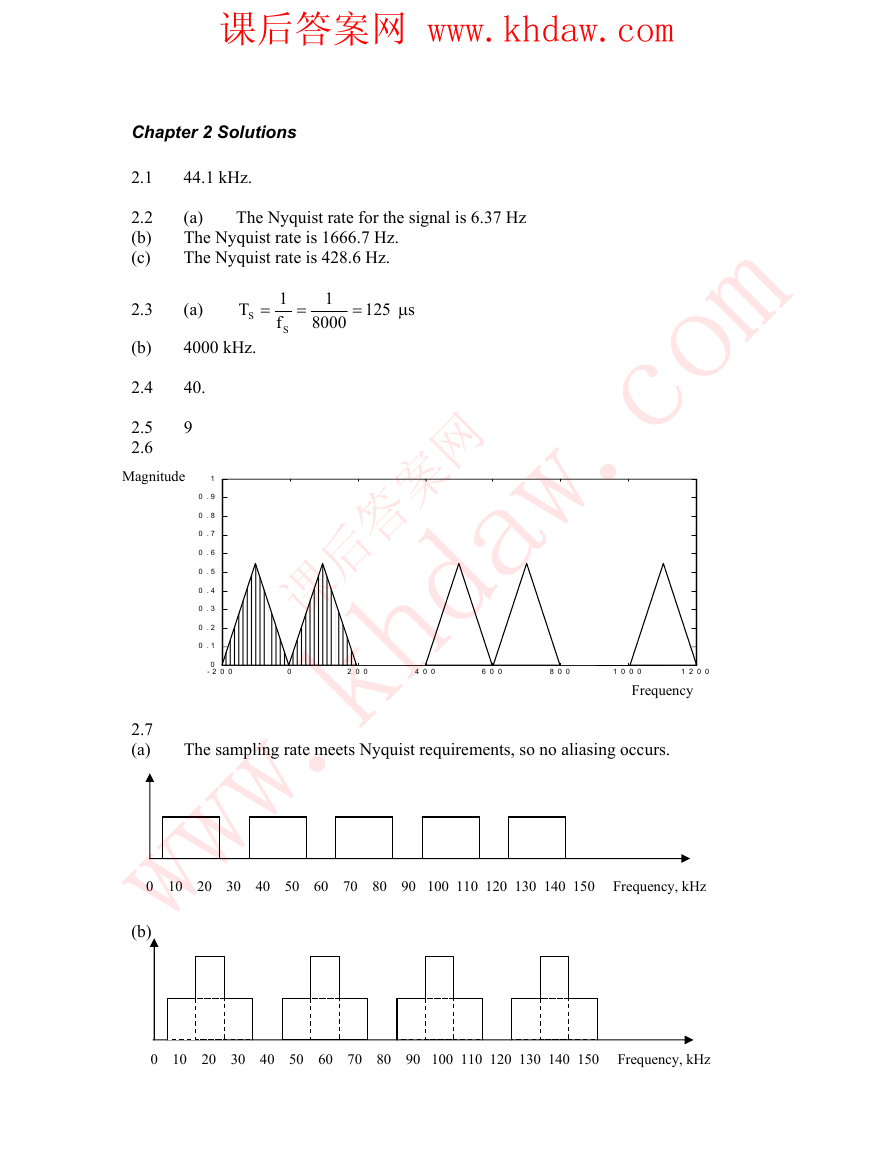
2.6
Magnitude
2.7
(a)
1
0 . 9
0 . 8
0 . 7
0 . 6
0 . 5
0 . 4
0 . 3
0 . 2
0 . 1
0
- 2 0 0
0
2 0 0
4 0 0
6 0 0
8 0 0
1 0 0 0
1 2 0 0
Frequency
The sampling rate meets Nyquist requirements, so no aliasing occurs.
0 10 20 30 40 50 60 70 80 90 100 110 120 130 140 150 Frequency, kHz
(b)
0 10 20 30 40 50 60 70 80 90 100 110 120 130 140 150 Frequency, kHz
课后答案网 www.khdaw.com�
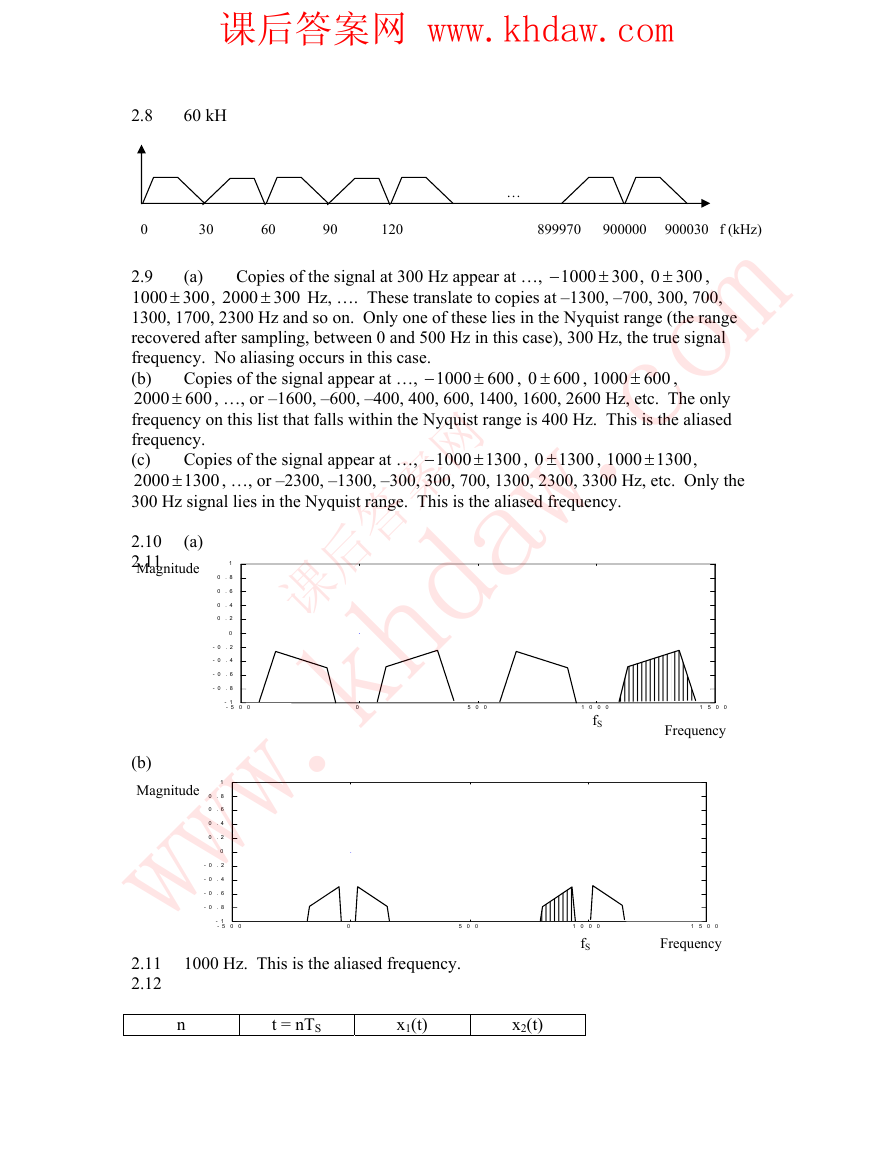
899970 900000 900030 f (kHz)
,
−
…
300
300
,
600
,
60 kH
1000 ±
(a)
300
600
,
0 ±
,
2000 ±
600
,
1000 ±
300
,
0 ±
−
1000 ±
,
1000 ±
1300
,
1000 ±
1300
0 ±
1300
, …, or –2300, –1300, –300, 300, 700, 1300, 2300, 3300 Hz, etc. Only the
Copies of the signal at 300 Hz appear at …,
Hz, …. These translate to copies at –1300, –700, 300, 700,
Copies of the signal appear at …,
600
Copies of the signal appear at …,
1300
2.8
0 30 60 90 120
2.9
1000 ±
1300, 1700, 2300 Hz and so on. Only one of these lies in the Nyquist range (the range
recovered after sampling, between 0 and 500 Hz in this case), 300 Hz, the true signal
frequency. No aliasing occurs in this case.
(b)
−
2000 ±
, …, or –1600, –600, –400, 400, 600, 1400, 1600, 2600 Hz, etc. The only
frequency on this list that falls within the Nyquist range is 400 Hz. This is the aliased
frequency.
(c)
2000 ±
300 Hz signal lies in the Nyquist range. This is the aliased frequency.
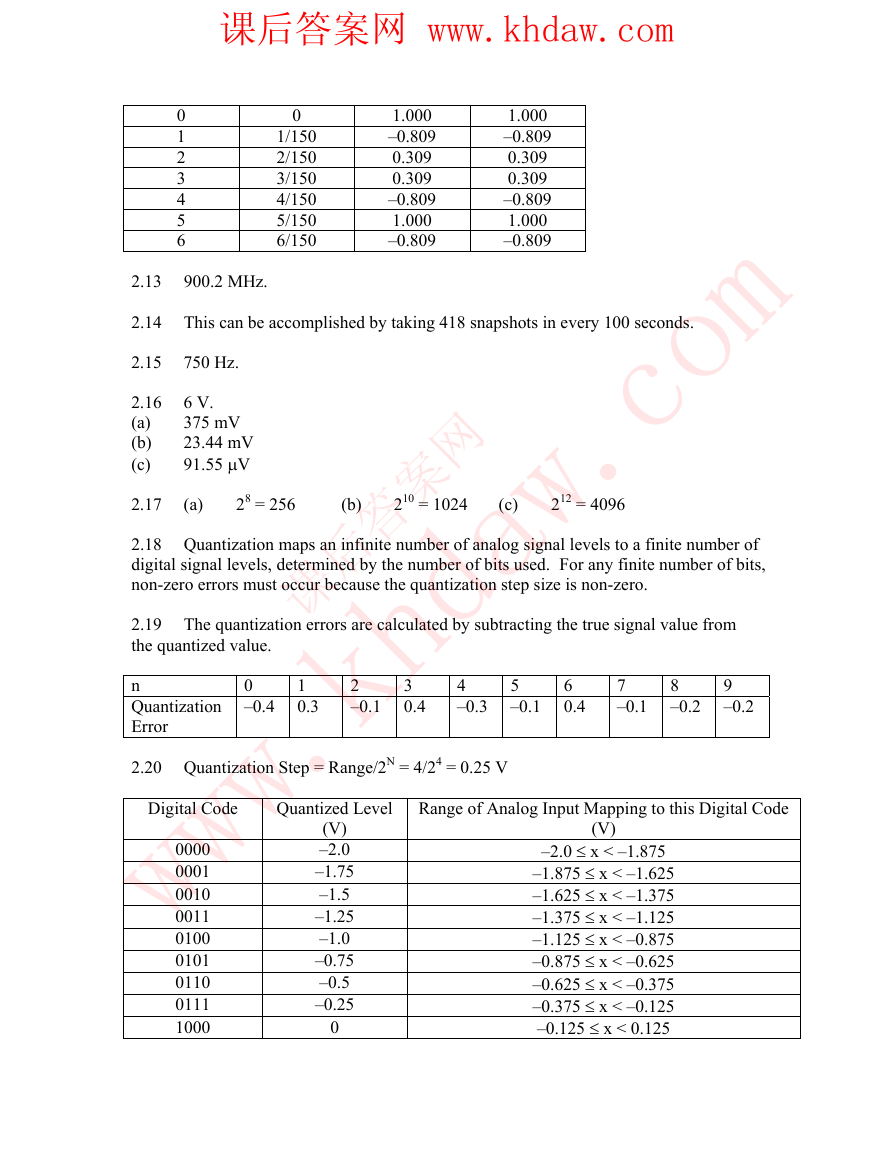
2.10
(a)
2.11
Magnitude
(b)
Magnitude
2.11
2.12
1000 Hz. This is the aliased frequency.
Frequency
Frequency
0 . 8
0 . 6
0 . 4
0 . 2
0 . 8
0 . 6
0 . 4
0 . 2
- 0 . 4
- 0 . 6
- 0 . 2
- 0 . 4
- 0 . 6
- 0 . 8
- 1
- 5 0 0
- 1
- 5 0 0
1 0 0 0
fS
1 0 0 0
fS
- 0 . 2
- 0 . 8
0
5 0 0
0
5 0 0
1
0
1
0
1 5 0 0
1 5 0 0
n
t = nTS
x1(t)
x2(t)
课后答案网 www.khdaw.com�
1.000
–0.809
0.309
0.309
–0.809
1.000
–0.809
1.000
–0.809
0.309
0.309
–0.809
1.000
–0.809
0
1/150
2/150
3/150
4/150
5/150
6/150
28 = 256
900.2 MHz.
6 V.
375 mV
23.44 mV
91.55 μV
2.13
2.14 This can be accomplished by taking 418 snapshots in every 100 seconds.
2.15 750 Hz.
2.16
(a)
(b)
(c)
2.17
2.18 Quantization maps an infinite number of analog signal levels to a finite number of
digital signal levels, determined by the number of bits used. For any finite number of bits,
non-zero errors must occur because the quantization step size is non-zero.
2.19 The quantization errors are calculated by subtracting the true signal value from
the quantized value.
n
Quantization
Error
2.20 Quantization Step = Range/2N = 4/24 = 0.25 V
0
–0.4
212 = 4096
2
–0.1
(b)
210 = 1024
(c)
4
–0.3
8
–0.2
9
–0.2
3
0.4
5
–0.1
6
0.4
7
–0.1
1
0.3
Digital Code
Quantized Level
Range of Analog Input Mapping to this Digital Code
0
1
2
3
4
5
6
(a)
0000
0001
0010
0011
0100
0101
0110
0111
1000
(V)
–2.0
–1.75
–1.5
–1.25
–1.0
–0.75
–0.5
–0.25
0
(V)
–2.0 ≤ x < –1.875
–1.875 ≤ x < –1.625
–1.625 ≤ x < –1.375
–1.375 ≤ x < –1.125
–1.125 ≤ x < –0.875
–0.875 ≤ x < –0.625
–0.625 ≤ x < –0.375
–0.375 ≤ x < –0.125
–0.125 ≤ x < 0.125
课后答案网 www.khdaw.com�
1001
1010
1011
1100
1101
1110
1111
0.25
0.5
0.75
1.0
1.25
1.5
1.75
0.125 ≤ x < 0.375
0.375 ≤ x < 0.625
0.625 ≤ x < 0.875
0.875 ≤ x < 1.125
1.125 ≤ x < 1.375
1.375 ≤ x < 1.625
1.625 ≤ x < 2.0
Digital
Code
Quantized
Value
0111
0110
0101
0100
0011
0010
0001
0000
1111
1110
1101
1100
1011
1010
1001
1000
2
1.5
1
0.5
0
-0.5
-1
-1.5
-2
-2
-1.5
-1
-0.5
0
0.5
1
1.5
2
Analog Sample Value
2.21
n
Digital Code
001
111
001
110
110
010
100
011
100
101
Quantized Level
(V)
0.625
4.375
0.625
3.750
3.750
1.250
2.500
1.875
2.500
3.125
Quantization
Error (V)
0.0535
–0.5825
0.0000
0.1375
–0.3000
0.2945
–0.2825
0.3125
–0.25
0.2495
Analog Sample
(V)
0.5715
4.9575
0.625
3.6125
4.0500
0.9555
2.7825
1.5625
2.7500
2.8755
0
1
2
3
4
5
6
7
8
9
2.22 Dynamic Range = 20 log (2N)
(a)
(b)
(c)
24.1 dB
48.2 dB
96.3 dB
课后答案网 www.khdaw.com�
2.23 N = 10.
2.24 N = 3
2.25
2.26
2.27 The table shows the proportional voltages that result for each 3-bit code.
128 kbps
96 kbps.
Digital Code
Proportional Analog Voltage
000
001
010
011
100
101
110
111
0.0000
0.7143
1.4286
2.1429
2.8571
3.5714
4.2857
5.0000
4.5
3.5
5
4
Voltage
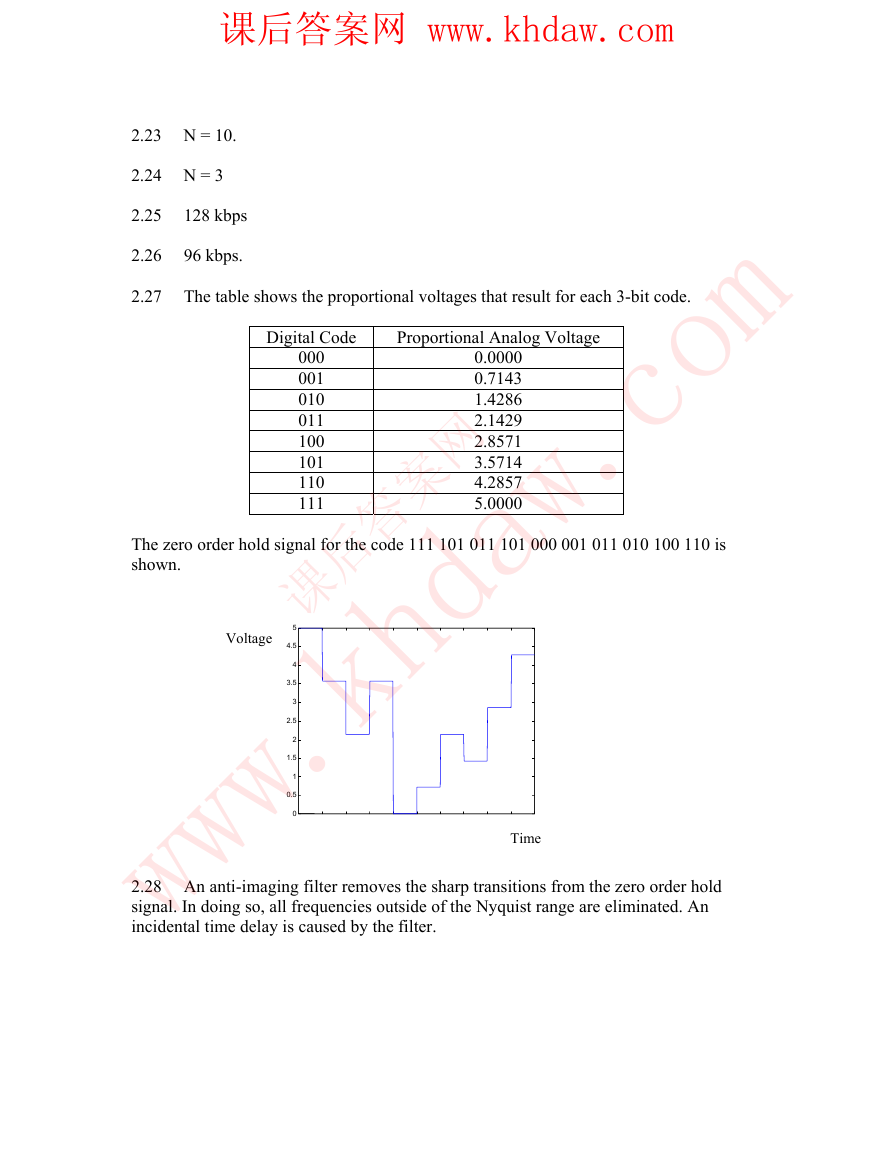
The zero order hold signal for the code 111 101 011 101 000 001 011 010 100 110 is
shown.
2.28 An anti-imaging filter removes the sharp transitions from the zero order hold
signal. In doing so, all frequencies outside of the Nyquist range are eliminated. An
incidental time delay is caused by the filter.
450
500
Time
150
0
0
300
350
200
3
2
1
50
100
2.5
1.5
250
400
0.5
课后答案网 www.khdaw.com�



 2023年江西萍乡中考道德与法治真题及答案.doc
 2012年重庆南川中考生物真题及答案.doc
 2013年江西师范大学地理学综合及文艺理论基础考研真题.doc
 2020年四川甘孜小升初语文真题及答案I卷.doc
 2020年注册岩土工程师专业基础考试真题及答案.doc
 2023-2024学年福建省厦门市九年级上学期数学月考试题及答案.doc
 2021-2022学年辽宁省沈阳市大东区九年级上学期语文期末试题及答案.doc
 2022-2023学年北京东城区初三第一学期物理期末试卷及答案.doc
 2018上半年江西教师资格初中地理学科知识与教学能力真题及答案.doc
 2012年河北国家公务员申论考试真题及答案-省级.doc
 2020-2021学年江苏省扬州市江都区邵樊片九年级上学期数学第一次质量检测试题及答案.doc
 2022下半年黑龙江教师资格证中学综合素质真题及答案.doc