Datasheet SGP30
Sensirion Gas Platform
Multi-pixel gas sensor for indoor air quality applications
Outstanding long-term stability
I2C interface with TVOC and CO2eq output signals
Very small 6-pin DFN package: 2.45 x 2.45 x 0.9 mm3
Low power consumption: 48 mA at 1.8V
Tape and reel packaged, reflow solderable
Product Summary
integration
The SGP30 is a digital multi-pixel gas sensor designed for
easy
into air purifier, demand-controlled
ventilation, and IoT applications. Sensirion’s CMOSens®
technology offers a complete sensor system on a single
chip featuring a digital I2C interface, a temperature
controlled micro hotplate, and two preprocessed indoor air
quality signals. As the first metal-oxide gas sensor
featuring multiple sensing elements on one chip, the
SGP30 provides more detailed information about the air
quality.
in
The sensing element features an unmatched robustness
against contaminating gases present
real-world
applications enabling a unique long-term stability and low
drift. The very small 2.45 x 2.45 x 0.9 mm3 DFN package
enables applications
limited spaces. Sensirion’s
state-of-the-art production process guarantees high
reproducibility and reliability. Tape and reel packaging,
together with suitability for standard SMD assembly
processes make the SGP30 predestined for high-volume
applications.
in
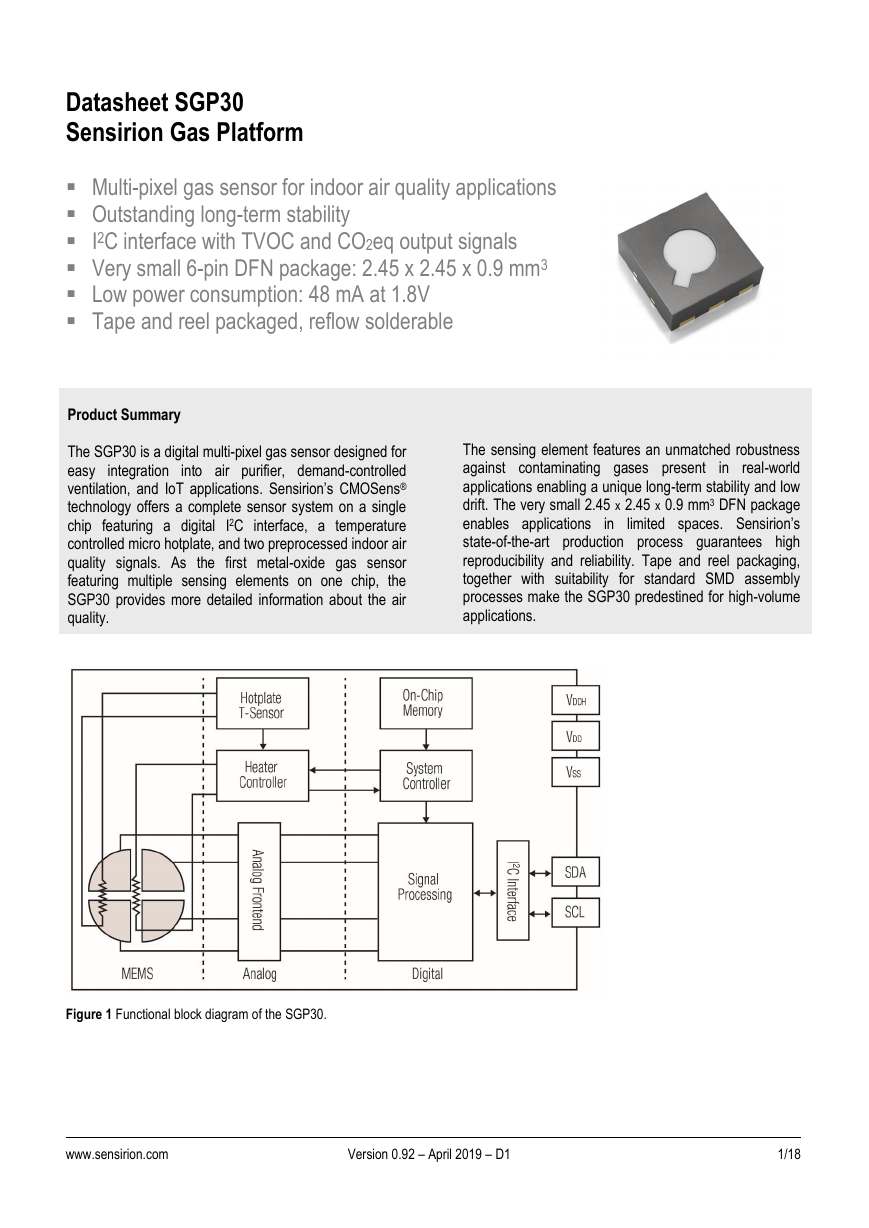
Figure 1 Functional block diagram of the SGP30.
www.sensirion.com
Version 0.92 – April 2019 – D1
1/18
�
1 Sensor Performance
1.1 Gas Sensing Performance
The values listed in Table 1 are valid at 25°C, 50% RH and typical VDD.
Parameter
Signal
Values
Comments
Measurement
range1
Specified range
Ethanol signal
0 ppm2 to 1000 ppm
H2 signal
0 ppm to 1000 ppm
Ethanol signal
0.3 ppm to 30 ppm
H2 signal
0.5 ppm to 3 ppm
The specifications below are defined for this measurement
range. The specified measurement range covers the gas
concentrations expected in indoor air quality applications.
Accuracy is defined as
c - cset
cset
with c the measured concentration and cset
the concentration set point.
The concentration c is determined by
sref - sout
)
cref = 0.4 ppm
cref = 0.5 ppm
Ethanol signal
see Figure 2
typ.: 15% of meas. value
Accuracy3
c = cref ∙ exp (
512
H2 signal
see Figure 3
typ.: 10% of meas. value
with
sout: Ethanol/Hydrogen signal output
at concentration c
sref: Ethanol/Hydrogen signal output
at 0.5 ppm H2
Long-term
drift3,4
Resolution
Sampling
frequency
Ethanol signal
H2 signal
Ethanol signal
H2 signal
Ethanol signal
H2 signal
see Figure 4
typ.: 1.3% of meas. value
see Figure 5
typ.: 1.3% of meas. value
Change of accuracy over time: Siloxane accelerated
lifetime test5
0.2 % of meas. value
Resolution of Ethanol and Hydrogen signal outputs in
relative change of the measured concentration
Max. 40 Hz
Compare with minimum measurement duration in Table 10
Table 1 Gas sensing performance. Specifications are at 25°C, 50% RH and typical VDD. The sensors have been operated for at least 24h
before the first characterization.
1 Exposure to ethanol and H2 concentrations up to 1000 ppm have been tested. For applications requiring the measurement of higher gas
concentrations please contact Sensirion.
2 ppm: parts per million. 1 ppm = 1000 ppb (parts per billion)
3 90% of the sensors will be within the typical accuracy tolerance, >99% are within the maximum tolerance.
4 The long-term drift is stated as change of accuracy per year of operation.
5 Test conditions: operation in 250 ppm Decamethylcyclopentasiloxane (D5) for 200h simulating 10 years of operation in an indoor
environment.
www.sensirion.com
Version 0.92 – April 2019 – D1
2/18
�
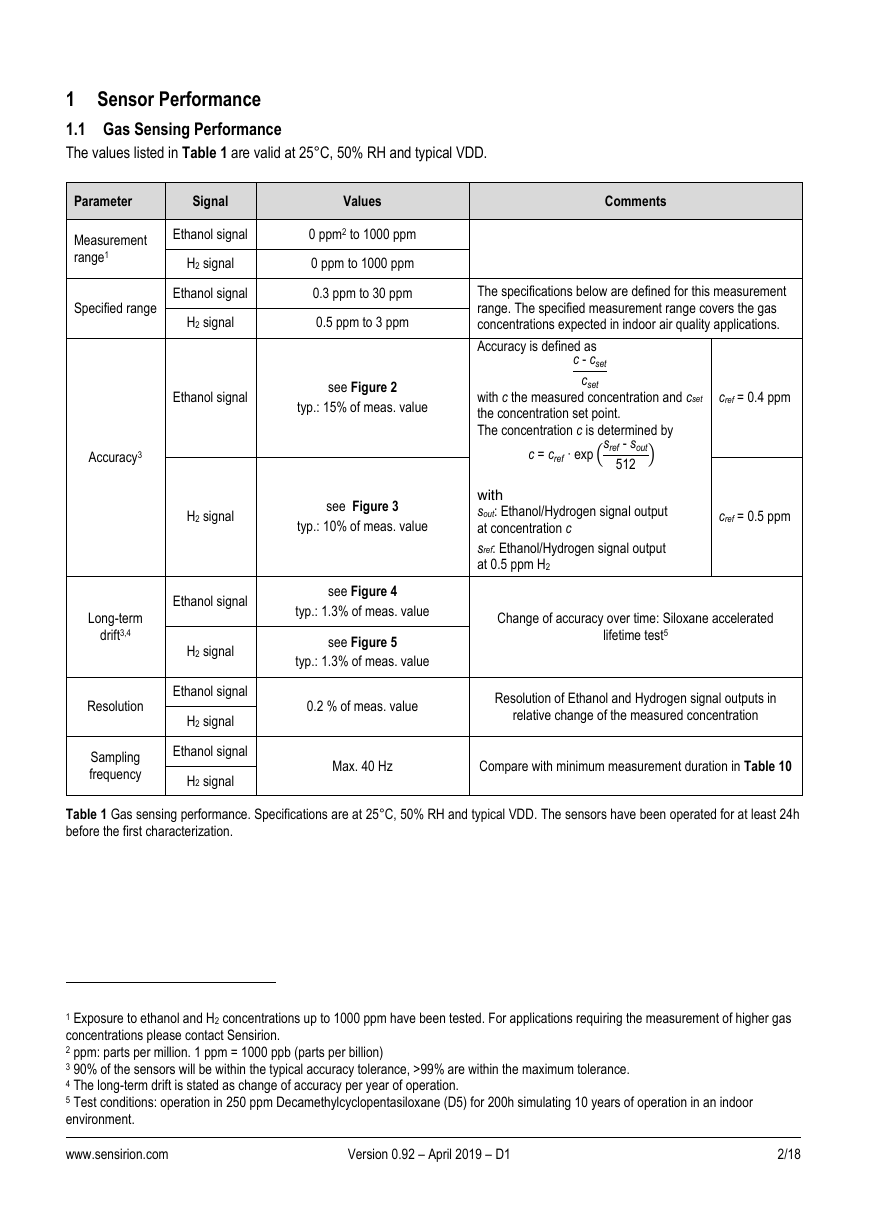
Accuracy ethanol signal
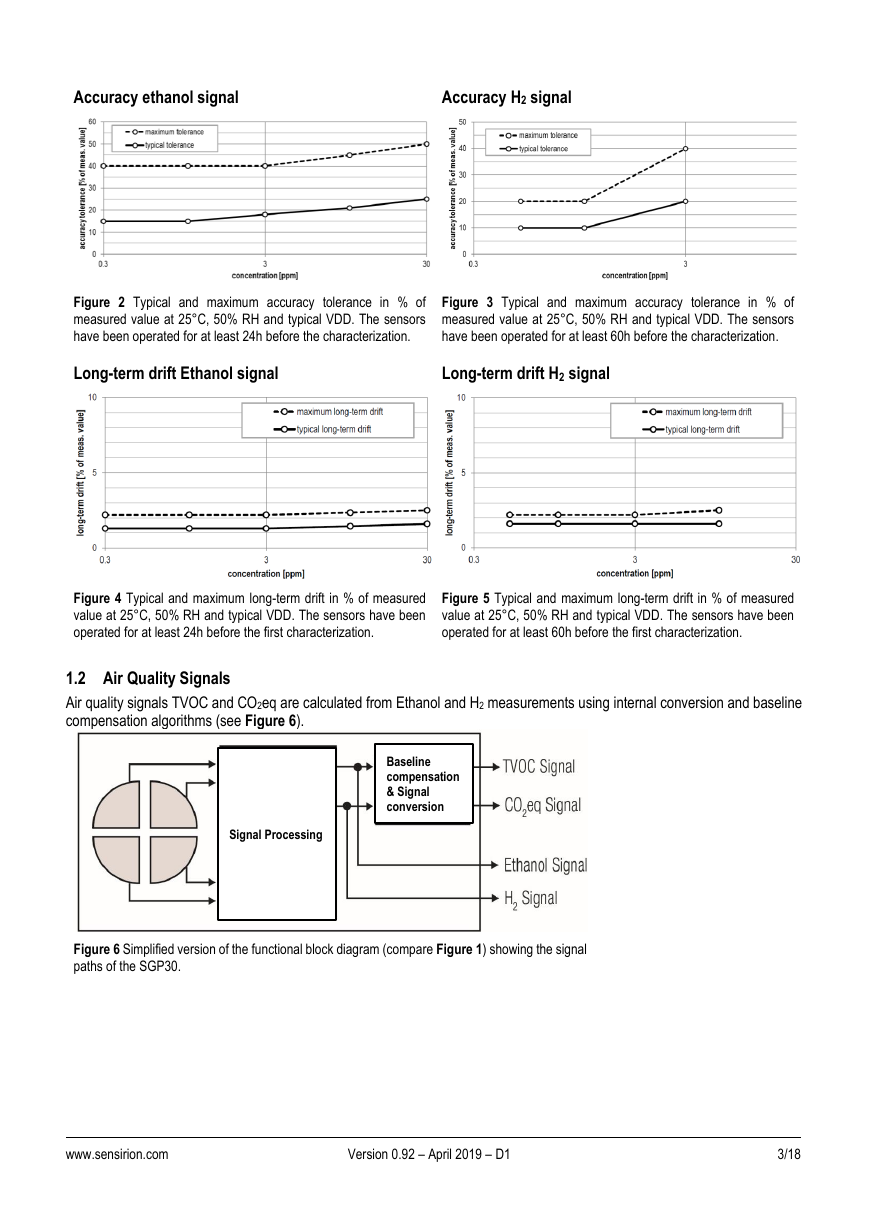
Accuracy H2 signal
Figure 2 Typical and maximum accuracy tolerance in % of
measured value at 25°C, 50% RH and typical VDD. The sensors
have been operated for at least 24h before the characterization.
Figure 3 Typical and maximum accuracy tolerance in % of
measured value at 25°C, 50% RH and typical VDD. The sensors
have been operated for at least 60h before the characterization.
Long-term drift Ethanol signal
Long-term drift H2 signal
Figure 4 Typical and maximum long-term drift in % of measured
value at 25°C, 50% RH and typical VDD. The sensors have been
operated for at least 24h before the first characterization.
Figure 5 Typical and maximum long-term drift in % of measured
value at 25°C, 50% RH and typical VDD. The sensors have been
operated for at least 60h before the first characterization.
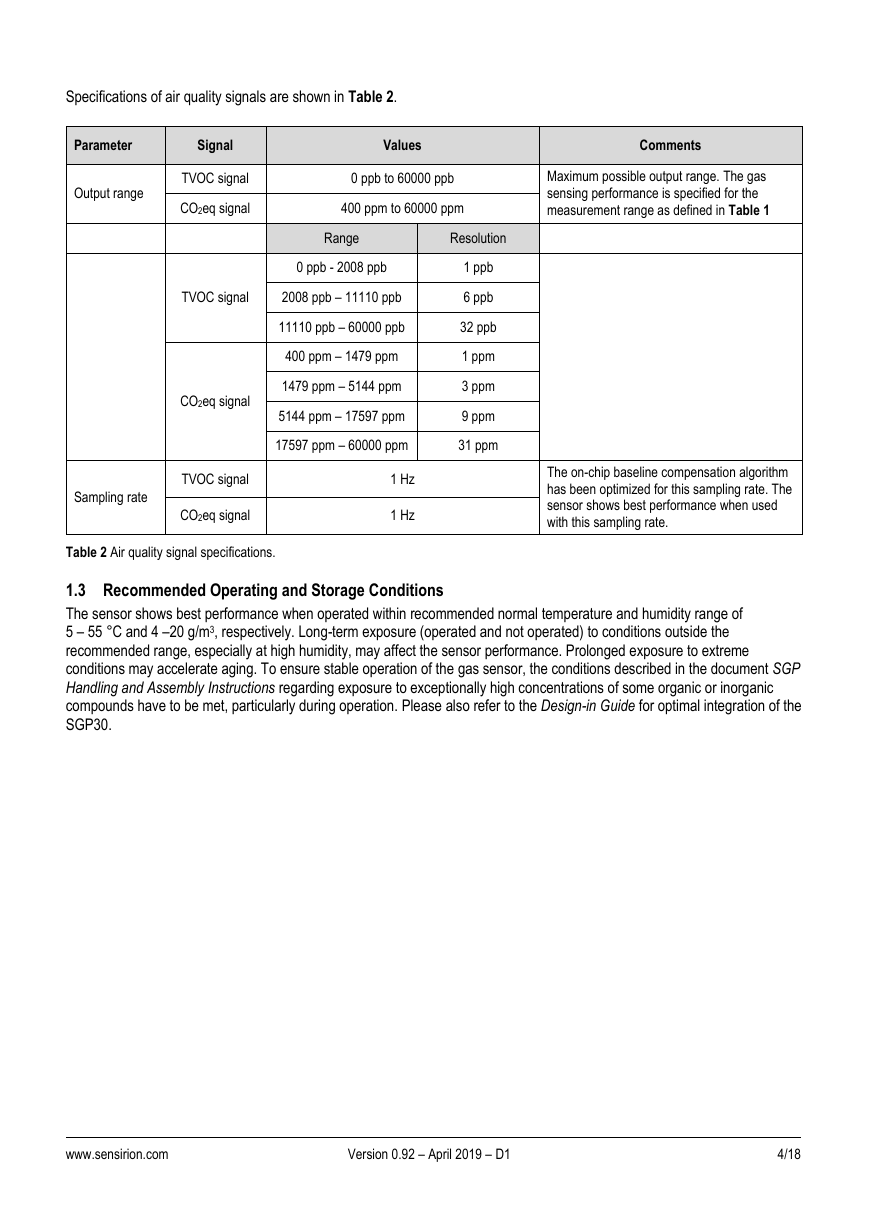
1.2 Air Quality Signals
Air quality signals TVOC and CO2eq are calculated from Ethanol and H2 measurements using internal conversion and baseline
compensation algorithms (see Figure 6).
Baseline
compensation
& Signal
conversion
Signal Processing
Figure 6 Simplified version of the functional block diagram (compare Figure 1) showing the signal
paths of the SGP30.
www.sensirion.com
Version 0.92 – April 2019 – D1
3/18
�
Specifications of air quality signals are shown in Table 2.
Parameter
Signal
Values
Comments
Output range
TVOC signal
0 ppb to 60000 ppb
CO2eq signal
400 ppm to 60000 ppm
Maximum possible output range. The gas
sensing performance is specified for the
measurement range as defined in Table 1
Range
Resolution
0 ppb - 2008 ppb
TVOC signal
2008 ppb – 11110 ppb
1 ppb
6 ppb
CO2eq signal
11110 ppb – 60000 ppb
32 ppb
400 ppm – 1479 ppm
1479 ppm – 5144 ppm
5144 ppm – 17597 ppm
1 ppm
3 ppm
9 ppm
17597 ppm – 60000 ppm
31 ppm
Sampling rate
TVOC signal
CO2eq signal
Table 2 Air quality signal specifications.
1 Hz
1 Hz
The on-chip baseline compensation algorithm
has been optimized for this sampling rate. The
sensor shows best performance when used
with this sampling rate.
1.3 Recommended Operating and Storage Conditions
The sensor shows best performance when operated within recommended normal temperature and humidity range of
5 – 55 °C and 4 –20 g/m3, respectively. Long-term exposure (operated and not operated) to conditions outside the
recommended range, especially at high humidity, may affect the sensor performance. Prolonged exposure to extreme
conditions may accelerate aging. To ensure stable operation of the gas sensor, the conditions described in the document SGP
Handling and Assembly Instructions regarding exposure to exceptionally high concentrations of some organic or inorganic
compounds have to be met, particularly during operation. Please also refer to the Design-in Guide for optimal integration of the
SGP30.
www.sensirion.com
Version 0.92 – April 2019 – D1
4/18
�
2 Electrical Specifications
Parameter
Supply voltage VDD
Hotplate supply voltage VDDH
Supply current in measurement mode6
Sleep current
LOW-level input voltage
HIGH-level input voltage
Vhys hysteresis of Schmitt trigger inputs
LOW-level output voltage
Min.
Typ.
Max.
Unit Comments
1.62
1.62
1.8
1.8
48.8
1.98
1.98
V
V
mA
2
10
μA
Minimal voltage must be guaranteed also for the
maximum supply current specified in this table.
The measurement mode is activated by sending
an “sgp30_iaq_init” or “sgp30_measure_raw”
command. Specified at 25°C and typical VDD.
The sleep mode is activated after power-up or
after a soft reset. Specified at 25°C and typical
VDD.
-0.5
0.7*VDD
0.3*VDD
VDD+0.5
V
V
0.05*VDD V
0.2*VDD
V
(open-drain) at 2mA sink current
Communication
Digital 2-wire interface, I2C fast mode.
Table 3 Electrical specifications.
3
Interface Specifications
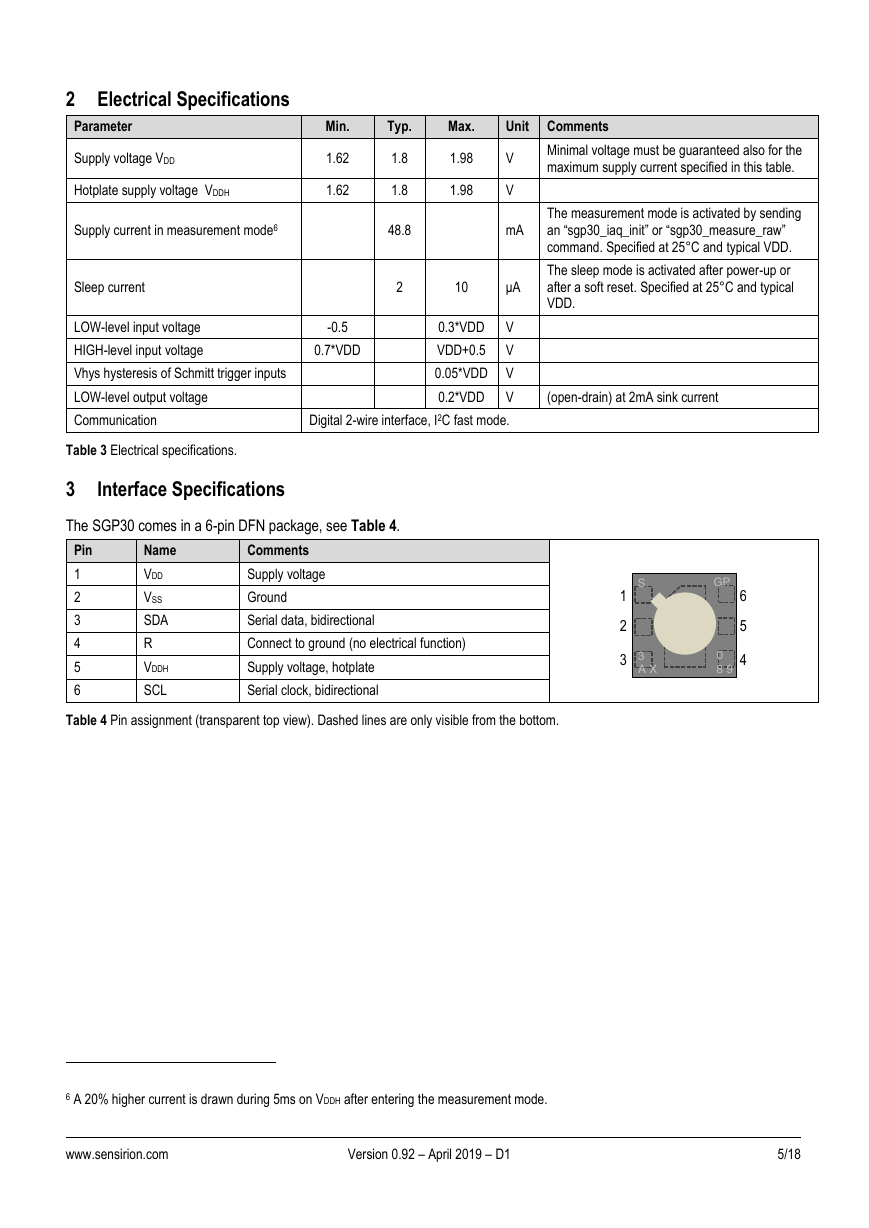
The SGP30 comes in a 6-pin DFN package, see Table 4.
Pin
Name
Comments
1
2
3
4
5
6
VDD
VSS
SDA
R
VDDH
SCL
Supply voltage
Ground
Serial data, bidirectional
Connect to ground (no electrical function)
Supply voltage, hotplate
Serial clock, bidirectional
Table 4 Pin assignment (transparent top view). Dashed lines are only visible from the bottom.
6 A 20% higher current is drawn during 5ms on VDDH after entering the measurement mode.
www.sensirion.com
Version 0.92 – April 2019 – D1
5/18
3A X0 8 9123654SGP�
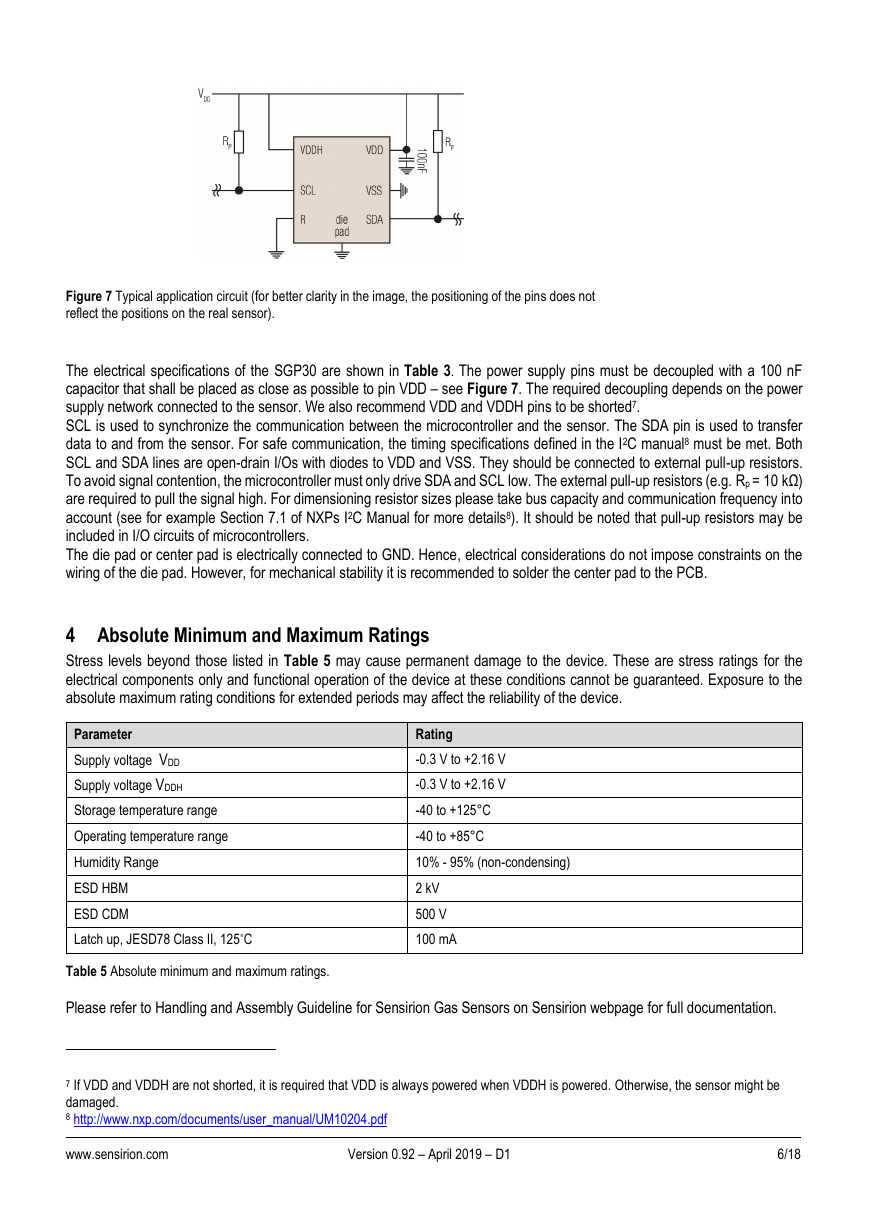
Figure 7 Typical application circuit (for better clarity in the image, the positioning of the pins does not
reflect the positions on the real sensor).
The electrical specifications of the SGP30 are shown in Table 3. The power supply pins must be decoupled with a 100 nF
capacitor that shall be placed as close as possible to pin VDD – see Figure 7. The required decoupling depends on the power
supply network connected to the sensor. We also recommend VDD and VDDH pins to be shorted7.
SCL is used to synchronize the communication between the microcontroller and the sensor. The SDA pin is used to transfer
data to and from the sensor. For safe communication, the timing specifications defined in the I2C manual8 must be met. Both
SCL and SDA lines are open-drain I/Os with diodes to VDD and VSS. They should be connected to external pull-up resistors.
To avoid signal contention, the microcontroller must only drive SDA and SCL low. The external pull-up resistors (e.g. Rp = 10 kΩ)
are required to pull the signal high. For dimensioning resistor sizes please take bus capacity and communication frequency into
account (see for example Section 7.1 of NXPs I2C Manual for more details8). It should be noted that pull-up resistors may be
included in I/O circuits of microcontrollers.
The die pad or center pad is electrically connected to GND. Hence, electrical considerations do not impose constraints on the
wiring of the die pad. However, for mechanical stability it is recommended to solder the center pad to the PCB.
4 Absolute Minimum and Maximum Ratings
Stress levels beyond those listed in Table 5 may cause permanent damage to the device. These are stress ratings for the
electrical components only and functional operation of the device at these conditions cannot be guaranteed. Exposure to the
absolute maximum rating conditions for extended periods may affect the reliability of the device.
Parameter
Supply voltage VDD
Supply voltage VDDH
Storage temperature range
Operating temperature range
Humidity Range
ESD HBM
ESD CDM
Latch up, JESD78 Class II, 125°C
Table 5 Absolute minimum and maximum ratings.
Rating
-0.3 V to +2.16 V
-0.3 V to +2.16 V
-40 to +125°C
-40 to +85°C
10% - 95% (non-condensing)
2 kV
500 V
100 mA
Please refer to Handling and Assembly Guideline for Sensirion Gas Sensors on Sensirion webpage for full documentation.
7 If VDD and VDDH are not shorted, it is required that VDD is always powered when VDDH is powered. Otherwise, the sensor might be
damaged.
8 http://www.nxp.com/documents/user_manual/UM10204.pdf
www.sensirion.com
Version 0.92 – April 2019 – D1
6/18
�
5 Timing Specifications
5.1 Sensor System Timings
The timings refer to the power up and reset of the ASIC part and do not reflect the usefulness of the readings.
Parameter
Symbol
Condition
Min.
Typ.
Max. Unit
Comments
Power-up time
Soft reset time
tPU
tSR
After hard reset, VDD ≥VPOR
After soft reset
-
-
0.4
0.4
0.6
0.6
ms
ms
-
-
Table 6 System timing specifications.
5.2 Communication Timings
Parameter
Symbol Conditions
Min.
Typ.
Max.
Units
Comments
0
0.6
1.3
0.6
0.6
0
100
-
-
-
0.6
-
-
-
-
-
-
-
-
-
-
-
400
-
-
-
-
-
-
300
300
0.9
-
400
kHz
µs
µs
µs
µs
ns
ns
ns
ns
µs
µs
pF
-
-
-
-
-
-
-
-
-
-
-
-
SCL clock frequency
fSCL
-
time
Hold
condition
(repeated) START
tHD;STA
After this period, the
first clock pulse
is
generated
LOW period of the SCL clock
HIGH period of the SCL clock
Set-up time for a repeated START
condition
SDA hold time
SDA set-up time
SCL/SDA rise time
SCL/SDA fall time
SDA valid time
tLOW
tHIGH
tSU;STA
tHD;DAT
tSU;DAT
tR
tF
tVD;DAT
Set-up time for STOP condition
tSU;STO
Capacitive load on bus line
CB
Table 7 Communication timing specifications.
-
-
-
-
-
-
-
-
-
-
1/fSCL
tHIGH
tLOW
tR
tF
SCL
tSU;DAT
tHD;DAT
DATA IN
SDA
DATA OUT
SDA
tVD;DAT
tF
70%
30%
70%
30%
tR
70%
30%
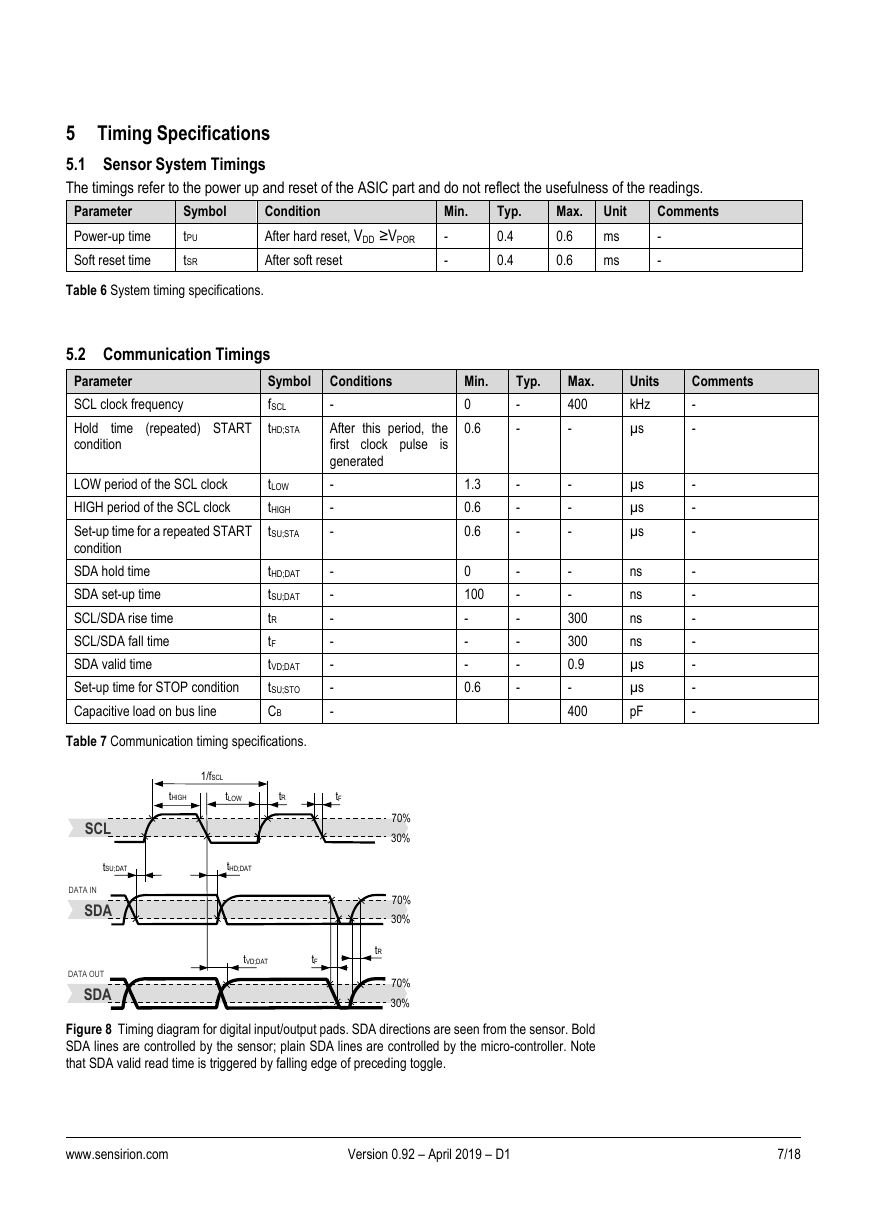
Figure 8 Timing diagram for digital input/output pads. SDA directions are seen from the sensor. Bold
SDA lines are controlled by the sensor; plain SDA lines are controlled by the micro-controller. Note
that SDA valid read time is triggered by falling edge of preceding toggle.
www.sensirion.com
Version 0.92 – April 2019 – D1
7/18
�
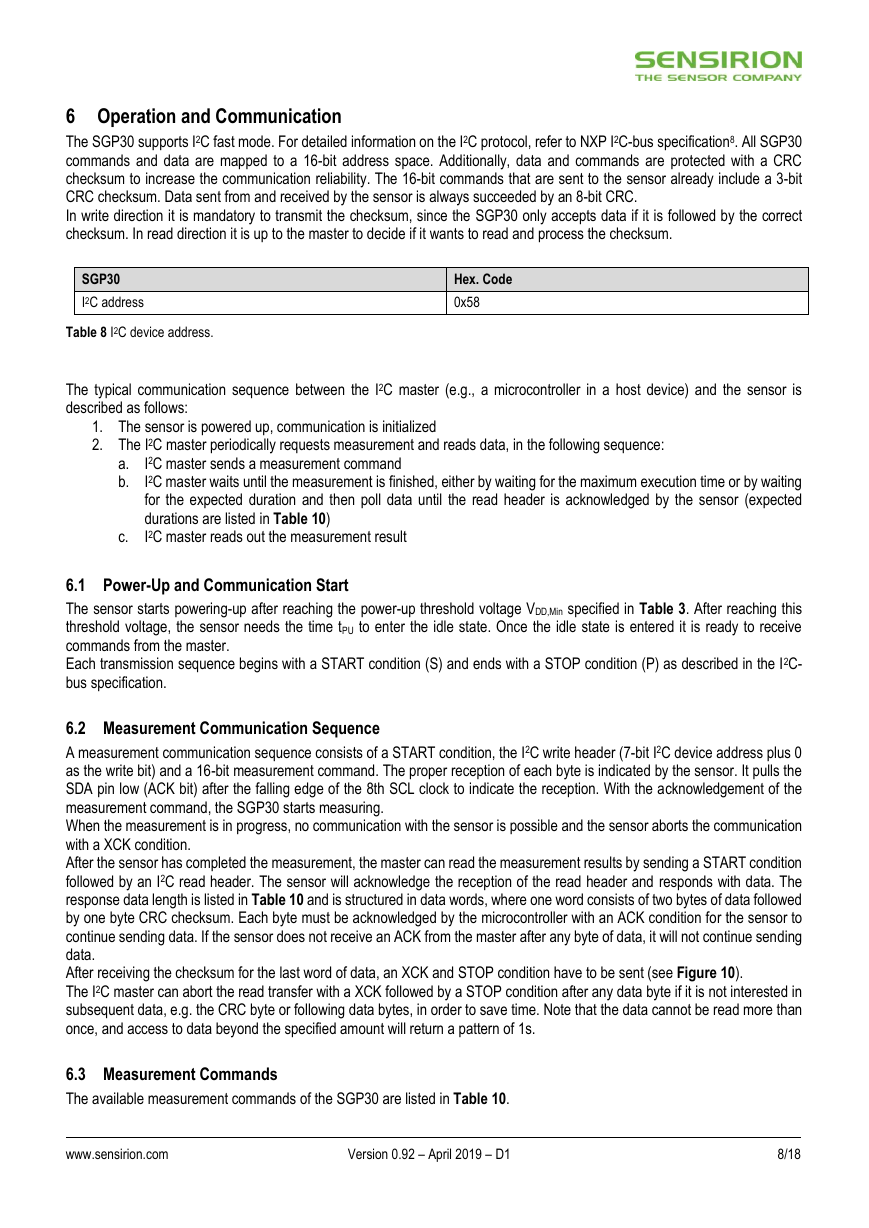
6 Operation and Communication
The SGP30 supports I2C fast mode. For detailed information on the I2C protocol, refer to NXP I2C-bus specification8. All SGP30
commands and data are mapped to a 16-bit address space. Additionally, data and commands are protected with a CRC
checksum to increase the communication reliability. The 16-bit commands that are sent to the sensor already include a 3-bit
CRC checksum. Data sent from and received by the sensor is always succeeded by an 8-bit CRC.
In write direction it is mandatory to transmit the checksum, since the SGP30 only accepts data if it is followed by the correct
checksum. In read direction it is up to the master to decide if it wants to read and process the checksum.
SGP30
I2C address
Table 8 I2C device address.
Hex. Code
0x58
The typical communication sequence between the I2C master (e.g., a microcontroller in a host device) and the sensor is
described as follows:
1. The sensor is powered up, communication is initialized
2. The I2C master periodically requests measurement and reads data, in the following sequence:
a.
b.
c.
I2C master sends a measurement command
I2C master waits until the measurement is finished, either by waiting for the maximum execution time or by waiting
for the expected duration and then poll data until the read header is acknowledged by the sensor (expected
durations are listed in Table 10)
I2C master reads out the measurement result
6.1 Power-Up and Communication Start
The sensor starts powering-up after reaching the power-up threshold voltage VDD,Min specified in Table 3. After reaching this
threshold voltage, the sensor needs the time tPU to enter the idle state. Once the idle state is entered it is ready to receive
commands from the master.
Each transmission sequence begins with a START condition (S) and ends with a STOP condition (P) as described in the I2C-
bus specification.
6.2 Measurement Communication Sequence
A measurement communication sequence consists of a START condition, the I2C write header (7-bit I2C device address plus 0
as the write bit) and a 16-bit measurement command. The proper reception of each byte is indicated by the sensor. It pulls the
SDA pin low (ACK bit) after the falling edge of the 8th SCL clock to indicate the reception. With the acknowledgement of the
measurement command, the SGP30 starts measuring.
When the measurement is in progress, no communication with the sensor is possible and the sensor aborts the communication
with a XCK condition.
After the sensor has completed the measurement, the master can read the measurement results by sending a START condition
followed by an I2C read header. The sensor will acknowledge the reception of the read header and responds with data. The
response data length is listed in Table 10 and is structured in data words, where one word consists of two bytes of data followed
by one byte CRC checksum. Each byte must be acknowledged by the microcontroller with an ACK condition for the sensor to
continue sending data. If the sensor does not receive an ACK from the master after any byte of data, it will not continue sending
data.
After receiving the checksum for the last word of data, an XCK and STOP condition have to be sent (see Figure 10).
The I2C master can abort the read transfer with a XCK followed by a STOP condition after any data byte if it is not interested in
subsequent data, e.g. the CRC byte or following data bytes, in order to save time. Note that the data cannot be read more than
once, and access to data beyond the specified amount will return a pattern of 1s.
6.3 Measurement Commands
The available measurement commands of the SGP30 are listed in Table 10.
www.sensirion.com
Version 0.92 – April 2019 – D1
8/18
�


 2023年江西萍乡中考道德与法治真题及答案.doc
 2012年重庆南川中考生物真题及答案.doc
 2013年江西师范大学地理学综合及文艺理论基础考研真题.doc
 2020年四川甘孜小升初语文真题及答案I卷.doc
 2020年注册岩土工程师专业基础考试真题及答案.doc
 2023-2024学年福建省厦门市九年级上学期数学月考试题及答案.doc
 2021-2022学年辽宁省沈阳市大东区九年级上学期语文期末试题及答案.doc
 2022-2023学年北京东城区初三第一学期物理期末试卷及答案.doc
 2018上半年江西教师资格初中地理学科知识与教学能力真题及答案.doc
 2012年河北国家公务员申论考试真题及答案-省级.doc
 2020-2021学年江苏省扬州市江都区邵樊片九年级上学期数学第一次质量检测试题及答案.doc
 2022下半年黑龙江教师资格证中学综合素质真题及答案.doc