Team # 2003376 Page 1 of 24
Problem Chosen
F
2020
MCM/ICM
Summary Sheet
Team Control Number
2003376
Research on Prediction and Optimization of EDPs Problems Based on Human
Rights and Cultural Protection
Summary
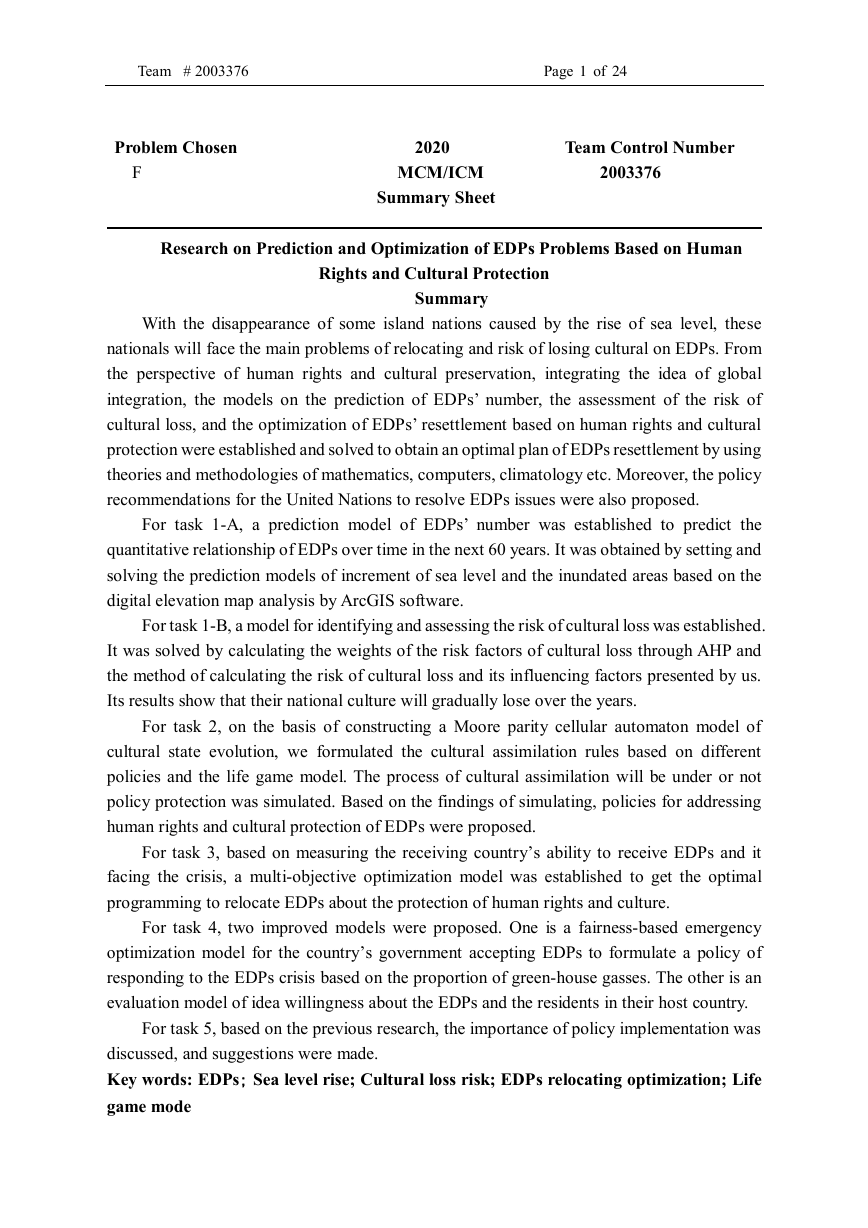
With the disappearance of some island nations caused by the rise of sea level, these
nationals will face the main problems of relocating and risk of losing cultural on EDPs. From
the perspective of human rights and cultural preservation, integrating the idea of global
integration, the models on the prediction of EDPs’ number, the assessment of the risk of
cultural loss, and the optimization of EDPs’ resettlement based on human rights and cultural
protection were established and solved to obtain an optimal plan of EDPs resettlement by using
theories and methodologies of mathematics, computers, climatology etc. Moreover, the policy
recommendations for the United Nations to resolve EDPs issues were also proposed.
For task 1-A, a prediction model of EDPs’ number was established to predict the
quantitative relationship of EDPs over time in the next 60 years. It was obtained by setting and
solving the prediction models of increment of sea level and the inundated areas based on the
digital elevation map analysis by ArcGIS software.
For task 1-B, a model for identifying and assessing the risk of cultural loss was established.
It was solved by calculating the weights of the risk factors of cultural loss through AHP and
the method of calculating the risk of cultural loss and its influencing factors presented by us.
Its results show that their national culture will gradually lose over the years.
For task 2, on the basis of constructing a Moore parity cellular automaton model of
cultural state evolution, we formulated the cultural assimilation rules based on different
policies and the life game model. The process of cultural assimilation will be under or not
policy protection was simulated. Based on the findings of simulating, policies for addressing
human rights and cultural protection of EDPs were proposed.
For task 3, based on measuring the receiving country’s ability to receive EDPs and it
facing the crisis, a multi-objective optimization model was established to get the optimal
programming to relocate EDPs about the protection of human rights and culture.
For task 4, two improved models were proposed. One is a fairness-based emergency
optimization model for the country’s government accepting EDPs to formulate a policy of
responding to the EDPs crisis based on the proportion of green-house gasses. The other is an
evaluation model of idea willingness about the EDPs and the residents in their host country.
For task 5, based on the previous research, the importance of policy implementation was
discussed, and suggestions were made.
Key words: EDPs; Sea level rise; Cultural loss risk; EDPs relocating optimization; Life
game mode
�
Team # 2003376 Page 2 of 24
Content
1.Introduction .............................................................................................................................................. 3
1.1 Background ............................................................................................................................ 3
1.2 Restatement of Problems ........................................................................................................ 3
2. Assumptions and Symbol Table .............................................................................................................. 3
2.1 Assumptions ........................................................................................................................... 3
2.2 Symbols and Definitions ........................................................................................................ 4
3 Models and results .................................................................................................................................... 5
3 .1 Task1-A EDP number prediction model ................................................................................ 5
3.1.1 Modeling ideas ........................................................................................................... 5
3.1.2 Establishment of EDP Prediction Model .................................................................... 5
3.1.3 EDP Population Prediction Model and its Results and Analysis ................................ 7
3.2 Task1-B Evaluation model of EDP culture loss risk .............................................................. 8
3.2.1 Modeling ideas ........................................................................................................... 8
3.2.2 Identification and assessment of cultural loss risk ..................................................... 8
3.2.3 Solution and result of the model............................................................................... 10
3.3 Task2 Cultural protection model based on different policies ................................................ 11
3.3.1 Modeling ideas ......................................................................................................... 11
3.3.2 Modeling .................................................................................................................. 11
3.3.3 Solution of the model and its results and policy recommendation ........................... 12
3.4 Task3 An optimization model of refugee resettlement based on the protection ................... 14
3.4.1 Modeling ideas ......................................................................................................... 14
3.4.2 Establishment of a Metric Model for Receiving Refugees....................................... 14
3.4.3 The establishment of crisis measurement model in refugee receiving countries...... 15
3.4.4 Establishment of a bi-objective refugee resettlement optimization model based on
protection of Human Rights and culture ................................................................................... 16
3.4.5 Solution and results of optimization model .............................................................. 17
3.5 Task4 Modeling and solving of design or improvement policies ......................................... 18
3.5.1 Idea of improvement ................................................................................................ 18
3.5.2 The established optimization model measures the insufficient analysis of the policy
impact ........................................................................................................................................ 18
3.5.3 Establishment and solution of emergency model based on fairness ......................... 19
3.5.4 Establishing a Model Based on the Policy of the Emigration Country to Cope with the
Refugee Crisis ........................................................................................................................... 20
3.6 Task5 the importance of implementing proposed policies ................................................... 20
4 Sensitivity Analysis ................................................................................................................................. 21
5 Conclusion ............................................................................................................................................... 21
5.1 Strengths ............................................................................................................................... 21
5.2 Weaknesses ........................................................................................................................... 22
6 Policy recommendation letter to UN Secretary General ..................................................................... 22
7.References ............................................................................................................................................... 23
8 Appendix ................................................................................................................................................. 23
�
Team # 2003376 Page 3 of 24
1.Introduction
1.1 Background
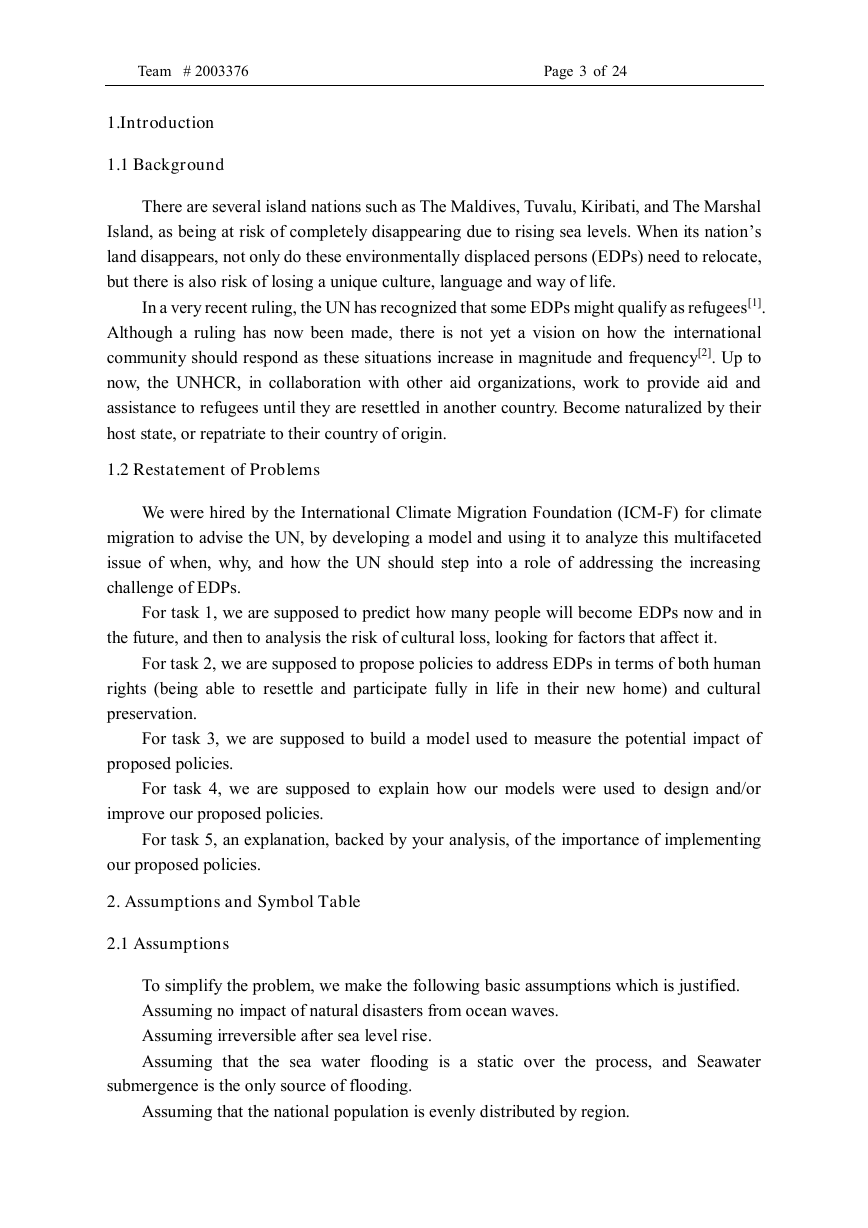
There are several island nations such as The Maldives, Tuvalu, Kiribati, and The Marshal
Island, as being at risk of completely disappearing due to rising sea levels. When its nation’s
land disappears, not only do these environmentally displaced persons (EDPs) need to relocate,
but there is also risk of losing a unique culture, language and way of life.
In a very recent ruling, the UN has recognized that some EDPs might qualify as refugees[1].
Although a ruling has now been made, there is not yet a vision on how the international
community should respond as these situations increase in magnitude and frequency[2]. Up to
now, the UNHCR, in collaboration with other aid organizations, work to provide aid and
assistance to refugees until they are resettled in another country. Become naturalized by their
host state, or repatriate to their country of origin.
1.2 Restatement of Problems
We were hired by the International Climate Migration Foundation (ICM-F) for climate
migration to advise the UN, by developing a model and using it to analyze this multifaceted
issue of when, why, and how the UN should step into a role of addressing the increasing
challenge of EDPs.
For task 1, we are supposed to predict how many people will become EDPs now and in
the future, and then to analysis the risk of cultural loss, looking for factors that affect it.
For task 2, we are supposed to propose policies to address EDPs in terms of both human
rights (being able to resettle and participate fully in life in their new home) and cultural
preservation.
For task 3, we are supposed to build a model used to measure the potential impact of
proposed policies.
For task 4, we are supposed to explain how our models were used to design and/or
improve our proposed policies.
For task 5, an explanation, backed by your analysis, of the importance of implementing
our proposed policies.
2. Assumptions and Symbol Table
2.1 Assumptions
To simplify the problem, we make the following basic assumptions which is justified.
Assuming no impact of natural disasters from ocean waves.
Assuming irreversible after sea level rise.
Assuming that the sea water flooding is a static over the process, and Seawater
submergence is the only source of flooding.
Assuming that the national population is evenly distributed by region.
�
Team # 2003376 Page 4 of 24
Supposing climate change only caused by E the DP generated.
Assuming that all people in the flooded area become EDP.
Assuming that when sea-level rise floods 80 % of a country's territory, that country is
uninhabitable and will migrate in its entirety.
Supposing that only the four countries of Maldives, Tuvalu, Kiribati, and Marshall Islands
generate EDP.
Assuming that the receiving countries of EDP are the top ten countries with global
greenhouse gas emissions.
2.2 Symbols and Definitions
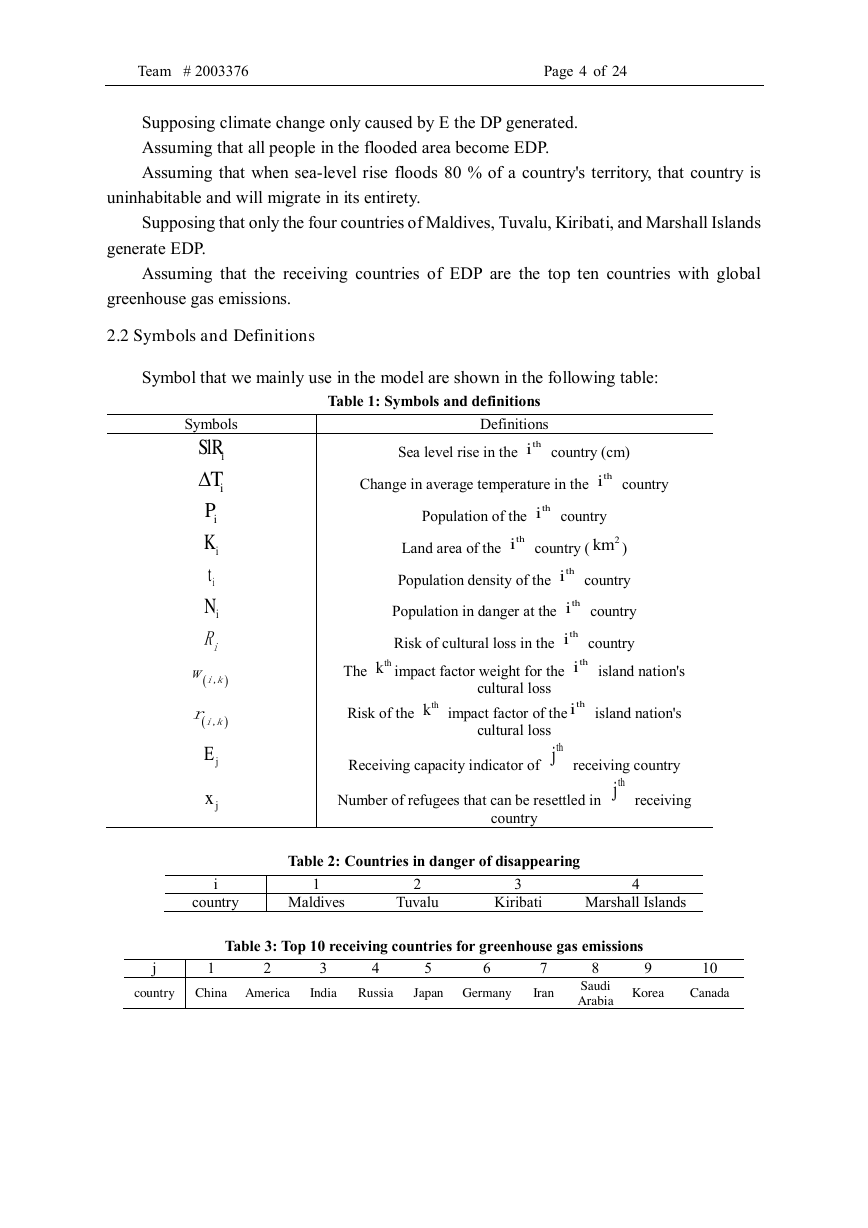
Symbol that we mainly use in the model are shown in the following table:
Symbols
Definitions
Table 1: Symbols and definitions
Sea level rise in the
country (cm)
Change in average temperature in the
country
Population of the
country
Land area of the
country (
)
Population density of the
country
Population in danger at the
country
Risk of cultural loss in the
country
The
impact factor weight for the
island nation's
cultural loss
Risk of the
impact factor of the
island nation's
cultural loss
Receiving capacity indicator of
receiving country
Number of refugees that can be resettled in
receiving
country
Table 2: Countries in danger of disappearing
i
1
2
3
4
country
Maldives
Tuvalu
Kiribati
Marshall Islands
Table 3: Top 10 receiving countries for greenhouse gas emissions
j
1
2
3
4
5
6
7
country China America
India Russia
Japan Germany
Iran
8
Saudi
Arabia
9
10
Korea
Canada
iSlRthiiTthiiPthiiKthi2kmtithiiNthiiRthi(),ikwkththi(),ikrkththijEthjjxthj�
Team # 2003376 Page 5 of 24
3 Models and results
3 .1 Task1-A EDP number prediction model
3.1.1 Modeling ideas
Tuvalu, Kiribati, Marshall Islands, and Australia are all in Oceania, the factors affecting
temperature of those are similar, so we use the Australian temperature forecast to replace the
temperature changes in the three countries. we find the temperature predictions of Australia
and Maldives through the World Meteorological Organization's National Profile Database
(WMO) firstly. we build a prediction model of sea level rise and use this model to predict the
sea level rise of the four countries in the next 60 years secondly. Then, using the elevation
digital models of the four countries, we find the area being submerged by the sea level rise in
their coastal areas, finally, the submerged area was used to predict the number of EDP at risk.
3.1.2 Establishment of EDP Prediction Model
● Sea level rise prediction model
The most important factors affecting sea level rise are the expansion of seawater and
melting of glaciers caused by rising temperatures. Temperature prediction involves many
complicated factors, many institutions have developed large-scale simulation software for this
purpose. The Greenland ice sheet is in the process of melting due to global warming. Therefore,
the issue of sea level rise is studied below based on the results of the World Meteorological
Organization's temperature prediction and the mass balance of the Greenland ice sheet [1].
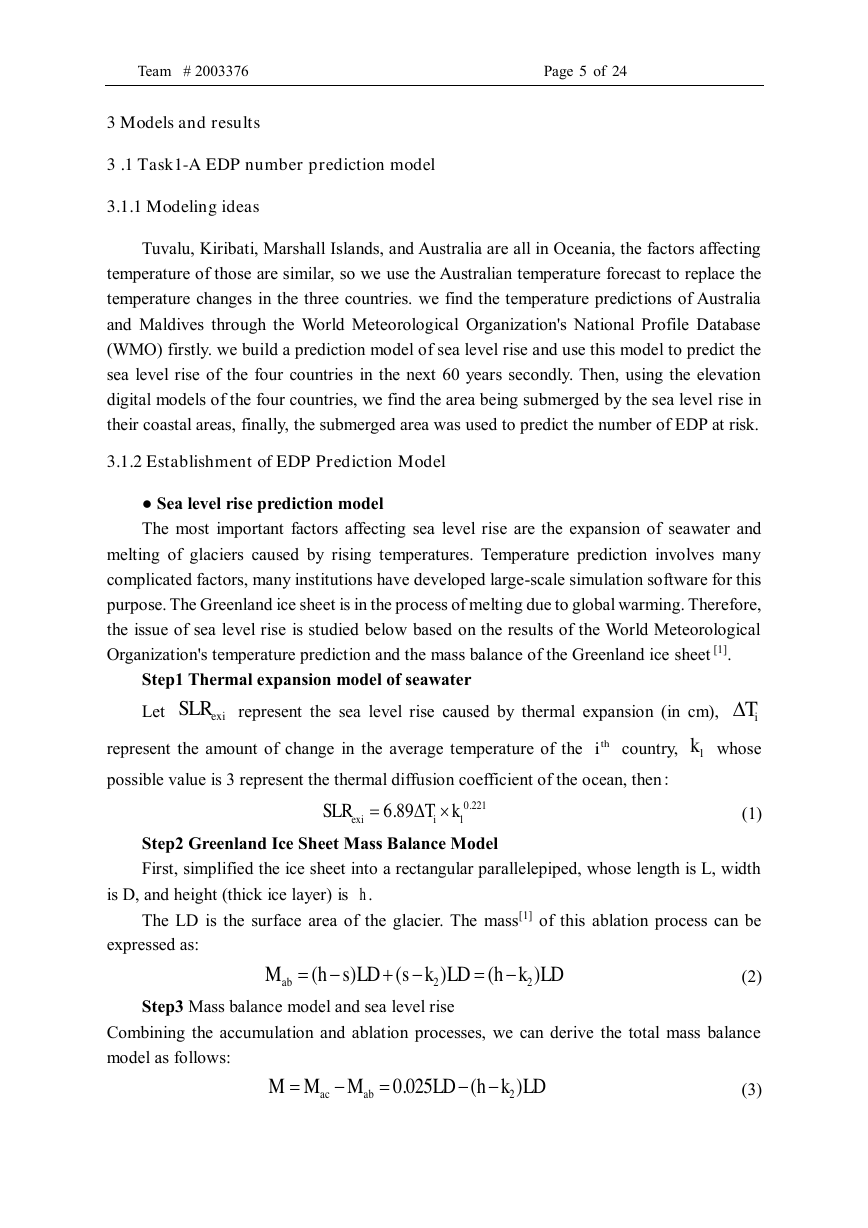
Step1 Thermal expansion model of seawater
Let
represent the sea level rise caused by thermal expansion (in cm),
represent the amount of change in the average temperature of the
country,
whose
possible value is 3 represent the thermal diffusion coefficient of the ocean, then:
(1)
Step2 Greenland Ice Sheet Mass Balance Model
First, simplified the ice sheet into a rectangular parallelepiped, whose length is L, width
is D, and height (thick ice layer) is
.
The LD is the surface area of the glacier. The mass[1] of this ablation process can be
expressed as:
Step3 Mass balance model and sea level rise
(2)
Combining the accumulation and ablation processes, we can derive the total mass balance
model as follows:
(3)
iexSLRiTthi1k0.221i16.89=exiSLRTkh22()()()=−+−=−abMhsLDskLDhkLD20.025()=−=−−acabMMMLDhkLD�
Team # 2003376 Page 6 of 24
About
,
(4)
Sea Level Rise is the result of both thermal expansion and the mass balance of the Ice
Sheet, so the formula for calculating sea level rise is:
(5)
● Prediction model of territory submergence area based on digital elevation analysis
map
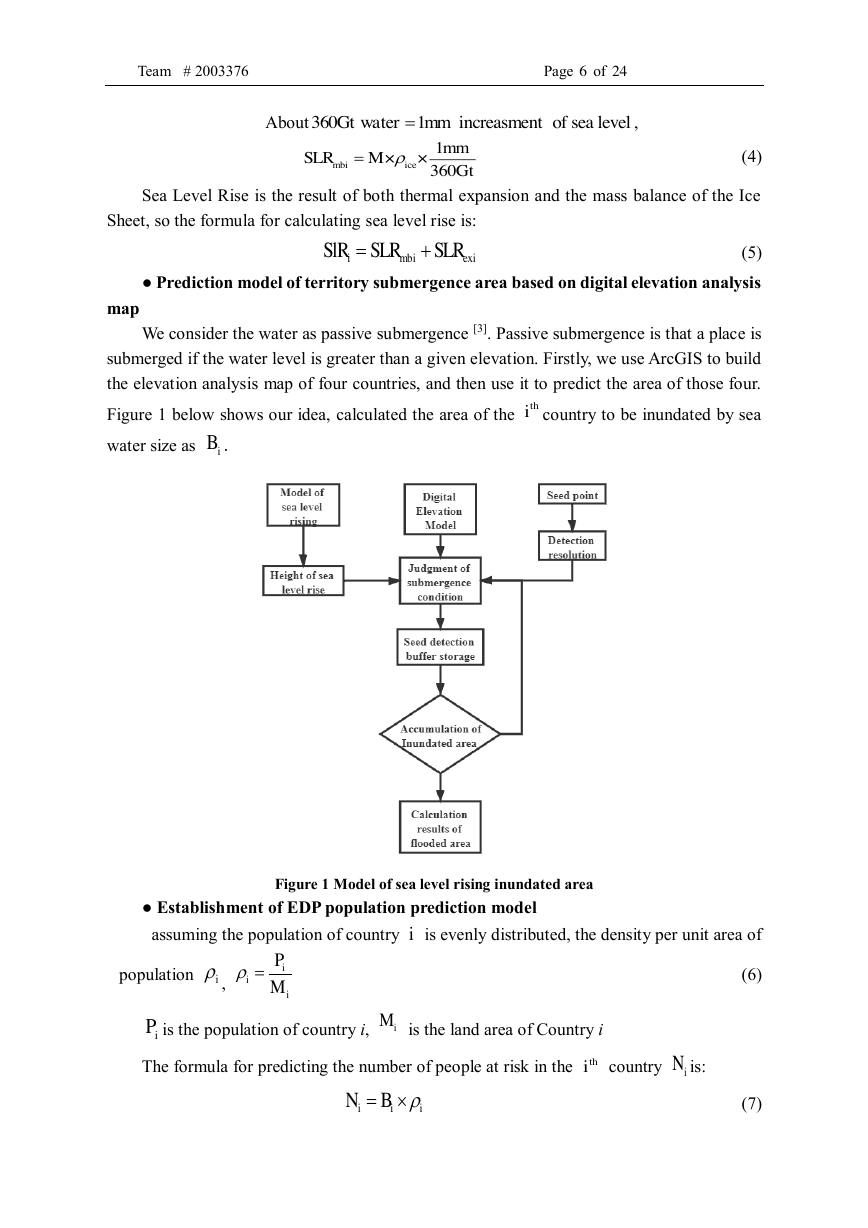
We consider the water as passive submergence [3]. Passive submergence is that a place is
submerged if the water level is greater than a given elevation. Firstly, we use ArcGIS to build
the elevation analysis map of four countries, and then use it to predict the area of those four.
Figure 1 below shows our idea, calculated the area of the
country to be inundated by sea
water size as
.
Figure 1 Model of sea level rising inundated area
● Establishment of EDP population prediction model
assuming the population of country
is evenly distributed, the density per unit area of
population
,
is the population of country i,
is the land area of Country i
The formula for predicting the number of people at risk in the
country
is:
(6)
(7)
360 1increasmentof sea levelGtwatermm= 1××360mbiicemmSLRMGt=imbiexiSlRSLRSLR=+ithiBiii=iiPMiPiMthiiNiiiNB=�
Team # 2003376 Page 7 of 24
is the area of
country that was submerged by the sea.
3.1.3 EDP Population Prediction Model and its Results and Analysis
● The prediction and calculation of sea level rise and its results
Based on the sea level rise model, predicted value of the World Meteorological
Organization were used as the projected temperatures of the four regions. Then, we can get sea
level rise results for the four countries over the next 60 years calculated by a program executed
by Matlab. These results show in table 4 and 5 below:
Table 4. Sea level rise prediction near Tuvalu, Kiribati, Marshall Islands
year
Temperature(℃)
Sea level rise (cm )
2020
21.48
—
2030
2040
21.9
7.88
22.71
15.91
2050
23.87
2060
25.1
24.8
33.74
2070
26.57
42.81
2080
28.13
52.27
Table 5. Sea level rise prediction near Maldives
Year
2020
2030
2040
Temperature(℃)
27.63
28.07
0.9
2050
30.2
2060
31.53
Sea level rise (cm )
—
8.42
16.99
26.03
35.6
2070
33.15
45.27
2080
34.85
57.64
● The prediction and calculation of the submerged area of the territory and its
results
Since most of the four countries are island countries rounded by sea water, their elevation
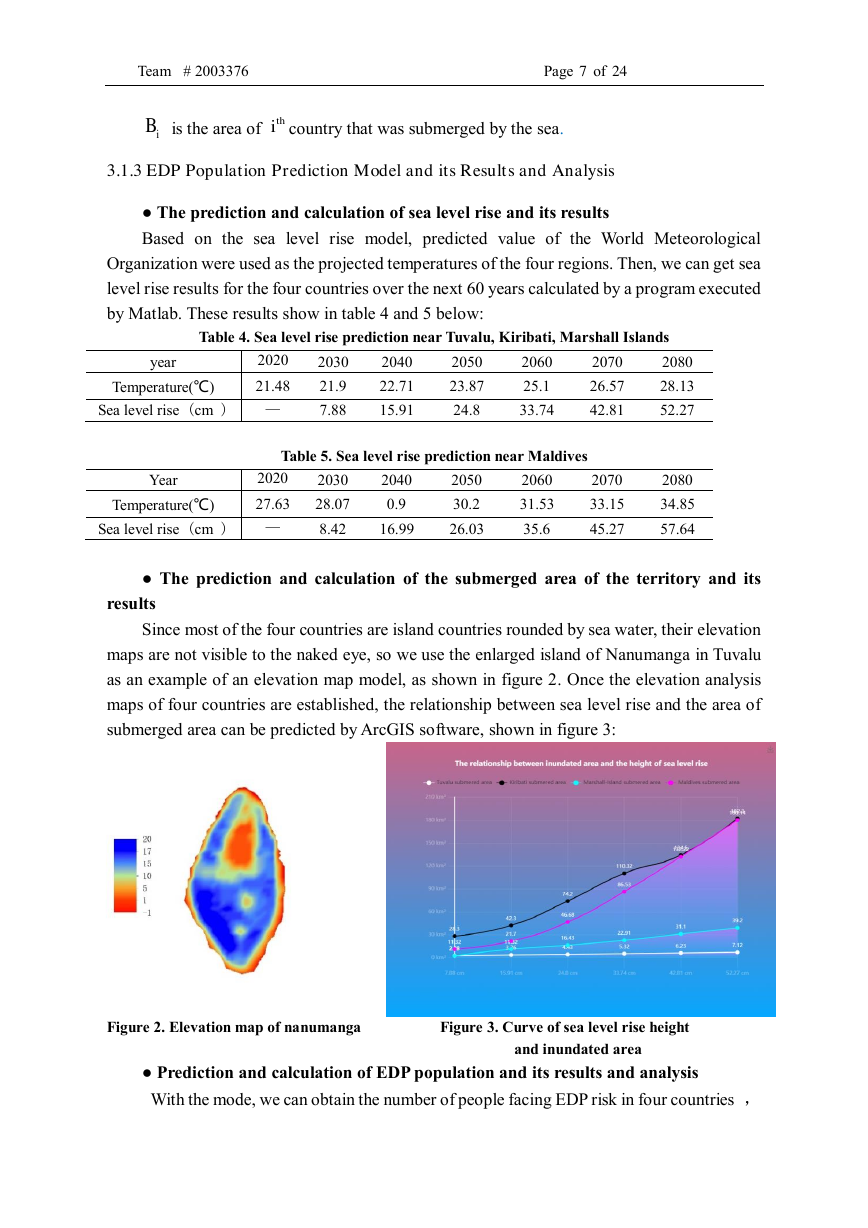
maps are not visible to the naked eye, so we use the enlarged island of Nanumanga in Tuvalu
as an example of an elevation map model, as shown in figure 2. Once the elevation analysis
maps of four countries are established, the relationship between sea level rise and the area of
submerged area can be predicted by ArcGIS software, shown in figure 3:
Figure 2. Elevation map of nanumanga Figure 3. Curve of sea level rise height
● Prediction and calculation of EDP population and its results and analysis
With the mode, we can obtain the number of people facing EDP risk in four countries ,
and inundated area
iBith�
Team # 2003376 Page 8 of 24
as an example, which are shown in table 6, attachment table 1-3 and figure 4:
Table 6 The number of people at risk in Tuvalu over the next 60 years
Year
Sea level rise (cm )
Submerged area( km² )
The number of EDP
2030
7.88
2.88
2000
2040
15.91
3.76
4611
2050
24.8
4.43
7688
2060
33.74
5.32
10837
2070
42.81
6.23
10837
2080
52.27
7.12
10837
Figure 4 Number of EDPS at risk in the next 60 years
As can be seen from figure 4, the population of EDP in the four countries will increase
year by year in the next 60 years, and all the people in the Marshall and Tuvalu Countries will
become environmental refugees in the next 60 years. According to the forecast, the island
government should make the corresponding relocation planning, and formulate corresponding
measures to protect EDP.
3.2 Task1-B Evaluation model of EDP culture loss risk
3.2.1 Modeling ideas
Consulting the literature, we can find out the cultural composition and the value of the
four island countries, confirm the influencing factors of the risk of cultural loss caused by the
relocation of climate refugees. Determining the weight of the factors contributing to the risk
of cultural loss by the analytic hierarchy process (AHP) we can put forward the formula to
calculate the risk degree of cultural loss.
3.2.2 Identification and assessment of cultural loss risk
● a model for identifying the risk of cultural loss
From the point of view of its path, the risk of cultural loss is characterized by objectivity,
complexity, dual-effect and controllability. Objectivity is due to climate change, such as sea
level rise, which makes the islanders climate refugees, and some of their culture will be lost in
whole or in part. Complexity refers to the diversity and dynamic development of cultural loss
risk. Dual-effect refers to both cultural differences and cultural complementarities.
�



 2023年江西萍乡中考道德与法治真题及答案.doc
 2012年重庆南川中考生物真题及答案.doc
 2013年江西师范大学地理学综合及文艺理论基础考研真题.doc
 2020年四川甘孜小升初语文真题及答案I卷.doc
 2020年注册岩土工程师专业基础考试真题及答案.doc
 2023-2024学年福建省厦门市九年级上学期数学月考试题及答案.doc
 2021-2022学年辽宁省沈阳市大东区九年级上学期语文期末试题及答案.doc
 2022-2023学年北京东城区初三第一学期物理期末试卷及答案.doc
 2018上半年江西教师资格初中地理学科知识与教学能力真题及答案.doc
 2012年河北国家公务员申论考试真题及答案-省级.doc
 2020-2021学年江苏省扬州市江都区邵樊片九年级上学期数学第一次质量检测试题及答案.doc
 2022下半年黑龙江教师资格证中学综合素质真题及答案.doc