To the Shareholders of Berkshire Hathaway Inc.:
Our per-share book value increased 14.3% during 1993. Over
the last 29 years (that is, since present management took over)
book value has grown from $19 to $8,854, or at a rate of 23.3%
compounded annually.
During the year, Berkshire's net worth increased by $1.5
billion, a figure affected by two negative and two positive non-
operating items. For the sake of completeness, I'll explain them
here. If you aren't thrilled by accounting, however, feel free
to fast-forward through this discussion:
1. The first negative was produced by a change in
Generally Accepted Accounting Principles (GAAP)
having to do with the taxes we accrue against
unrealized appreciation in the securities we
carry at market value. The old rule said that
the tax rate used should be the one in effect
when the appreciation took place. Therefore,
at the end of 1992, we were using a rate of 34%
on the $6.4 billion of gains generated after
1986 and 28% on the $1.2 billion of gains
generated before that. The new rule stipulates
that the current tax rate should be applied to
all gains. The rate in the first quarter of
1993, when this rule went into effect, was 34%.
Applying that rate to our pre-1987 gains
reduced net worth by $70 million.
2. The second negative, related to the first, came
about because the corporate tax rate was raised
in the third quarter of 1993 to 35%. This
change required us to make an additional charge
of 1% against all of our unrealized gains, and
that charge penalized net worth by $75 million.
Oddly, GAAP required both this charge and the
one described above to be deducted from the
earnings we report, even though the unrealized
appreciation that gave rise to the charges was
never included in earnings, but rather was
credited directly to net worth.
3. Another 1993 change in GAAP affects the value
at which we carry the securities that we own.
In recent years, both the common stocks and
certain common-equivalent securities held by
our insurance companies have been valued at
market, whereas equities held by our non-
insurance subsidiaries or by the parent company
were carried at their aggregate cost or market,
whichever was lower. Now GAAP says that all
common stocks should be carried at market, a
rule we began following in the fourth quarter
of 1993. This change produced a gain in
Berkshire's reported net worth of about $172
million.
4. Finally, we issued some stock last year. In a
transaction described in last year's Annual
Report, we issued 3,944 shares in early
January, 1993 upon the conversion of $46
million convertible debentures that we had
B
E
R
K
S
H
I
R
E
H
A
T
H
A
W
A
Y
I
N
C
.
�
called for redemption. Additionally, we issued
25,203 shares when we acquired Dexter Shoe, a
purchase discussed later in this report. The
overall result was that our shares outstanding
increased by 29,147 and our net worth by about
$478 million. Per-share book value also grew,
because the shares issued in these transactions
carried a price above their book value.
Of course, it's per-share intrinsic value, not book value,
that counts. Book value is an accounting term that measures the
capital, including retained earnings, that has been put into a
business. Intrinsic value is a present-value estimate of the
cash that can be taken out of a business during its remaining
life. At most companies, the two values are unrelated.
Berkshire, however, is an exception: Our book value, though
significantly below our intrinsic value, serves as a useful
device for tracking that key figure. In 1993, each measure grew
by roughly 14%, advances that I would call satisfactory but
unexciting.
These gains, however, were outstripped by a much larger gain
- 39% - in Berkshire's market price. Over time, of course,
market price and intrinsic value will arrive at about the same
destination. But in the short run the two often diverge in a
major way, a phenomenon I've discussed in the past. Two years
ago, Coca-Cola and Gillette, both large holdings of ours, enjoyed
market price increases that dramatically outpaced their earnings
gains. In the 1991 Annual Report, I said that the stocks of
these companies could not continuously overperform their
businesses.
From 1991 to 1993, Coke and Gillette increased their annual
operating earnings per share by 38% and 37% respectively, but
their market prices moved up only 11% and 6%. In other words,
the companies overperformed their stocks, a result that no doubt
partly reflects Wall Street's new apprehension about brand names.
Whatever the reason, what will count over time is the earnings
performance of these companies. If they prosper, Berkshire will
also prosper, though not in a lock-step manner.
Let me add a lesson from history: Coke went public in 1919
at $40 per share. By the end of 1920 the market, coldly
reevaluating Coke's future prospects, had battered the stock down
by more than 50%, to $19.50. At yearend 1993, that single share,
with dividends reinvested, was worth more than $2.1 million. As
Ben Graham said: "In the short-run, the market is a voting
machine - reflecting a voter-registration test that requires only
money, not intelligence or emotional stability - but in the long-
run, the market is a weighing machine."
So how should Berkshire's over-performance in the market
last year be viewed? Clearly, Berkshire was selling at a higher
percentage of intrinsic value at the end of 1993 than was the
case at the beginning of the year. On the other hand, in a world
of 6% or 7% long-term interest rates, Berkshire's market price
was not inappropriate if - and you should understand that this is
a huge if - Charlie Munger, Berkshire's Vice Chairman, and I can
attain our long-standing goal of increasing Berkshire's per-share
intrinsic value at an average annual rate of 15%. We have not
retreated from this goal. But we again emphasize, as we have for
many years, that the growth in our capital base makes 15% an
ever-more difficult target to hit.
What we have going for us is a growing collection of good-
sized operating businesses that possess economic characteristics
ranging from good to terrific, run by managers whose performance
ranges from terrific to terrific. You need have no worries about
this group.
�
The capital-allocation work that Charlie and I do at the
parent company, using the funds that our managers deliver to us,
has a less certain outcome: It is not easy to find new
businesses and managers comparable to those we have. Despite
that difficulty, Charlie and I relish the search, and we are
happy to report an important success in 1993.
Dexter Shoe
What we did last year was build on our 1991 purchase of H.
H. Brown, a superbly-run manufacturer of work shoes, boots and
other footwear. Brown has been a real winner: Though we had
high hopes to begin with, these expectations have been
considerably exceeded thanks to Frank Rooney, Jim Issler and the
talented managers who work with them. Because of our confidence
in Frank's team, we next acquired Lowell Shoe, at the end of
1992. Lowell was a long-established manufacturer of women's and
nurses' shoes, but its business needed some fixing. Again,
results have surpassed our expectations. So we promptly jumped
at the chance last year to acquire Dexter Shoe of Dexter, Maine,
which manufactures popular-priced men's and women's shoes.
Dexter, I can assure you, needs no fixing: It is one of the
best-managed companies Charlie and I have seen in our business
lifetimes.
Harold Alfond, who started working in a shoe factory at 25
cents an hour when he was 20, founded Dexter in 1956 with $10,000
of capital. He was joined in 1958 by Peter Lunder, his nephew.
The two of them have since built a business that now produces over
7.5 million pairs of shoes annually, most of them made in Maine
and the balance in Puerto Rico. As you probably know, the
domestic shoe industry is generally thought to be unable to
compete with imports from low-wage countries. But someone forgot
to tell this to the ingenious managements of Dexter and H. H.
Brown and to their skilled labor forces, which together make the
U.S. plants of both companies highly competitive against all
comers.
Dexter's business includes 77 retail outlets, located
primarily in the Northeast. The company is also a major
manufacturer of golf shoes, producing about 15% of U.S. output.
Its bread and butter, though, is the manufacture of traditional
shoes for traditional retailers, a job at which it excels: Last
year both Nordstrom and J.C. Penney bestowed special awards upon
Dexter for its performance as a supplier during 1992.
Our 1993 results include Dexter only from our date of
merger, November 7th. In 1994, we expect Berkshire's shoe
operations to have more than $550 million in sales, and we would
not be surprised if the combined pre-tax earnings of these
businesses topped $85 million. Five years ago we had no thought
of getting into shoes. Now we have 7,200 employees in that
industry, and I sing "There's No Business Like Shoe Business" as
I drive to work. So much for strategic plans.
At Berkshire, we have no view of the future that dictates
what businesses or industries we will enter. Indeed, we think
it's usually poison for a corporate giant's shareholders if it
embarks upon new ventures pursuant to some grand vision. We
prefer instead to focus on the economic characteristics of
businesses that we wish to own and the personal characteristics
of managers with whom we wish to associate - and then to hope we
get lucky in finding the two in combination. At Dexter, we did.
* * * * * * * * * * * *
And now we pause for a short commercial: Though they owned
a business jewel, we believe that Harold and Peter (who were not
�
interested in cash) made a sound decision in exchanging their
Dexter stock for shares of Berkshire. What they did, in effect,
was trade a 100% interest in a single terrific business for a
smaller interest in a large group of terrific businesses. They
incurred no tax on this exchange and now own a security that can
be easily used for charitable or personal gifts, or that can be
converted to cash in amounts, and at times, of their own
choosing. Should members of their families desire to, they can
pursue varying financial paths without running into the
complications that often arise when assets are concentrated in a
private business.
For tax and other reasons, private companies also often find
it difficult to diversify outside their industries. Berkshire,
in contrast, can diversify with ease. So in shifting their
ownership to Berkshire, Dexter's shareholders solved a
reinvestment problem. Moreover, though Harold and Peter now have
non-controlling shares in Berkshire, rather than controlling
shares in Dexter, they know they will be treated as partners and
that we will follow owner-oriented practices. If they elect to
retain their Berkshire shares, their investment result from the
merger date forward will exactly parallel my own result. Since I
have a huge percentage of my net worth committed for life to
Berkshire shares - and since the company will issue me neither
restricted shares nor stock options - my gain-loss equation will
always match that of all other owners.
Additionally, Harold and Peter know that at Berkshire we can
keep our promises: There will be no changes of control or
culture at Berkshire for many decades to come. Finally, and of
paramount importance, Harold and Peter can be sure that they will
get to run their business - an activity they dearly love -
exactly as they did before the merger. At Berkshire, we do not
tell .400 hitters how to swing.
What made sense for Harold and Peter probably makes sense
for a few other owners of large private businesses. So, if you
have a business that might fit, let me hear from you. Our
acquisition criteria are set forth in the appendix on page 22.
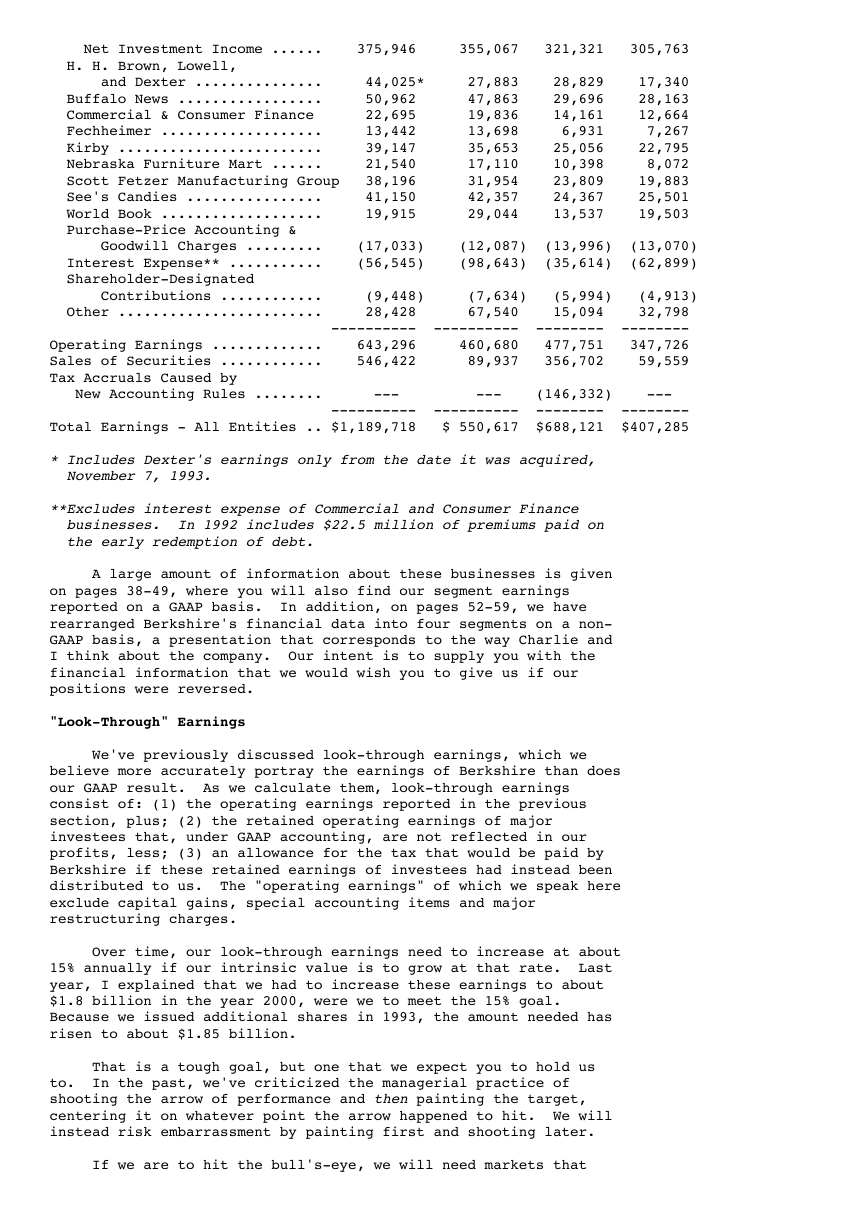
Sources of Reported Earnings
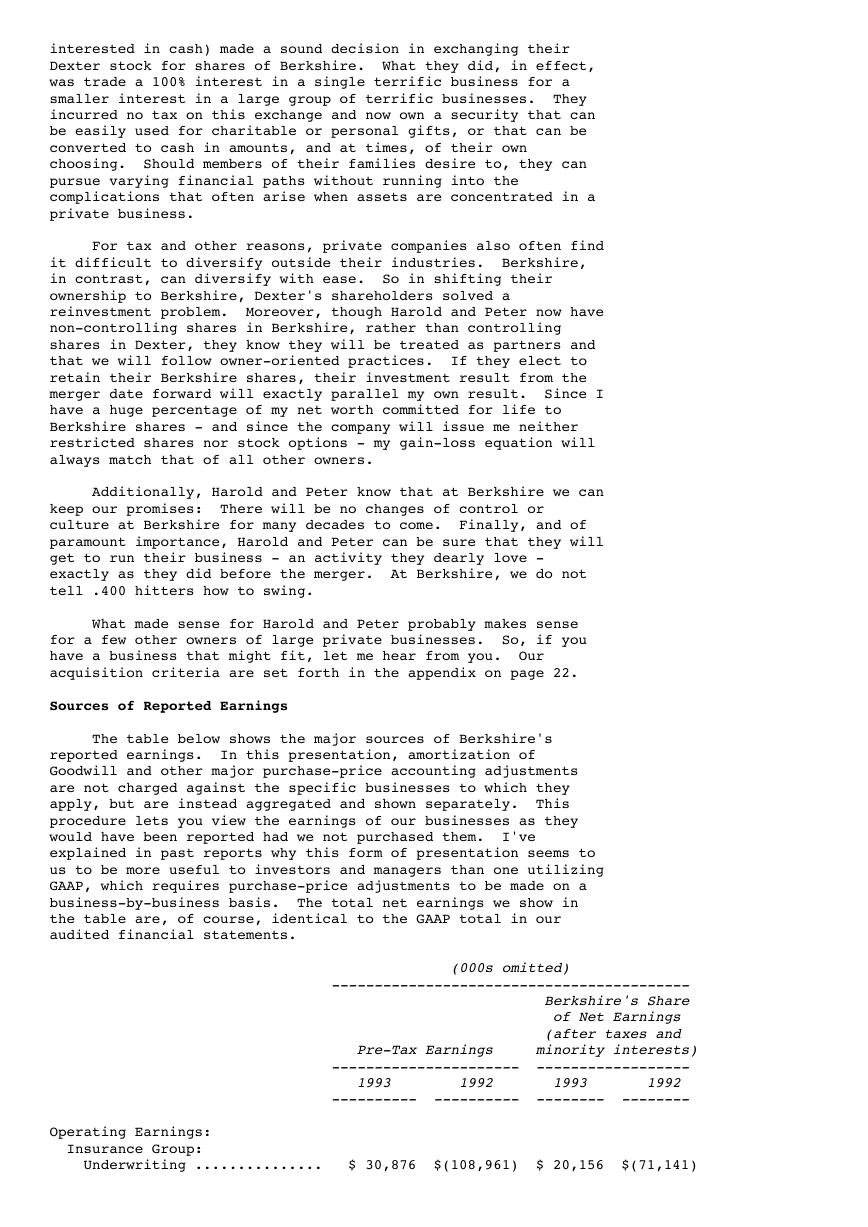
The table below shows the major sources of Berkshire's
reported earnings. In this presentation, amortization of
Goodwill and other major purchase-price accounting adjustments
are not charged against the specific businesses to which they
apply, but are instead aggregated and shown separately. This
procedure lets you view the earnings of our businesses as they
would have been reported had we not purchased them. I've
explained in past reports why this form of presentation seems to
us to be more useful to investors and managers than one utilizing
GAAP, which requires purchase-price adjustments to be made on a
business-by-business basis. The total net earnings we show in
the table are, of course, identical to the GAAP total in our
audited financial statements.
(000s omitted)
------------------------------------------
Berkshire's Share
of Net Earnings
(after taxes and
Pre-Tax Earnings minority interests)
---------------------- ------------------
1993 1992 1993 1992
---------- ---------- -------- --------
Operating Earnings:
Insurance Group:
Underwriting ............... $ 30,876 $(108,961) $ 20,156 $(71,141)
�
Net Investment Income ...... 375,946 355,067 321,321 305,763
H. H. Brown, Lowell,
and Dexter ............... 44,025* 27,883 28,829 17,340
Buffalo News ................. 50,962 47,863 29,696 28,163
Commercial & Consumer Finance 22,695 19,836 14,161 12,664
Fechheimer ................... 13,442 13,698 6,931 7,267
Kirby ........................ 39,147 35,653 25,056 22,795
Nebraska Furniture Mart ...... 21,540 17,110 10,398 8,072
Scott Fetzer Manufacturing Group 38,196 31,954 23,809 19,883
See's Candies ................ 41,150 42,357 24,367 25,501
World Book ................... 19,915 29,044 13,537 19,503
Purchase-Price Accounting &
Goodwill Charges ......... (17,033) (12,087) (13,996) (13,070)
Interest Expense** ........... (56,545) (98,643) (35,614) (62,899)
Shareholder-Designated
Contributions ............ (9,448) (7,634) (5,994) (4,913)
Other ........................ 28,428 67,540 15,094 32,798
---------- ---------- -------- --------
Operating Earnings ............. 643,296 460,680 477,751 347,726
Sales of Securities ............ 546,422 89,937 356,702 59,559
Tax Accruals Caused by
New Accounting Rules ........ --- --- (146,332) ---
---------- ---------- -------- --------
Total Earnings - All Entities .. $1,189,718 $ 550,617 $688,121 $407,285
* Includes Dexter's earnings only from the date it was acquired,
November 7, 1993.
**Excludes interest expense of Commercial and Consumer Finance
businesses. In 1992 includes $22.5 million of premiums paid on
the early redemption of debt.
A large amount of information about these businesses is given
on pages 38-49, where you will also find our segment earnings
reported on a GAAP basis. In addition, on pages 52-59, we have
rearranged Berkshire's financial data into four segments on a non-
GAAP basis, a presentation that corresponds to the way Charlie and
I think about the company. Our intent is to supply you with the
financial information that we would wish you to give us if our
positions were reversed.
"Look-Through" Earnings
We've previously discussed look-through earnings, which we
believe more accurately portray the earnings of Berkshire than does
our GAAP result. As we calculate them, look-through earnings
consist of: (1) the operating earnings reported in the previous
section, plus; (2) the retained operating earnings of major
investees that, under GAAP accounting, are not reflected in our
profits, less; (3) an allowance for the tax that would be paid by
Berkshire if these retained earnings of investees had instead been
distributed to us. The "operating earnings" of which we speak here
exclude capital gains, special accounting items and major
restructuring charges.
Over time, our look-through earnings need to increase at about
15% annually if our intrinsic value is to grow at that rate. Last
year, I explained that we had to increase these earnings to about
$1.8 billion in the year 2000, were we to meet the 15% goal.
Because we issued additional shares in 1993, the amount needed has
risen to about $1.85 billion.
That is a tough goal, but one that we expect you to hold us
to. In the past, we've criticized the managerial practice of
shooting the arrow of performance and then painting the target,
centering it on whatever point the arrow happened to hit. We will
instead risk embarrassment by painting first and shooting later.
If we are to hit the bull's-eye, we will need markets that
�
allow the purchase of businesses and securities on sensible terms.
Right now, markets are difficult, but they can - and will - change
in unexpected ways and at unexpected times. In the meantime, we'll
try to resist the temptation to do something marginal simply
because we are long on cash. There's no use running if you're on
the wrong road.
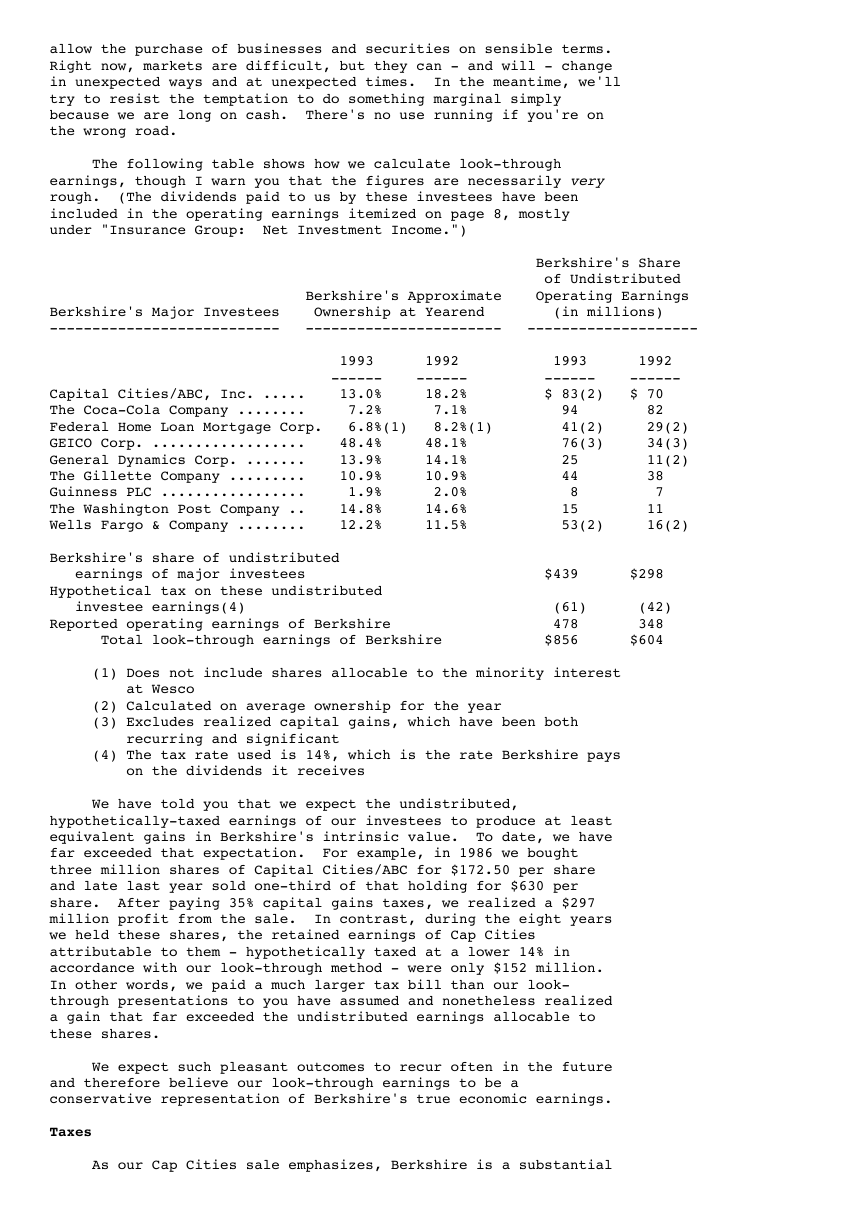
The following table shows how we calculate look-through
earnings, though I warn you that the figures are necessarily very
rough. (The dividends paid to us by these investees have been
included in the operating earnings itemized on page 8, mostly
under "Insurance Group: Net Investment Income.")
Berkshire's Share
of Undistributed
Berkshire's Approximate Operating Earnings
Berkshire's Major Investees Ownership at Yearend (in millions)
--------------------------- ----------------------- --------------------
1993 1992 1993 1992
------ ------ ------ ------
Capital Cities/ABC, Inc. ..... 13.0% 18.2% $ 83(2) $ 70
The Coca-Cola Company ........ 7.2% 7.1% 94 82
Federal Home Loan Mortgage Corp. 6.8%(1) 8.2%(1) 41(2) 29(2)
GEICO Corp. .................. 48.4% 48.1% 76(3) 34(3)
General Dynamics Corp. ....... 13.9% 14.1% 25 11(2)
The Gillette Company ......... 10.9% 10.9% 44 38
Guinness PLC ................. 1.9% 2.0% 8 7
The Washington Post Company .. 14.8% 14.6% 15 11
Wells Fargo & Company ........ 12.2% 11.5% 53(2) 16(2)
Berkshire's share of undistributed
earnings of major investees $439 $298
Hypothetical tax on these undistributed
investee earnings(4) (61) (42)
Reported operating earnings of Berkshire 478 348
Total look-through earnings of Berkshire $856 $604
(1) Does not include shares allocable to the minority interest
at Wesco
(2) Calculated on average ownership for the year
(3) Excludes realized capital gains, which have been both
recurring and significant
(4) The tax rate used is 14%, which is the rate Berkshire pays
on the dividends it receives
We have told you that we expect the undistributed,
hypothetically-taxed earnings of our investees to produce at least
equivalent gains in Berkshire's intrinsic value. To date, we have
far exceeded that expectation. For example, in 1986 we bought
three million shares of Capital Cities/ABC for $172.50 per share
and late last year sold one-third of that holding for $630 per
share. After paying 35% capital gains taxes, we realized a $297
million profit from the sale. In contrast, during the eight years
we held these shares, the retained earnings of Cap Cities
attributable to them - hypothetically taxed at a lower 14% in
accordance with our look-through method - were only $152 million.
In other words, we paid a much larger tax bill than our look-
through presentations to you have assumed and nonetheless realized
a gain that far exceeded the undistributed earnings allocable to
these shares.
We expect such pleasant outcomes to recur often in the future
and therefore believe our look-through earnings to be a
conservative representation of Berkshire's true economic earnings.
Taxes
As our Cap Cities sale emphasizes, Berkshire is a substantial
�
payer of federal income taxes. In aggregate, we will pay 1993
federal income taxes of $390 million, about $200 million of that
attributable to operating earnings and $190 million to realized
capital gains. Furthermore, our share of the 1993 federal and
foreign income taxes paid by our investees is well over $400
million, a figure you don't see on our financial statements but
that is nonetheless real. Directly and indirectly, Berkshire's
1993 federal income tax payments will be about 1/2 of 1% of the total
paid last year by all American corporations.
Speaking for our own shares, Charlie and I have absolutely no
complaint about these taxes. We know we work in a market-based
economy that rewards our efforts far more bountifully than it does
the efforts of others whose output is of equal or greater benefit
to society. Taxation should, and does, partially redress this
inequity. But we still remain extraordinarily well-treated.
Berkshire and its shareholders, in combination, would pay a
much smaller tax if Berkshire operated as a partnership or "S"
corporation, two structures often used for business activities.
For a variety of reasons, that's not feasible for Berkshire to do.
However, the penalty our corporate form imposes is mitigated -
though far from eliminated - by our strategy of investing for the
long term. Charlie and I would follow a buy-and-hold policy even
if we ran a tax-exempt institution. We think it the soundest way
to invest, and it also goes down the grain of our personalities. A
third reason to favor this policy, however, is the fact that taxes
are due only when gains are realized.
Through my favorite comic strip, Li'l Abner, I got a chance
during my youth to see the benefits of delayed taxes, though I
missed the lesson at the time. Making his readers feel superior,
Li'l Abner bungled happily, but moronically, through life in
Dogpatch. At one point he became infatuated with a New York
temptress, Appassionatta Van Climax, but despaired of marrying her
because he had only a single silver dollar and she was interested
solely in millionaires. Dejected, Abner took his problem to Old
Man Mose, the font of all knowledge in Dogpatch. Said the sage:
Double your money 20 times and Appassionatta will be yours (1, 2,
4, 8 . . . . 1,048,576).
My last memory of the strip is Abner entering a roadhouse,
dropping his dollar into a slot machine, and hitting a jackpot that
spilled money all over the floor. Meticulously following Mose's
advice, Abner picked up two dollars and went off to find his next
double. Whereupon I dumped Abner and began reading Ben Graham.
Mose clearly was overrated as a guru: Besides failing to
anticipate Abner's slavish obedience to instructions, he also
forgot about taxes. Had Abner been subject, say, to the 35%
federal tax rate that Berkshire pays, and had he managed one double
annually, he would after 20 years only have accumulated $22,370.
Indeed, had he kept on both getting his annual doubles and paying a
35% tax on each, he would have needed 7 1/2 years more to reach the
$1 million required to win Appassionatta.
But what if Abner had instead put his dollar in a single
investment and held it until it doubled the same 27 1/2 times? In
that case, he would have realized about $200 million pre-tax or,
after paying a $70 million tax in the final year, about $130
million after-tax. For that, Appassionatta would have crawled to
Dogpatch. Of course, with 27 1/2 years having passed, how
Appassionatta would have looked to a fellow sitting on $130 million
is another question.
What this little tale tells us is that tax-paying investors
will realize a far, far greater sum from a single investment that
compounds internally at a given rate than from a succession of
investments compounding at the same rate. But I suspect many
�
Berkshire shareholders figured that out long ago.
Insurance Operations
At this point in the report we've customarily provided you
with a table showing the annual "combined ratio" of the insurance
industry for the preceding decade. This ratio compares total
insurance costs (losses incurred plus expenses) to revenue from
premiums. For many years, the ratio has been above 100, a level
indicating an underwriting loss. That is, the industry has taken
in less money each year from its policyholders than it has had to
pay for operating expenses and for loss events that occurred during
the year.
Offsetting this grim equation is a happier fact: Insurers get
to hold on to their policyholders' money for a time before paying
it out. This happens because most policies require that premiums
be prepaid and, more importantly, because it often takes time to
resolve loss claims. Indeed, in the case of certain lines of
insurance, such as product liability or professional malpractice,
many years may elapse between the loss event and payment.
To oversimplify the matter somewhat, the total of the funds
prepaid by policyholders and the funds earmarked for incurred-but-
not-yet-paid claims is called "the float." In the past, the
industry was able to suffer a combined ratio of 107 to 111 and
still break even from its insurance writings because of the
earnings derived from investing this float.
As interest rates have fallen, however, the value of float has
substantially declined. Therefore, the data that we have provided
in the past are no longer useful for year-to-year comparisons of
industry profitability. A company writing at the same combined
ratio now as in the 1980's today has a far less attractive business
than it did then.
Only by making an analysis that incorporates both underwriting
results and the current risk-free earnings obtainable from float
can one evaluate the true economics of the business that a
property-casualty insurer writes. Of course, the actual investment
results that an insurer achieves from the use of both float and
stockholders' funds is also of major importance and should be
carefully examined when an investor is assessing managerial
performance. But that should be a separate analysis from the one
we are discussing here. The value of float funds - in effect,
their transfer price as they move from the insurance operation to
the investment operation - should be determined simply by the risk-
free, long-term rate of interest.
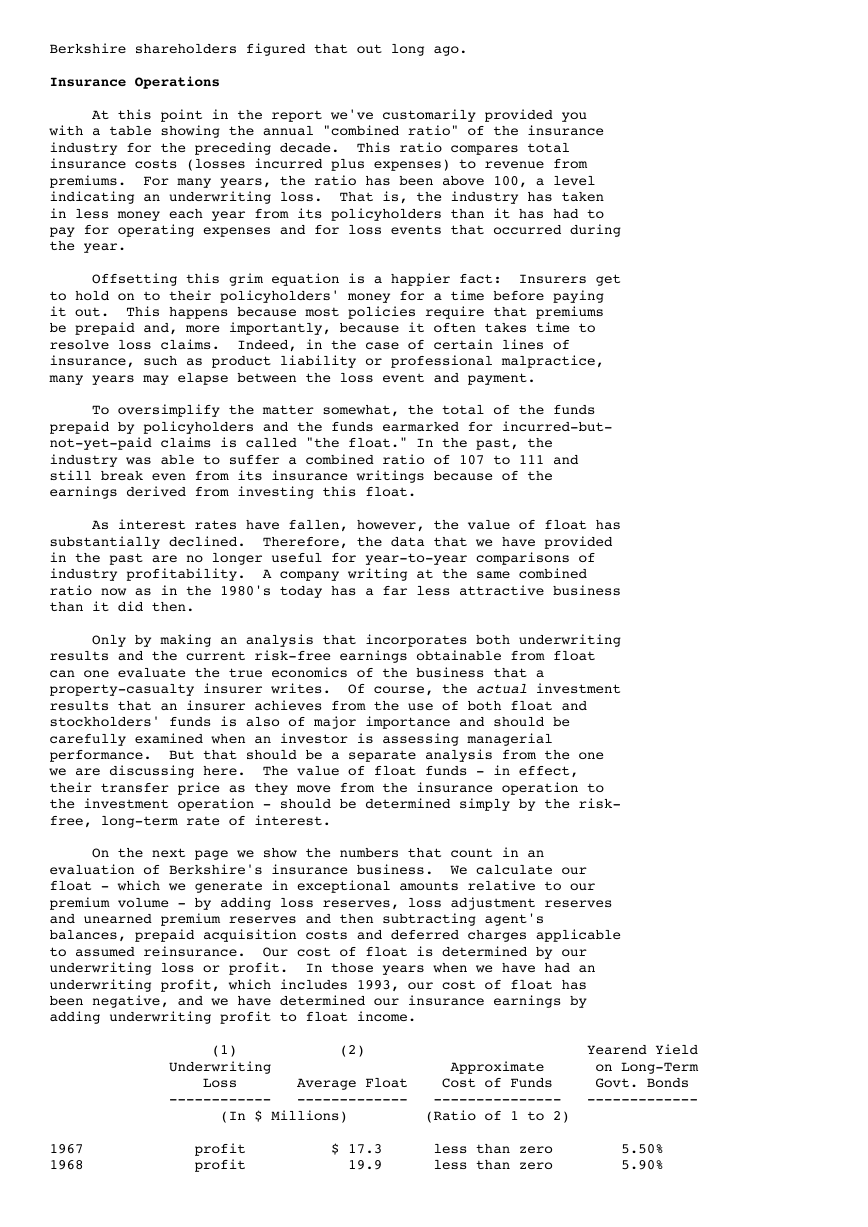
On the next page we show the numbers that count in an
evaluation of Berkshire's insurance business. We calculate our
float - which we generate in exceptional amounts relative to our
premium volume - by adding loss reserves, loss adjustment reserves
and unearned premium reserves and then subtracting agent's
balances, prepaid acquisition costs and deferred charges applicable
to assumed reinsurance. Our cost of float is determined by our
underwriting loss or profit. In those years when we have had an
underwriting profit, which includes 1993, our cost of float has
been negative, and we have determined our insurance earnings by
adding underwriting profit to float income.
(1) (2) Yearend Yield
Underwriting Approximate on Long-Term
Loss Average Float Cost of Funds Govt. Bonds
------------ ------------- --------------- -------------
(In $ Millions) (Ratio of 1 to 2)
1967 profit $ 17.3 less than zero 5.50%
1968 profit 19.9 less than zero 5.90%
�
