Berkshire’s Performance vs. the S&P 500
Annual Percentage Change
Year
1965 . . . . . . . . . . . . . . . . . . . . . . . . . . . . . . . . . . . . . . . . . . . . . . . . . . . . . . . . . . . . . . . . . . . . . . . . .
1966 . . . . . . . . . . . . . . . . . . . . . . . . . . . . . . . . . . . . . . . . . . . . . . . . . . . . . . . . . . . . . . . . . . . . . . . . .
1967 . . . . . . . . . . . . . . . . . . . . . . . . . . . . . . . . . . . . . . . . . . . . . . . . . . . . . . . . . . . . . . . . . . . . . . . . .
1968 . . . . . . . . . . . . . . . . . . . . . . . . . . . . . . . . . . . . . . . . . . . . . . . . . . . . . . . . . . . . . . . . . . . . . . . . .
1969 . . . . . . . . . . . . . . . . . . . . . . . . . . . . . . . . . . . . . . . . . . . . . . . . . . . . . . . . . . . . . . . . . . . . . . . . .
1970 . . . . . . . . . . . . . . . . . . . . . . . . . . . . . . . . . . . . . . . . . . . . . . . . . . . . . . . . . . . . . . . . . . . . . . . . .
1971 . . . . . . . . . . . . . . . . . . . . . . . . . . . . . . . . . . . . . . . . . . . . . . . . . . . . . . . . . . . . . . . . . . . . . . . . .
1972 . . . . . . . . . . . . . . . . . . . . . . . . . . . . . . . . . . . . . . . . . . . . . . . . . . . . . . . . . . . . . . . . . . . . . . . . .
1973 . . . . . . . . . . . . . . . . . . . . . . . . . . . . . . . . . . . . . . . . . . . . . . . . . . . . . . . . . . . . . . . . . . . . . . . . .
1974 . . . . . . . . . . . . . . . . . . . . . . . . . . . . . . . . . . . . . . . . . . . . . . . . . . . . . . . . . . . . . . . . . . . . . . . . .
1975 . . . . . . . . . . . . . . . . . . . . . . . . . . . . . . . . . . . . . . . . . . . . . . . . . . . . . . . . . . . . . . . . . . . . . . . . .
1976 . . . . . . . . . . . . . . . . . . . . . . . . . . . . . . . . . . . . . . . . . . . . . . . . . . . . . . . . . . . . . . . . . . . . . . . . .
1977 . . . . . . . . . . . . . . . . . . . . . . . . . . . . . . . . . . . . . . . . . . . . . . . . . . . . . . . . . . . . . . . . . . . . . . . . .
1978 . . . . . . . . . . . . . . . . . . . . . . . . . . . . . . . . . . . . . . . . . . . . . . . . . . . . . . . . . . . . . . . . . . . . . . . . .
1979 . . . . . . . . . . . . . . . . . . . . . . . . . . . . . . . . . . . . . . . . . . . . . . . . . . . . . . . . . . . . . . . . . . . . . . . . .
1980 . . . . . . . . . . . . . . . . . . . . . . . . . . . . . . . . . . . . . . . . . . . . . . . . . . . . . . . . . . . . . . . . . . . . . . . . .
1981 . . . . . . . . . . . . . . . . . . . . . . . . . . . . . . . . . . . . . . . . . . . . . . . . . . . . . . . . . . . . . . . . . . . . . . . . .
1982 . . . . . . . . . . . . . . . . . . . . . . . . . . . . . . . . . . . . . . . . . . . . . . . . . . . . . . . . . . . . . . . . . . . . . . . . .
1983 . . . . . . . . . . . . . . . . . . . . . . . . . . . . . . . . . . . . . . . . . . . . . . . . . . . . . . . . . . . . . . . . . . . . . . . . .
1984 . . . . . . . . . . . . . . . . . . . . . . . . . . . . . . . . . . . . . . . . . . . . . . . . . . . . . . . . . . . . . . . . . . . . . . . . .
1985 . . . . . . . . . . . . . . . . . . . . . . . . . . . . . . . . . . . . . . . . . . . . . . . . . . . . . . . . . . . . . . . . . . . . . . . . .
1986 . . . . . . . . . . . . . . . . . . . . . . . . . . . . . . . . . . . . . . . . . . . . . . . . . . . . . . . . . . . . . . . . . . . . . . . . .
1987 . . . . . . . . . . . . . . . . . . . . . . . . . . . . . . . . . . . . . . . . . . . . . . . . . . . . . . . . . . . . . . . . . . . . . . . . .
1988 . . . . . . . . . . . . . . . . . . . . . . . . . . . . . . . . . . . . . . . . . . . . . . . . . . . . . . . . . . . . . . . . . . . . . . . . .
1989 . . . . . . . . . . . . . . . . . . . . . . . . . . . . . . . . . . . . . . . . . . . . . . . . . . . . . . . . . . . . . . . . . . . . . . . . .
1990 . . . . . . . . . . . . . . . . . . . . . . . . . . . . . . . . . . . . . . . . . . . . . . . . . . . . . . . . . . . . . . . . . . . . . . . . .
1991 . . . . . . . . . . . . . . . . . . . . . . . . . . . . . . . . . . . . . . . . . . . . . . . . . . . . . . . . . . . . . . . . . . . . . . . . .
1992 . . . . . . . . . . . . . . . . . . . . . . . . . . . . . . . . . . . . . . . . . . . . . . . . . . . . . . . . . . . . . . . . . . . . . . . . .
1993 . . . . . . . . . . . . . . . . . . . . . . . . . . . . . . . . . . . . . . . . . . . . . . . . . . . . . . . . . . . . . . . . . . . . . . . . .
1994 . . . . . . . . . . . . . . . . . . . . . . . . . . . . . . . . . . . . . . . . . . . . . . . . . . . . . . . . . . . . . . . . . . . . . . . . .
1995 . . . . . . . . . . . . . . . . . . . . . . . . . . . . . . . . . . . . . . . . . . . . . . . . . . . . . . . . . . . . . . . . . . . . . . . . .
1996 . . . . . . . . . . . . . . . . . . . . . . . . . . . . . . . . . . . . . . . . . . . . . . . . . . . . . . . . . . . . . . . . . . . . . . . . .
1997 . . . . . . . . . . . . . . . . . . . . . . . . . . . . . . . . . . . . . . . . . . . . . . . . . . . . . . . . . . . . . . . . . . . . . . . . .
1998 . . . . . . . . . . . . . . . . . . . . . . . . . . . . . . . . . . . . . . . . . . . . . . . . . . . . . . . . . . . . . . . . . . . . . . . . .
1999 . . . . . . . . . . . . . . . . . . . . . . . . . . . . . . . . . . . . . . . . . . . . . . . . . . . . . . . . . . . . . . . . . . . . . . . . .
2000 . . . . . . . . . . . . . . . . . . . . . . . . . . . . . . . . . . . . . . . . . . . . . . . . . . . . . . . . . . . . . . . . . . . . . . . . .
2001 . . . . . . . . . . . . . . . . . . . . . . . . . . . . . . . . . . . . . . . . . . . . . . . . . . . . . . . . . . . . . . . . . . . . . . . . .
2002 . . . . . . . . . . . . . . . . . . . . . . . . . . . . . . . . . . . . . . . . . . . . . . . . . . . . . . . . . . . . . . . . . . . . . . . . .
2003 . . . . . . . . . . . . . . . . . . . . . . . . . . . . . . . . . . . . . . . . . . . . . . . . . . . . . . . . . . . . . . . . . . . . . . . . .
2004 . . . . . . . . . . . . . . . . . . . . . . . . . . . . . . . . . . . . . . . . . . . . . . . . . . . . . . . . . . . . . . . . . . . . . . . . .
2005 . . . . . . . . . . . . . . . . . . . . . . . . . . . . . . . . . . . . . . . . . . . . . . . . . . . . . . . . . . . . . . . . . . . . . . . . .
2006 . . . . . . . . . . . . . . . . . . . . . . . . . . . . . . . . . . . . . . . . . . . . . . . . . . . . . . . . . . . . . . . . . . . . . . . . .
2007 . . . . . . . . . . . . . . . . . . . . . . . . . . . . . . . . . . . . . . . . . . . . . . . . . . . . . . . . . . . . . . . . . . . . . . . . .
2008 . . . . . . . . . . . . . . . . . . . . . . . . . . . . . . . . . . . . . . . . . . . . . . . . . . . . . . . . . . . . . . . . . . . . . . . . .
2009 . . . . . . . . . . . . . . . . . . . . . . . . . . . . . . . . . . . . . . . . . . . . . . . . . . . . . . . . . . . . . . . . . . . . . . . . .
2010 . . . . . . . . . . . . . . . . . . . . . . . . . . . . . . . . . . . . . . . . . . . . . . . . . . . . . . . . . . . . . . . . . . . . . . . . .
2011 . . . . . . . . . . . . . . . . . . . . . . . . . . . . . . . . . . . . . . . . . . . . . . . . . . . . . . . . . . . . . . . . . . . . . . . . .
2012 . . . . . . . . . . . . . . . . . . . . . . . . . . . . . . . . . . . . . . . . . . . . . . . . . . . . . . . . . . . . . . . . . . . . . . . . .
2013 . . . . . . . . . . . . . . . . . . . . . . . . . . . . . . . . . . . . . . . . . . . . . . . . . . . . . . . . . . . . . . . . . . . . . . . . .
2014 . . . . . . . . . . . . . . . . . . . . . . . . . . . . . . . . . . . . . . . . . . . . . . . . . . . . . . . . . . . . . . . . . . . . . . . . .
2015 . . . . . . . . . . . . . . . . . . . . . . . . . . . . . . . . . . . . . . . . . . . . . . . . . . . . . . . . . . . . . . . . . . . . . . . . .
2016 . . . . . . . . . . . . . . . . . . . . . . . . . . . . . . . . . . . . . . . . . . . . . . . . . . . . . . . . . . . . . . . . . . . . . . . . .
2017 . . . . . . . . . . . . . . . . . . . . . . . . . . . . . . . . . . . . . . . . . . . . . . . . . . . . . . . . . . . . . . . . . . . . . . . . .
2018 . . . . . . . . . . . . . . . . . . . . . . . . . . . . . . . . . . . . . . . . . . . . . . . . . . . . . . . . . . . . . . . . . . . . . . . . .
2019 . . . . . . . . . . . . . . . . . . . . . . . . . . . . . . . . . . . . . . . . . . . . . . . . . . . . . . . . . . . . . . . . . . . . . . . . .
2020 . . . . . . . . . . . . . . . . . . . . . . . . . . . . . . . . . . . . . . . . . . . . . . . . . . . . . . . . . . . . . . . . . . . . . . . . .
2021 . . . . . . . . . . . . . . . . . . . . . . . . . . . . . . . . . . . . . . . . . . . . . . . . . . . . . . . . . . . . . . . . . . . . . . . . .
Compounded Annual Gain – 1965-2021 . . . . . . . . . . . . . . . . . . . . . . . . . . . . . . . . . . . . . . . . . . . .
Overall Gain – 1964-2021 . . . . . . . . . . . . . . . . . . . . . . . . . . . . . . . . . . . . . . . . . . . . . . . . . . . . . . . .
in Per-Share
Market Value of
Berkshire
49.5
(3.4)
13.3
77.8
19.4
(4.6)
80.5
8.1
(2.5)
(48.7)
2.5
129.3
46.8
14.5
102.5
32.8
31.8
38.4
69.0
(2.7)
93.7
14.2
4.6
59.3
84.6
(23.1)
35.6
29.8
38.9
25.0
57.4
6.2
34.9
52.2
(19.9)
26.6
6.5
(3.8)
15.8
4.3
0.8
24.1
28.7
(31.8)
2.7
21.4
(4.7)
16.8
32.7
27.0
(12.5)
23.4
21.9
2.8
11.0
2.4
29.6
20.1%
3,641,613%
Note: Data are for calendar years with these exceptions: 1965 and 1966, year ended 9/30; 1967, 15 months ended 12/31.
2
in S&P 500
with Dividends
Included
10.0
(11.7)
30.9
11.0
(8.4)
3.9
14.6
18.9
(14.8)
(26.4)
37.2
23.6
(7.4)
6.4
18.2
32.3
(5.0)
21.4
22.4
6.1
31.6
18.6
5.1
16.6
31.7
(3.1)
30.5
7.6
10.1
1.3
37.6
23.0
33.4
28.6
21.0
(9.1)
(11.9)
(22.1)
28.7
10.9
4.9
15.8
5.5
(37.0)
26.5
15.1
2.1
16.0
32.4
13.7
1.4
12.0
21.8
(4.4)
31.5
18.4
28.7
10.5%
30,209%
�
BERKSHIRE HATHAWAY INC.
To the Shareholders of Berkshire Hathaway Inc.:
Charlie Munger, my long-time partner, and I have the job of managing a portion of your savings. We are
honored by your trust.
Our position carries with it the responsibility to report to you what we would like to know if we were the
absentee owner and you were the manager. We enjoy communicating directly with you through this annual letter, and
through the annual meeting as well.
Our policy is to treat all shareholders equally. Therefore, we do not hold discussions with analysts nor large
institutions. Whenever possible, also, we release important communications on Saturday mornings in order to
maximize the time for shareholders and the media to absorb the news before markets open on Monday.
A wealth of Berkshire facts and figures are set forth in the annual 10-K that the company regularly files with
the S.E.C. and that we reproduce on pages K-1 – K-119. Some shareholders will find this detail engrossing; others
will simply prefer to learn what Charlie and I believe is new or interesting at Berkshire.
Alas, there was little action of that sort in 2021. We did, though, make reasonable progress in increasing the
intrinsic value of your shares. That task has been my primary duty for 57 years. And it will continue to be.
What You Own
Berkshire owns a wide variety of businesses, some in their entirety, some only in part. The second group
largely consists of marketable common stocks of major American companies. Additionally, we own a few non-U.S.
equities and participate in several joint ventures or other collaborative activities.
Whatever our form of ownership, our goal is to have meaningful investments in businesses with both durable
economic advantages and a first-class CEO. Please note particularly that we own stocks based upon our expectations
about their long-term business performance and not because we view them as vehicles for timely market moves. That
point is crucial: Charlie and I are not stock-pickers; we are business-pickers.
I make many mistakes. Consequently, our extensive collection of businesses includes some enterprises that
have truly extraordinary economics, many others that enjoy good economic characteristics, and a few that are
marginal. One advantage of our common-stock segment is that – on occasion – it becomes easy to buy pieces of
wonderful businesses at wonderful prices. That shooting-fish-in-a-barrel experience is very rare in negotiated
transactions and never occurs en masse. It is also far easier to exit from a mistake when it has been made in the
marketable arena.
3
�
Surprise, Surprise
Here are a few items about your company that often surprise even seasoned investors:
•
•
Many people perceive Berkshire as a large and somewhat strange collection of financial assets. In truth,
Berkshire owns and operates more U.S.-based “infrastructure” assets – classified on our balance sheet as
property, plant and equipment – than are owned and operated by any other American corporation. That
supremacy has never been our goal. It has, however, become a fact.
At yearend, those domestic infrastructure assets were carried on Berkshire’s balance sheet at $158 billion.
That number increased last year and will continue to increase. Berkshire always will be building.
Every year, your company makes substantial federal income tax payments. In 2021, for example, we paid
$3.3 billion while the U.S. Treasury reported total corporate income-tax receipts of $402 billion.
Additionally, Berkshire pays substantial state and foreign taxes. “I gave at the office” is an unassailable
assertion when made by Berkshire shareholders.
Berkshire’s history vividly illustrates the invisible and often unrecognized financial partnership between
government and American businesses. Our tale begins early in 1955, when Berkshire Fine Spinning and
Hathaway Manufacturing agreed to merge their businesses. In their requests for shareholder approval, these
venerable New England textile companies expressed high hopes for the combination.
The Hathaway solicitation, for example, assured its shareholders that “The combination of the resources and
managements will result in one of the strongest and most efficient organizations in the textile industry.” That
upbeat view was endorsed by the company’s advisor, Lehman Brothers (yes, that Lehman Brothers).
I’m sure it was a joyous day in both Fall River (Berkshire) and New Bedford (Hathaway) when the union
was consummated. After the bands stopped playing and the bankers went home, however, the shareholders
reaped a disaster.
In the nine years following the merger, Berkshire’s owners watched the company’s net worth crater from
$51.4 million to $22.1 million. In part, this decline was caused by stock repurchases, ill-advised dividends
and plant shutdowns. But nine years of effort by many thousands of employees delivered an operating loss
as well. Berkshire’s struggles were not unusual: The New England textile industry had silently entered an
extended and non-reversible death march.
During the nine post-merger years, the U.S. Treasury suffered as well from Berkshire’s troubles. All told, the
company paid the government only $337,359 in income tax during that period – a pathetic $100 per day.
Early in 1965, things changed. Berkshire installed new management that redeployed available cash and
steered essentially all earnings into a variety of good businesses, most of which remained good through the
years. Coupling reinvestment of earnings with the power of compounding worked its magic, and shareholders
prospered.
Berkshire’s owners, it should be noted, were not the only beneficiary of that course correction. Their “silent
partner,” the U.S. Treasury, proceeded to collect many tens of billions of dollars from the company in income
tax payments. Remember the $100 daily? Now, Berkshire pays roughly $9 million daily to the Treasury.
4
�
In fairness to our governmental partner, our shareholders should acknowledge – indeed trumpet – the fact
that Berkshire’s prosperity has been fostered mightily because the company has operated in America. Our
country would have done splendidly in the years since 1965 without Berkshire. Absent our American home,
however, Berkshire would never have come close to becoming what it is today. When you see the flag, say
thanks.
•
From an $8.6 million purchase of National Indemnity in 1967, Berkshire has become the world leader in
insurance “float” – money we hold and can invest but that does not belong to us. Including a relatively small
sum derived from life insurance, Berkshire’s total float has grown from $19 million when we entered the
insurance business to $147 billion.
So far, this float has cost us less than nothing. Though we have experienced a number of years when insurance
losses combined with operating expenses exceeded premiums, overall we have earned a modest 55-year
profit from the underwriting activities that generated our float.
Of equal importance, float is very sticky. Funds attributable to our insurance operations come and go daily,
but their aggregate total is immune from precipitous decline. When it comes to investing float, we can
therefore think long-term.
If you are not already familiar with the concept of float, I refer you to a long explanation on page A-5. To
my surprise, our float increased $9 billion last year, a buildup of value that is important to Berkshire owners
though is not reflected in our GAAP (“generally-accepted accounting principles”) presentation of earnings
and net worth.
Much of our huge value creation in insurance is attributable to Berkshire’s good luck in my 1986 hiring of
Ajit Jain. We first met on a Saturday morning, and I quickly asked Ajit what his insurance experience had
been. He replied, “None.”
I said, “Nobody’s perfect,” and hired him. That was my lucky day: Ajit actually was as perfect a choice as
could have been made. Better yet, he continues to be – 35 years later.
One final thought about insurance: I believe that it is likely – but far from assured – that Berkshire’s float
can be maintained without our incurring a long-term underwriting loss. I am certain, however, that there will
be some years when we experience such losses, perhaps involving very large sums.
Berkshire is constructed to handle catastrophic events as no other insurer – and that priority will remain long
after Charlie and I are gone.
Our Four Giants
Through Berkshire, our shareholders own many dozens of businesses. Some of these, in turn, have a
collection of subsidiaries of their own. For example, Marmon has more than 100 individual business operations,
ranging from the leasing of railroad cars to the manufacture of medical devices.
•
Nevertheless, operations of our “Big Four” companies account for a very large chunk of Berkshire’s value.
Leading this list is our cluster of insurers. Berkshire effectively owns 100% of this group, whose massive
float value we earlier described. The invested assets of these insurers are further enlarged by the extraordinary
amount of capital we invest to back up their promises.
5
�
•
•
•
The insurance business is made to order for Berkshire. The product will never be obsolete, and sales volume
will generally increase along with both economic growth and inflation. Also, integrity and capital will forever
be important. Our company can and will behave well.
There are, of course, other insurers with excellent business models and prospects. Replication of Berkshire’s
operation, however, would be almost impossible.
Apple – our runner-up Giant as measured by its yearend market value – is a different sort of holding. Here,
our ownership is a mere 5.55%, up from 5.39% a year earlier. That increase sounds like small potatoes. But
consider that each 0.1% of Apple’s 2021 earnings amounted to $100 million. We spent no Berkshire funds
to gain our accretion. Apple’s repurchases did the job.
It’s important to understand that only dividends from Apple are counted in the GAAP earnings Berkshire
reports – and last year, Apple paid us $785 million of those. Yet our “share” of Apple’s earnings amounted
to a staggering $5.6 billion. Much of what the company retained was used to repurchase Apple shares, an act
we applaud. Tim Cook, Apple’s brilliant CEO, quite properly regards users of Apple products as his first
love, but all of his other constituencies benefit from Tim’s managerial touch as well.
BNSF, our third Giant, continues to be the number one artery of American commerce, which makes it an
indispensable asset for America as well as for Berkshire. If the many essential products BNSF carries were
instead hauled by truck, America’s carbon emissions would soar.
Your railroad had record earnings of $6 billion in 2021. Here, it should be noted, we are talking about the
old-fashioned sort of earnings that we favor: a figure calculated after interest,
taxes, depreciation,
amortization and all forms of compensation. (Our definition suggests a warning: Deceptive “adjustments” to
earnings – to use a polite description – have become both more frequent and more fanciful as stocks have
risen. Speaking less politely, I would say that bull markets breed bloviated bull . . ..)
BNSF trains traveled 143 million miles last year and carried 535 million tons of cargo. Both accomplishments
far exceed those of any other American carrier. You can be proud of your railroad.
BHE, our final Giant, earned a record $4 billion in 2021. That’s up more than 30-fold from the $122 million
earned in 2000, the year that Berkshire first purchased a BHE stake. Now, Berkshire owns 91.1% of the
company.
BHE’s record of societal accomplishment is as remarkable as its financial performance. The company had
no wind or solar generation in 2000. It was then regarded simply as a relatively new and minor participant in
the huge electric utility industry. Subsequently, under David Sokol’s and Greg Abel’s leadership, BHE has
become a utility powerhouse (no groaning, please) and a leading force in wind, solar and transmission
throughout much of the United States.
Greg’s report on these accomplishments appears on pages A-3 and A-4. The profile you will find there is not
in any way one of those currently-fashionable “green-washing” stories. BHE has been faithfully detailing its
plans and performance in renewables and transmissions every year since 2007.
To further review this information, visit BHE’s website at brkenergy.com. There, you will see that the
company has long been making climate-conscious moves that soak up all of its earnings. More opportunities
lie ahead. BHE has the management, the experience, the capital and the appetite for the huge power projects
that our country needs.
6
�
Investments
Now let’s talk about companies we don’t control, a list that again references Apple. Below we list our fifteen
largest equity holdings, several of which are selections of Berkshire’s two long-time investment managers, Todd
Combs and Ted Weschler. At yearend, this valued pair had total authority in respect to $34 billion of investments,
many of which do not meet the threshold value we use in the table. Also, a significant portion of the dollars that Todd
and Ted manage are lodged in various pension plans of Berkshire-owned businesses, with the assets of these plans not
included in this table.
Shares
Company
Percentage of
Company
Owned
151,610,700 American Express Company . . . . . . . . . . . . . . . . . . . .
907,559,761 Apple Inc.
. . . . . . . . . . . . . . . . . . . . . . . . . . . . . . . . . .
1,032,852,006 Bank of America Corp. . . . . . . . . . . . . . . . . . . . . . . . .
66,835,615 The Bank of New York Mellon Corp.
. . . . . . . . . . . .
225,000,000 BYD Co. Ltd.**. . . . . . . . . . . . . . . . . . . . . . . . . . . . . .
3,828,941 Charter Communications, Inc.
. . . . . . . . . . . . . . . . . .
38,245,036 Chevron Corporation . . . . . . . . . . . . . . . . . . . . . . . . . .
400,000,000 The Coca-Cola Company . . . . . . . . . . . . . . . . . . . . . .
52,975,000 General Motors Company . . . . . . . . . . . . . . . . . . . . . .
89,241,000 ITOCHU Corporation . . . . . . . . . . . . . . . . . . . . . . . . .
81,714,800 Mitsubishi Corporation . . . . . . . . . . . . . . . . . . . . . . . .
93,776,200 Mitsui & Co., Ltd. . . . . . . . . . . . . . . . . . . . . . . . . . . . .
24,669,778 Moody’s Corporation . . . . . . . . . . . . . . . . . . . . . . . . .
143,456,055 U.S. Bancorp . . . . . . . . . . . . . . . . . . . . . . . . . . . . . . . .
158,824,575 Verizon Communications Inc.
. . . . . . . . . . . . . . . . . .
Others*** . . . . . . . . . . . . . . . . . . . . . . . . . . . . . . . . . .
19.9
5.6
12.8
8.3
7.7
2.2
2.0
9.2
3.6
5.6
5.5
5.7
13.3
9.7
3.8
12/31/21
Cost*
Market
(in millions)
1,287
31,089
14,631
2,918
232
643
3,420
1,299
1,616
2,099
2,102
1,621
248
5,384
9,387
26,629
24,804
161,155
45,952
3,882
7,693
2,496
4,488
23,684
3,106
2,728
2,593
2,219
9,636
8,058
8,253
39,972
Total Equity Investments Carried at Market . . . . . . . .
$ 104,605
$ 350,719
*
**
***
This is our actual purchase price and also our tax basis.
Held by BHE; consequently, Berkshire shareholders have only a 91.1% interest in this position.
Includes a $10 billion investment in Occidental Petroleum, consisting of preferred stock and warrants to
buy common stock, a combination now being valued at $10.7 billion.
In addition to the footnoted Occidental holding and our various common-stock positions, Berkshire also owns
a 26.6% interest in Kraft Heinz (accounted for on the “equity” method, not market value, and carried at $13.1 billion)
and 38.6% of Pilot Corp., a leader in travel centers that had revenues last year of $45 billion.
Since we purchased our Pilot stake in 2017, this holding has warranted “equity” accounting treatment. Early
in 2023, Berkshire will purchase an additional interest in Pilot that will raise our ownership to 80% and lead to our
fully consolidating Pilot’s earnings, assets and liabilities in our financial statements.
7
�
U.S. Treasury Bills
Berkshire’s balance sheet includes $144 billion of cash and cash equivalents (excluding the holdings of
BNSF and BHE). Of this sum, $120 billion is held in U.S. Treasury bills, all maturing in less than a year. That stake
leaves Berkshire financing about 1⁄2 of 1% of the publicly-held national debt.
Charlie and I have pledged that Berkshire (along with our subsidiaries other than BNSF and BHE) will always
hold more than $30 billion of cash and equivalents. We want your company to be financially impregnable and never
dependent on the kindness of strangers (or even that of friends). Both of us like to sleep soundly, and we want our
creditors, insurance claimants and you to do so as well.
But $144 billion?
That imposing sum, I assure you, is not some deranged expression of patriotism. Nor have Charlie and I lost
our overwhelming preference for business ownership. Indeed, I first manifested my enthusiasm for that 80 years ago,
on March 11, 1942, when I purchased three shares of Cities Services preferred stock. Their cost was $114.75 and
required all of my savings. (The Dow Jones Industrial Average that day closed at 99, a fact that should scream to you:
Never bet against America.)
After my initial plunge, I always kept at least 80% of my net worth in equities. My favored status throughout
that period was 100% – and still is. Berkshire’s current 80%-or-so position in businesses is a consequence of my
failure to find entire companies or small portions thereof (that is, marketable stocks) which meet our criteria for long-
term holding.
Charlie and I have endured similar cash-heavy positions from time to time in the past. These periods are
never pleasant; they are also never permanent. And, fortunately, we have had a mildly attractive alternative during
2020 and 2021 for deploying capital. Read on.
Share Repurchases
There are three ways that we can increase the value of your investment. The first is always front and center
in our minds: Increase the long-term earning power of Berkshire’s controlled businesses through internal growth or
by making acquisitions. Today, internal opportunities deliver far better returns than acquisitions. The size of those
opportunities, however, is small compared to Berkshire’s resources.
Our second choice is to buy non-controlling part-interests in the many good or great businesses that are
publicly traded. From time to time, such possibilities are both numerous and blatantly attractive. Today, though, we
find little that excites us.
That’s largely because of a truism: Long-term interest rates that are low push the prices of all productive
investments upward, whether these are stocks, apartments, farms, oil wells, whatever. Other factors influence
valuations as well, but interest rates will always be important.
Our final path to value creation is to repurchase Berkshire shares. Through that simple act, we increase your
share of the many controlled and non-controlled businesses Berkshire owns. When the price/value equation is right,
this path is the easiest and most certain way for us to increase your wealth. (Alongside the accretion of value to
continuing shareholders, a couple of other parties gain: Repurchases are modestly beneficial to the seller of the
repurchased shares and to society as well.)
8
�
Periodically, as alternative paths become unattractive, repurchases make good sense for Berkshire’s owners.
During the past two years, we therefore repurchased 9% of the shares that were outstanding at yearend 2019 for a total
cost of $51.7 billion. That expenditure left our continuing shareholders owning about 10% more of all Berkshire
businesses, whether these are wholly-owned (such as BNSF and GEICO) or partly-owned (such as Coca-Cola and
Moody’s).
I want to underscore that for Berkshire repurchases to make sense, our shares must offer appropriate value.
We don’t want to overpay for the shares of other companies, and it would be value-destroying if we were to overpay
when we are buying Berkshire. As of February 23, 2022, since yearend we repurchased additional shares at a cost of
$1.2 billion. Our appetite remains large but will always remain price-dependent.
It should be noted that Berkshire’s buyback opportunities are limited because of its high-class investor base.
If our shares were heavily held by short-term speculators, both price volatility and transaction volumes would
materially increase. That kind of reshaping would offer us far greater opportunities for creating value by making
repurchases. Nevertheless, Charlie and I far prefer the owners we have, even though their admirable buy-and-keep
attitudes limit the extent to which long-term shareholders can profit from opportunistic repurchases.
Finally, one easily-overlooked value calculation specific to Berkshire: As we’ve discussed, insurance “float”
of the right sort is of great value to us. As it happens, repurchases automatically increase the amount of “float” per
share. That figure has increased during the past two years by 25% – going from $79,387 per “A” share to $99,497, a
meaningful gain that, as noted, owes some thanks to repurchases.
A Wonderful Man and a Wonderful Business
Last year, Paul Andrews died. Paul was the founder and CEO of TTI, a Fort Worth-based subsidiary of
Berkshire. Throughout his life – in both his business and his personal pursuits – Paul quietly displayed all the qualities
that Charlie and I admire. His story should be told.
In 1971, Paul was working as a purchasing agent for General Dynamics when the roof fell in. After losing a
huge defense contract, the company fired thousands of employees, including Paul.
With his first child due soon, Paul decided to bet on himself, using $500 of his savings to found Tex-Tronics
(later renamed TTI). The company set itself up to distribute small electronic components, and first-year sales totaled
$112,000. Today, TTI markets more than one million different items with annual volume of $7.7 billion.
But back to 2006: Paul, at 63, then found himself happy with his family, his job, and his associates. But he
had one nagging worry, heightened because he had recently witnessed a friend’s early death and the disastrous results
that followed for that man’s family and business. What, Paul asked himself in 2006, would happen to the many people
depending on him if he should unexpectedly die?
For a year, Paul wrestled with his options. Sell to a competitor? From a strictly economic viewpoint, that
course made the most sense. After all, competitors could envision lucrative “synergies” – savings that would be
achieved as the acquiror slashed duplicated functions at TTI.
But . . . Such a purchaser would most certainly also retain its CFO, its legal counsel, its HR unit. Their TTI
counterparts would therefore be sent packing. And ugh! If a new distribution center were to be needed, the acquirer’s
home city would certainly be favored over Fort Worth.
9
�


 2025年软考高级信息系统项目管理师金色考点
 软考高项三色笔记
 镇安县双鑫矿业月河年处理15万吨尾渣综合加工利用项目水土保持报告表
 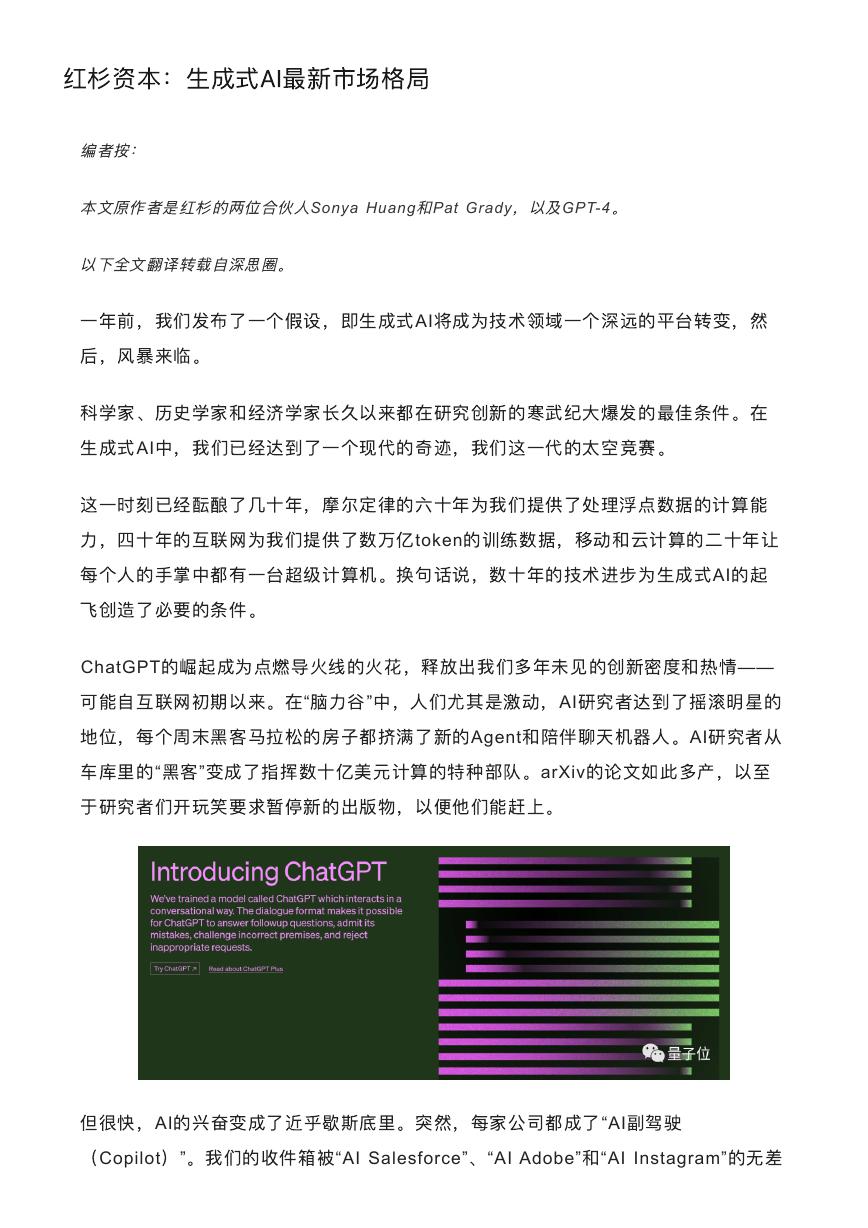 红杉资本:生成式AI最新市场格局.pdf
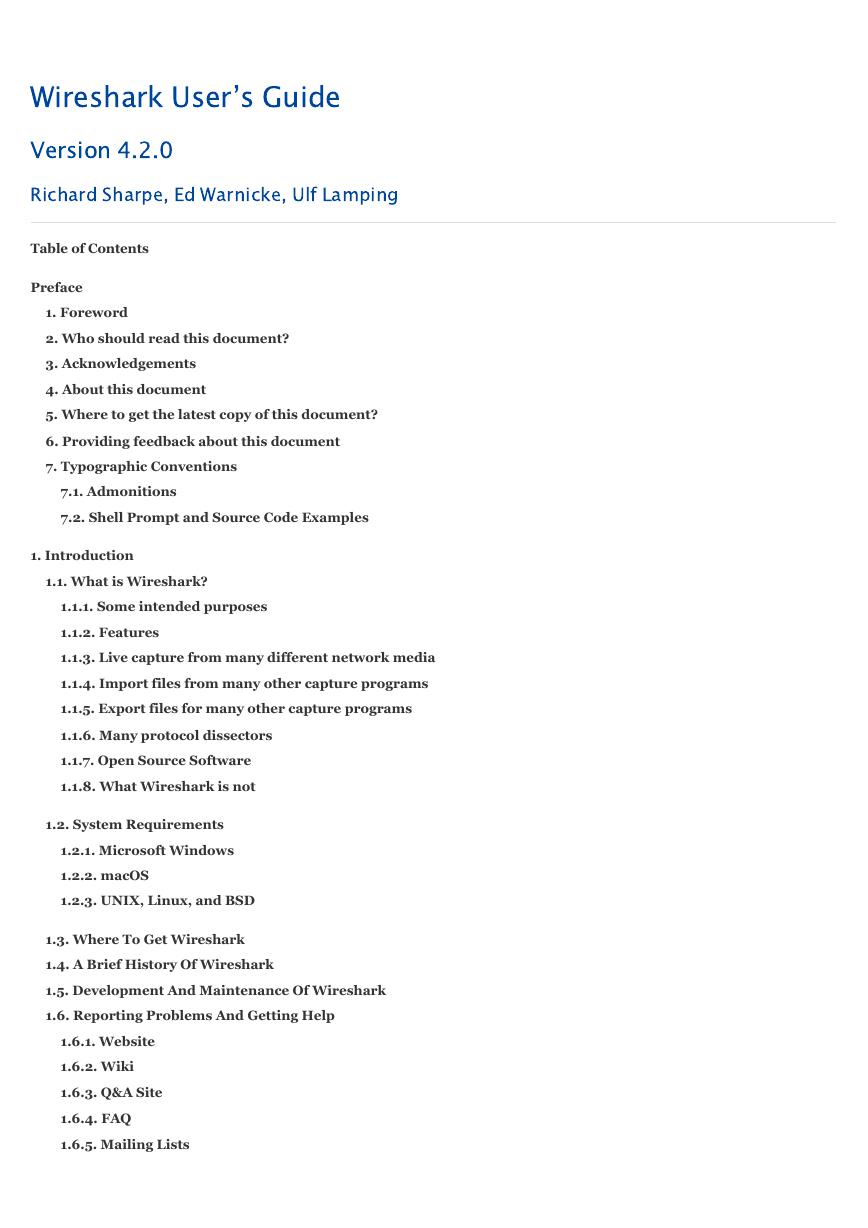 wireshark 使用教程.pdf
 【2021年-贝佐斯致股东的信】.pdf
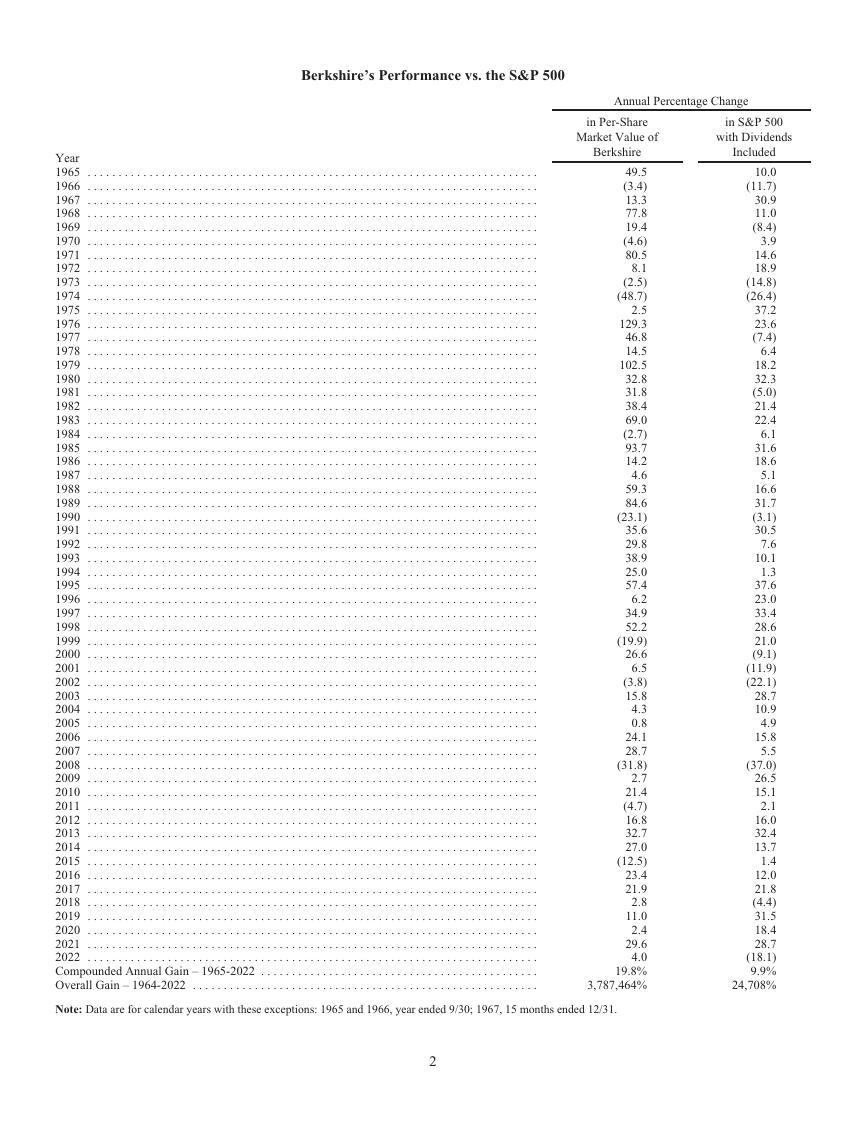 巴菲特致股东的公开信 - 2022.pdf
 MySQL 8.1 参考手册.pdf
 世界银行报告下载:激进政策缩紧浪潮不足遏制通胀 全球经济衰退迫在眉睫(Is a Global Recession Imminent?).pdf
 红杉资本报告:适应与忍耐(Adapting to Endure).pdf
 高保真音响系统设计制作-毕业论文.doc
 一种自适应互补滤波姿态估计算法.pdf