Note: The following table appears in the printed Annual Report on the facing page of the
Chairman's Letter and is referred to in that letter.
Berkshire’s Corporate Performance vs. the S&P 500
Annual Percentage Change
in S&P 500
with Dividends
Included
in Per-Share
Book Value of
Berkshire
(1)
(2)
Year
1965
1966
1967
1968
1969
1970
1971
1972
1973
1974
1975
1976
1977
1978
1979
1980
1981
1982
1983
1984
1985
1986
1987
1988
1989
1990
1991
1992
1993
1994
1995
1996
1997
1998
1999
2000
2001
2002
..................................................
..................................................
..................................................
..................................................
..................................................
..................................................
..................................................
..................................................
..................................................
..................................................
..................................................
..................................................
..................................................
..................................................
..................................................
..................................................
..................................................
..................................................
..................................................
..................................................
..................................................
..................................................
..................................................
..................................................
..................................................
..................................................
..................................................
..................................................
..................................................
..................................................
..................................................
..................................................
..................................................
..................................................
..................................................
..................................................
..................................................
..................................................
23.8
20.3
11.0
19.0
16.2
12.0
16.4
21.7
4.7
5.5
21.9
59.3
31.9
24.0
35.7
19.3
31.4
40.0
32.3
13.6
48.2
26.1
19.5
20.1
44.4
7.4
39.6
20.3
14.3
13.9
43.1
31.8
34.1
48.3
.5
6.5
(6.2)
10.0
10.0
(11.7)
30.9
11.0
(8.4)
3.9
14.6
18.9
(14.8)
(26.4)
37.2
23.6
(7.4)
6.4
18.2
32.3
(5.0)
21.4
22.4
6.1
31.6
18.6
5.1
16.6
31.7
(3.1)
30.5
7.6
10.1
1.3
37.6
23.0
33.4
28.6
21.0
(9.1)
(11.9)
(22.1)
Relative
Results
(1)-(2)
13.8
32.0
(19.9)
8.0
24.6
8.1
1.8
2.8
19.5
31.9
(15.3)
35.7
39.3
17.6
17.5
(13.0)
36.4
18.6
9.9
7.5
16.6
7.5
14.4
3.5
12.7
10.5
9.1
12.7
4.2
12.6
5.5
8.8
.7
19.7
(20.5)
15.6
5.7
32.1
Average Annual Gain 1965-2002
Overall Gain 1964-2002
22.2
214,433
10.0
3,663
12.2
Notes: Data are for calendar years with these exceptions: 1965 and 1966, year ended 9/30; 1967, 15 months ended 12/31.
Starting in 1979, accounting rules required insurance companies to value the equity securities they hold at market
rather than at the lower of cost or market, which was previously the requirement. In this table, Berkshire’s results
through 1978 have been restated to conform to the changed rules. In all other respects, the results are calculated using
the numbers originally reported.
The S&P 500 numbers are pre-tax whereas the Berkshire numbers are after-tax. If a corporation such as Berkshire
were simply to have owned the S&P 500 and accrued the appropriate taxes, its results would have lagged the S&P 500
in years when that index showed a positive return, but would have exceeded the S&P in years when the index showed a
negative return. Over the years, the tax costs would have caused the aggregate lag to be substantial.
2
�
BERKSHIRE HATHAWAY INC.
To the Shareholders of Berkshire Hathaway Inc.:
Our gain in net worth during 2002 was $6.1 billion, which increased the per-share book value of
both our Class A and Class B stock by 10.0%. Over the last 38 years (that is, since present management
took over) per-share book value has grown from $19 to $41,727, a rate of 22.2% compounded annually.∗
•
•
•
In all respects 2002 was a banner year. I’ll provide details later, but here’s a summary:
Our various non-insurance operations performed exceptionally well, despite a sluggish economy.
A decade ago Berkshire’s annual pre-tax earnings from our non-insurance businesses was $272
million. Now, from our ever-expanding collection of manufacturing, retailing, service and finance
businesses, we earn that sum monthly.
Our insurance group increased its float to $41.2 billion, a hefty gain of $5.7 billion. Better yet, the
use of these funds in 2002 cost us only 1%. Getting back to low-cost float feels good, particularly
after our poor results during the three previous years. Berkshire’s reinsurance division and
GEICO shot the lights out in 2002, and underwriting discipline was restored at General Re.
Berkshire acquired some important new businesses – with economic characteristics ranging from
good to great, run by managers ranging from great to great. Those attributes are two legs of our
“entrance” strategy, the third being a sensible purchase price. Unlike LBO operators and private
equity firms, we have no “exit” strategy – we buy to keep. That’s one reason why Berkshire is
usually the first – and sometimes the only – choice for sellers and their managers.
Our marketable securities outperformed most indices. For Lou Simpson, who manages equities at
GEICO, this was old stuff. But, for me, it was a welcome change from the last few years, during
which my investment record was dismal.
The confluence of these favorable factors in 2002 caused our book-value gain to outstrip the
performance of the S&P 500 by 32.1 percentage points. This result is aberrational: Charlie Munger,
Berkshire’s vice chairman and my partner, and I hope to achieve – at most – an average annual advantage
of a few points. In the future, there will be years in which the S&P soundly trounces us. That will in fact
almost certainly happen during a strong bull market, because the portion of our assets committed to
common stocks has significantly declined. This change, of course, helps our relative performance in down
markets such as we had in 2002.
•
I have another caveat to mention about last year’s results. If you’ve been a reader of financial
reports in recent years, you’ve seen a flood of “pro-forma” earnings statements – tabulations in which
managers invariably show “earnings” far in excess of those allowed by their auditors. In these
presentations, the CEO tells his owners “don’t count this, don’t count that – just count what makes earnings
fat.” Often, a forget-all-this-bad-stuff message is delivered year after year without management so much as
blushing.
∗All figures used in this report apply to Berkshire's A shares, the successor to the only stock that
the company had outstanding before 1996. The B shares have an economic interest equal to 1/30th that of
the A.
3
�
We’ve yet to see a pro-forma presentation disclosing that audited earnings were somewhat high.
So let’s make a little history: Last year, on a pro-forma basis, Berkshire had lower earnings than those we
actually reported.
That is true because two favorable factors aided our reported figures. First, in 2002 there was no
megacatastrophe, which means that Berkshire (and other insurers as well) earned more from insurance than
if losses had been normal. In years when the reverse is true – because of a blockbuster hurricane,
earthquake or man-made disaster – many insurers like to report that they would have earned X “except for”
the unusual event. The implication is that since such megacats are infrequent, they shouldn’t be counted
when “true” earnings are calculated. That is deceptive nonsense. “Except for” losses will forever be part
of the insurance business, and they will forever be paid with shareholders’ money.
Nonetheless, for the purposes of this exercise, we’ll take a page from the industry’s book. For last
year, when we didn’t have any truly major disasters, a downward adjustment is appropriate if you wish to
“normalize” our underwriting result.
Secondly, the bond market in 2002 favored certain strategies we employed in our finance and
financial products business. Gains from those strategies will certainly diminish within a year or two – and
may well disappear.
Soooo . . . “except for” a couple of favorable breaks, our pre-tax earnings last year would have
been about $500 million less than we actually reported. We’re happy, nevertheless, to bank the excess. As
Jack Benny once said upon receiving an award: “I don’t deserve this honor – but, then, I have arthritis, and
I don’t deserve that either.”
* * * * * * * * * * * *
We continue to be blessed with an extraordinary group of managers, many of whom haven’t the
slightest financial need to work. They stick around, though: In 38 years, we’ve never had a single CEO of
a subsidiary elect to leave Berkshire to work elsewhere. Counting Charlie, we now have six managers over
75, and I hope that in four years that number increases by at least two (Bob Shaw and I are both 72). Our
rationale: “It’s hard to teach a new dog old tricks.”
Berkshire’s operating CEOs are masters of their crafts and run their businesses as if they were
their own. My job is to stay out of their way and allocate whatever excess capital their businesses generate.
It’s easy work.
My managerial model is Eddie Bennett, who was a batboy. In 1919, at age 19, Eddie began his
work with the Chicago White Sox, who that year went to the World Series. The next year, Eddie switched
to the Brooklyn Dodgers, and they, too, won their league title. Our hero, however, smelled trouble.
Changing boroughs, he joined the Yankees in 1921, and they promptly won their first pennant in history.
Now Eddie settled in, shrewdly seeing what was coming. In the next seven years, the Yankees won five
American League titles.
What does this have to do with management? It’s simple – to be a winner, work with winners. In
1927, for example, Eddie received $700 for the 1/8th World Series share voted him by the legendary
Yankee team of Ruth and Gehrig. This sum, which Eddie earned by working only four days (because New
York swept the Series) was roughly equal to the full-year pay then earned by batboys who worked with
ordinary associates.
Eddie understood that how he lugged bats was unimportant; what counted instead was hooking up
with the cream of those on the playing field. I’ve learned from Eddie. At Berkshire, I regularly hand bats
to many of the heaviest hitters in American business.
Acquisitions
We added some sluggers to our lineup last year. Two acquisitions pending at yearend 2001 were
completed: Albecca (which operates under the name Larson-Juhl), the U.S. leader in custom-made picture
frames; and Fruit of the Loom, the producer of about 33.3% of the men’s and boy’s underwear sold in the
U.S. and of other apparel as well.
4
�
Both companies came with outstanding CEOs: Steve McKenzie at Albecca and John Holland at
Fruit. John, who had retired from Fruit in 1996, rejoined it three years ago and rescued the company from
the disastrous path it had gone down after he’d left. He’s now 70, and I am trying to convince him to make
his next retirement coincident with mine (presently scheduled for five years after my death – a date subject,
however, to extension).
We initiated and completed two other acquisitions last year that were somewhat below our normal
size threshold. In aggregate, however, these businesses earn more than $60 million pre-tax annually. Both
operate in industries characterized by tough economics, but both also have important competitive strengths
that enable them to earn decent returns on capital.
The newcomers are:
(a)
CTB, a worldwide leader in equipment for the poultry, hog, egg production and grain
industries; and
Garan, a manufacturer of children’s apparel, whose largest and best-known line is
Garanimals®.
(b)
These two companies came with the managers responsible for their impressive records: Vic
Mancinelli at CTB and Seymour Lichtenstein at Garan.
The largest acquisition we initiated in 2002 was The Pampered Chef, a company with a fascinating
history dating back to 1980. Doris Christopher was then a 34-year-old suburban Chicago home economics
teacher with a husband, two little girls, and absolutely no business background. Wanting, however, to
supplement her family’s modest income, she turned to thinking about what she knew best – food
preparation. Why not, she wondered, make a business out of marketing kitchenware, focusing on the items
she herself had found most useful?
To get started, Doris borrowed $3,000 against her life insurance policy – all the money ever
injected into the company – and went to the Merchandise Mart on a buying expedition. There, she picked
up a dozen each of this and that, and then went home to set up operations in her basement.
Her plan was to conduct in-home presentations to small groups of women, gathered at the homes
of their friends. While driving to her first presentation, though, Doris almost talked herself into returning
home, convinced she was doomed to fail.
But the women she faced that evening loved her and her products, purchased $175 of goods, and
TPC was underway. Working with her husband, Jay, Doris did $50,000 of business in the first year.
Today – only 22 years later – TPC does more than $700 million of business annually, working through
67,000 kitchen consultants.
I’ve been to a TPC party, and it’s easy to see why the business is a success. The company’s
products, in large part proprietary, are well-styled and highly useful, and the consultants are knowledgeable
and enthusiastic. Everyone has a good time. Hurry to pamperedchef.com on the Internet to find where to
attend a party near you.
Two years ago, Doris brought in Sheila O’Connell Cooper, now CEO, to share the management
load, and in August they met with me in Omaha. It took me about ten seconds to decide that these were
two managers with whom I wished to partner, and we promptly made a deal. Berkshire shareholders
couldn’t be luckier than to be associated with Doris and Sheila.
* * * * * * * * * * * *
Berkshire also made some important acquisitions last year through MidAmerican Energy Holdings
(MEHC), a company in which our equity interest is 80.2%. Because the Public Utility Holding Company
Act (PUHCA) limits us to 9.9% voting control, however, we are unable to fully consolidate MEHC’s
financial statements.
Despite the voting-control limitation – and the somewhat strange capital structure at MEHC it has
engendered – the company is a key part of Berkshire. Already it has $18 billion of assets and delivers our
largest stream of non-insurance earnings. It could well grow to be huge.
5
�
Last year MEHC acquired two important gas pipelines. The first, Kern River, extends from
Southwest Wyoming to Southern California. This line moves about 900 million cubic feet of gas a day and
is undergoing a $1.2 billion expansion that will double throughput by this fall. At that point, the line will
carry enough gas to generate electricity for ten million homes.
The second acquisition, Northern Natural Gas, is a 16,600 mile line extending from the Southwest
to a wide range of Midwestern locations. This purchase completes a corporate odyssey of particular
interest to Omahans.
From its beginnings in the 1930s, Northern Natural was one of Omaha’s premier businesses, run
by CEOs who regularly distinguished themselves as community leaders. Then, in July, 1985, the company
– which in 1980 had been renamed InterNorth – merged with Houston Natural Gas, a business less than
half its size. The companies announced that the enlarged operation would be headquartered in Omaha,
with InterNorth’s CEO continuing in that job.
Within a year, those promises were broken. By then, the former CEO of Houston Natural had
taken over the top job at InterNorth, the company had been renamed, and the headquarters had been moved
to Houston. These switches were orchestrated by the new CEO – Ken Lay – and the name he chose was
Enron.
Fast forward 15 years to late 2001. Enron ran into the troubles we’ve heard so much about and
borrowed money from Dynegy, putting up the Northern Natural pipeline operation as collateral. The two
companies quickly had a falling out, and the pipeline’s ownership moved to Dynegy. That company, in
turn, soon encountered severe financial problems of its own.
MEHC received a call on Friday, July 26, from Dynegy, which was looking for a quick and
certain cash sale of the pipeline. Dynegy phoned the right party: On July 29, we signed a contract, and
shortly thereafter Northern Natural returned home.
When 2001 began, Charlie and I had no idea that Berkshire would be moving into the pipeline
business. But upon completion of the Kern River expansion, MEHC will transport about 8% of all gas
used in the U.S. We continue to look for large energy-related assets, though in the electric utility field
PUHCA constrains what we can do.
* * * * * * * * * * * *
A few years ago, and somewhat by accident, MEHC found itself in the residential real estate
brokerage business. It is no accident, however, that we have dramatically expanded the operation.
Moreover, we are likely to keep on expanding in the future.
We call this business HomeServices of America. In the various communities it serves, though, it
operates under the names of the businesses it has acquired, such as CBS in Omaha, Edina Realty in
Minneapolis and Iowa Realty in Des Moines. In most metropolitan areas in which we operate, we are the
clear market leader.
HomeServices is now the second largest residential brokerage business in the country. On one
side or the other (or both), we participated in $37 billion of transactions last year, up 100% from 2001.
Most of our growth came from three acquisitions we made during 2002, the largest of which was
Prudential California Realty. Last year, this company, the leading realtor in a territory consisting of Los
Angeles, Orange and San Diego Counties, participated in $16 billion of closings.
In a very short period, Ron Peltier, the company’s CEO, has increased HomeServices’ revenues –
and profits – dramatically. Though this business will always be cyclical, it’s one we like and in which we
continue to have an appetite for sensible acquisitions.
* * * * * * * * * * * *
Dave Sokol, MEHC’s CEO, and Greg Abel, his key associate, are huge assets for Berkshire. They
are dealmakers, and they are managers. Berkshire stands ready to inject massive amounts of money into
MEHC – and it will be fun to watch how far Dave and Greg can take the business.
6
�
The Economics of Property/Casualty Insurance
Our core business — though we have others of great importance — is insurance. To understand
Berkshire, therefore, it is necessary that you understand how to evaluate an insurance company. The key
determinants are: (1) the amount of float that the business generates; (2) its cost; and (3) most critical of all,
the long-term outlook for both of these factors.
To begin with, float is money we hold but don't own. In an insurance operation, float arises
because premiums are received before losses are paid, an interval that sometimes extends over many years.
During that time, the insurer invests the money. This pleasant activity typically carries with it a downside:
The premiums that an insurer takes in usually do not cover the losses and expenses it eventually must pay.
That leaves it running an “underwriting loss,” which is the cost of float. An insurance business has value if
its cost of float over time is less than the cost the company would otherwise incur to obtain funds. But the
business is a lemon if its cost of float is higher than market rates for money. Moreover, the downward
trend of interest rates in recent years has transformed underwriting losses that formerly were tolerable into
burdens that move insurance businesses deeply into the lemon category.
Historically, Berkshire has obtained its float at a very low cost. Indeed, our cost has been less than
zero in many years; that is, we’ve actually been paid for holding other people’s money. In 2001, however,
our cost was terrible, coming in at 12.8%, about half of which was attributable to World Trade Center
losses. Back in 1983-84, we had years that were even worse. There’s nothing automatic about cheap float.
The table that follows shows (at intervals) the float generated by the various segments of
Berkshire’s insurance operations since we entered the business 36 years ago upon acquiring National
Indemnity Company (whose traditional lines are included in the segment “Other Primary”). For the table
we have calculated our float — which we generate in large amounts relative to our premium volume — by
adding net loss reserves, loss adjustment reserves, funds held under reinsurance assumed and unearned
premium reserves, and then subtracting insurance-related receivables, prepaid acquisition costs, prepaid
taxes and deferred charges applicable to assumed reinsurance. (Got that?)
Yearend Float (in $ millions)
GEICO
General Re
Other
Reinsurance
2,917
3,125
3,444
3,943
4,251
4,678
14,909
15,166
15,525
19,310
22,207
40
701
4,014
4,305
6,285
7,805
11,262
13,396
Year
1967
1977
1987
1997
1998
1999
2000
2001
2002
Other
Primary
20
131
807
455
415
403
598
685
943
Total
20
171
1,508
7,386
22,754
25,298
27,871
35,508
41,224
Last year our cost of float was 1%. As I mentioned earlier, you should temper your enthusiasm
about this favorable result given that no megacatastrophe occurred in 2002. We’re certain to get one of
these disasters periodically, and when we do our float-cost will spike.
7
�
Our 2002 results were hurt by 1) a painful charge at General Re for losses that should have been
recorded as costs in earlier years, and 2) a “desirable” charge we incur annually for retroactive insurance (see
the next section for more about these items). These costs totaled $1.75 billion, or about 4.6% of float.
Fortunately, our overall underwriting experience on 2002 business was excellent, which allowed us, even
after the charges noted, to approach a no-cost result.
Absent a megacatastrophe, I expect our cost of float in 2003 to again be very low – perhaps even less
than zero. In the rundown of our insurance operations that follows, you will see why I’m optimistic that, over
time, our underwriting results will both surpass those achieved by the industry and deliver us investable funds
at minimal cost.
Insurance Operations
If our insurance operations are to generate low-cost float over time, they must: (a) underwrite with
unwavering discipline; (b) reserve conservatively; and (c) avoid an aggregation of exposures that would allow
a supposedly “impossible” incident to threaten their solvency. All of our major insurance businesses, with
one exception, have regularly met those tests.
The exception is General Re, and there was much to do at that company last year to get it up to
snuff. I’m delighted to report that under Joe Brandon’s leadership, and with yeoman assistance by Tad
Montross, enormous progress has been made on each of the fronts described.
When I agreed in 1998 to merge Berkshire with Gen Re, I thought that company stuck to the three
rules I’ve enumerated. I had studied the operation for decades and had observed underwriting discipline that
was consistent and reserving that was conservative. At merger time, I detected no slippage in Gen Re’s
standards.
I was dead wrong. Gen Re’s culture and practices had substantially changed and unbeknownst to
management – and to me – the company was grossly mispricing its current business. In addition, Gen Re had
accumulated an aggregation of risks that would have been fatal had, say, terrorists detonated several large-
scale nuclear bombs in an attack on the U.S. A disaster of that scope was highly improbable, of course, but it
is up to insurers to limit their risks in a manner that leaves their finances rock-solid if the “impossible”
happens. Indeed, had Gen Re remained independent, the World Trade Center attack alone would have
threatened the company’s existence.
When the WTC disaster occurred, it exposed weaknesses in Gen Re’s operations that I should have
detected earlier. But I was lucky: Joe and Tad were on hand, freshly endowed with increased authority and
eager to rapidly correct the errors of the past. They knew what to do – and they did it.
It takes time for insurance policies to run off, however, and 2002 was well along before we managed
to reduce our aggregation of nuclear, chemical and biological risk (NCB) to a tolerable level. That problem is
now behind us.
On another front, Gen Re’s underwriting attitude has been dramatically altered: The entire
organization now understands that we wish to write only properly-priced business, whatever the effect on
volume. Joe and Tad judge themselves only by Gen Re’s underwriting profitability. Size simply doesn’t
count.
Finally, we are making every effort to get our reserving right. If we fail at that, we can’t know our
true costs. And any insurer that has no idea what its costs are is heading for big trouble.
8
�
At yearend 2001, General Re attempted to reserve adequately for all losses that had occurred prior to
that date and were not yet paid – but we failed badly. Therefore the company’s 2002 underwriting results
were penalized by an additional $1.31 billion that we recorded to correct the estimation mistakes of earlier
years. When I review the reserving errors that have been uncovered at General Re, a line from a country song
seems apt: “I wish I didn’t know now what I didn’t know then.”
I can promise you that our top priority going forward is to avoid inadequate reserving. But I can’t
guarantee success. The natural tendency of most casualty-insurance managers is to underreserve, and they
must have a particular mindset – which, it may surprise you, has nothing to do with actuarial expertise – if
they are to overcome this devastating bias. Additionally, a reinsurer faces far more difficulties in reserving
properly than does a primary insurer. Nevertheless, at Berkshire, we have generally been successful in our
reserving, and we are determined to be at General Re as well.
In summary, I believe General Re is now well positioned to deliver huge amounts of no-cost float to
Berkshire and that its sink-the-ship catastrophe risk has been eliminated. The company still possesses the
important competitive strengths that I’ve outlined in the past. And it gained another highly significant
advantage last year when each of its three largest worldwide competitors, previously rated AAA, was
demoted by at least one rating agency. Among the giants, General Re, rated AAA across-the-board, is now in
a class by itself in respect to financial strength.
No attribute is more important. Recently, in contrast, one of the world’s largest reinsurers – a
company regularly recommended to primary insurers by leading brokers – has all but ceased paying claims,
including those both valid and due. This company owes many billions of dollars to hundreds of primary
insurers who now face massive write-offs. “Cheap” reinsurance is a fool’s bargain: When an insurer lays out
money today in exchange for a reinsurer’s promise to pay a decade or two later, it’s dangerous – and possibly
life-threatening – for the insurer to deal with any but the strongest reinsurer around.
Berkshire shareholders owe Joe and Tad a huge thank you for their accomplishments in 2002. They
worked harder during the year than I would wish for anyone – and it is paying off.
* * * * * * * * * * * *
At GEICO, everything went so well in 2002 that we should pinch ourselves. Growth was
substantial, profits were outstanding, policyholder retention was up and sales productivity jumped
significantly. These trends continue in early 2003.
Thank Tony Nicely for all of this. As anyone who knows him will attest, Tony has been in love with
GEICO for 41 years – ever since he went to work for the company at 18 – and his results reflect this passion.
He is proud of the money we save policyholders – about $1 billion annually versus what other insurers, on
average, would have charged them. He is proud of the service we provide these policyholders: In a key
industry survey, GEICO was recently ranked above all major competitors. He is proud of his 19,162
associates, who last year were awarded profit-sharing payments equal to 19% of their base salary because of
the splendid results they achieved. And he is proud of the growing profits he delivers to Berkshire
shareholders.
GEICO took in $2.9 billion in premiums when Berkshire acquired full ownership in 1996. Last
year, its volume was $6.9 billion, with plenty of growth to come. Particularly promising is the company’s
Internet operation, whose new business grew by 75% last year. Check us out at GEICO.com (or call 800-
847-7536). In most states, shareholders get a special 8% discount.
Here’s one footnote to GEICO’s 2002 earnings that underscores the need for insurers to do business
with only the strongest of reinsurers. In 1981-1983, the managers then running GEICO decided to try their
hand at writing commercial umbrella and product liability insurance. The risks seemed modest: the company
took in only $3,051,000 from this line and used almost all of it – $2,979,000 – to buy reinsurance in order to
limit its losses. GEICO was left with a paltry $72,000 as compensation for the minor portion of the risk that
it retained. But this small bite of the apple was more than enough to make the experience memorable.
GEICO’s losses from this venture now total a breathtaking $94.1 million or about 130,000% of the net
premium it received. Of the total loss, uncollectable receivables from deadbeat reinsurers account for no less
than $90.3 million (including $19 million charged in 2002). So much for “cheap” reinsurance.
* * * * * * * * * * * *
9
�


 2025年软考高级信息系统项目管理师金色考点
 软考高项三色笔记
 镇安县双鑫矿业月河年处理15万吨尾渣综合加工利用项目水土保持报告表
  红杉资本:生成式AI最新市场格局.pdf
 wireshark 使用教程.pdf
 【2021年-贝佐斯致股东的信】.pdf
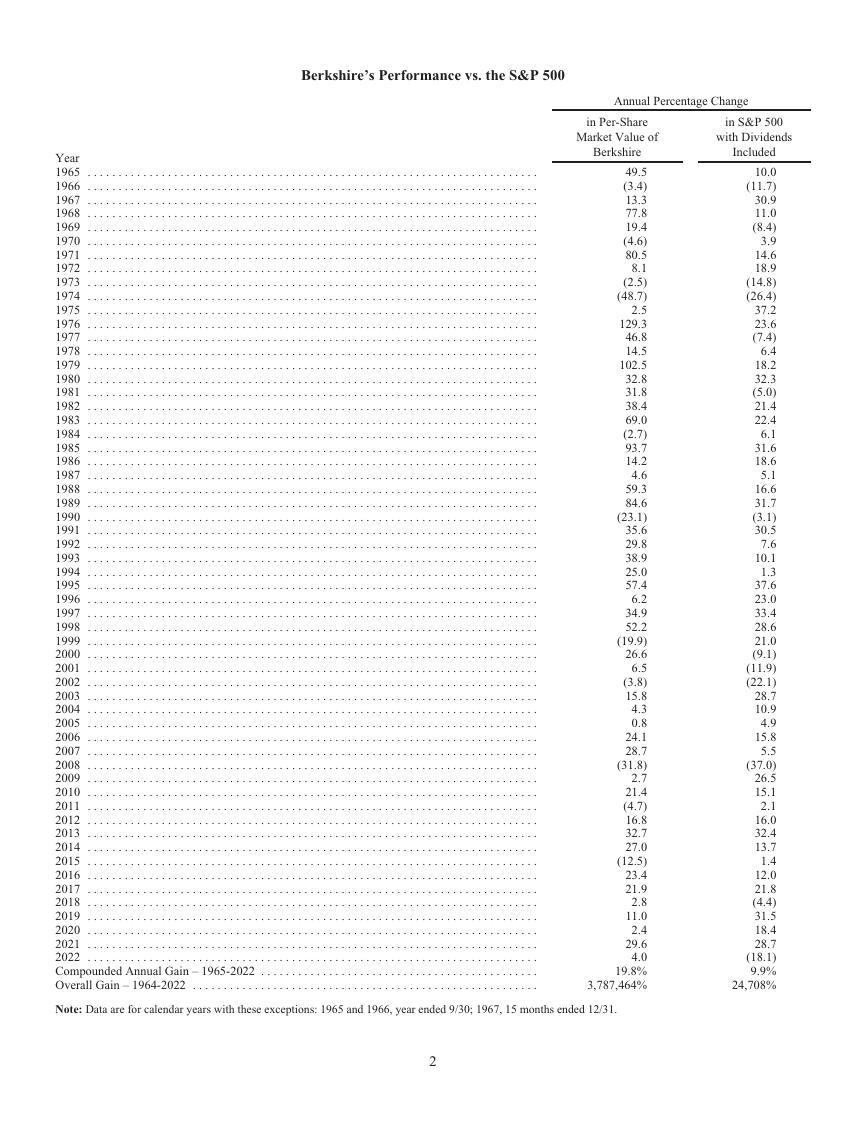 巴菲特致股东的公开信 - 2022.pdf
 MySQL 8.1 参考手册.pdf
 世界银行报告下载:激进政策缩紧浪潮不足遏制通胀 全球经济衰退迫在眉睫(Is a Global Recession Imminent?).pdf
 红杉资本报告:适应与忍耐(Adapting to Endure).pdf
 高保真音响系统设计制作-毕业论文.doc
 一种自适应互补滤波姿态估计算法.pdf