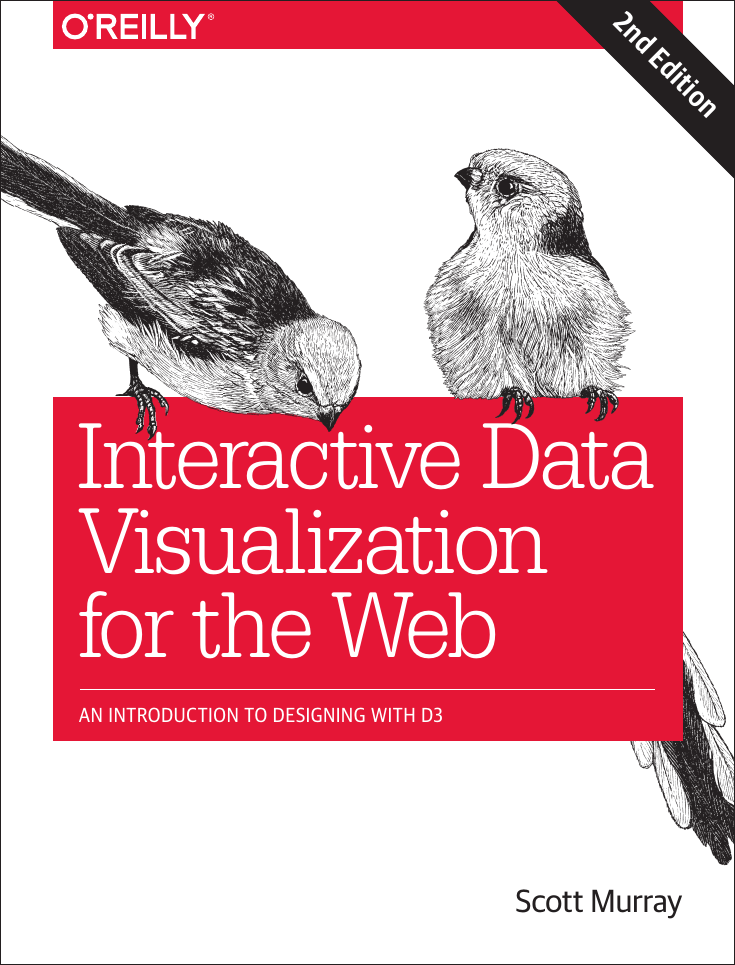
2
n
d E
ditio
n
Interactive Data
Visualization
for the Web
AN INTRODUCTION TO DESIGNING WITH D3
Scott Murray
�
�
Praise for Interactive Data Visualization for the Web
There are few books that I’d call “game-changers.” Interactive Data Visualization for the
Web is one of them. It takes a topic that is obscure and hard to grasp for noncoders, and it
transforms it into a delightful experience—full of clarity, fun, and insight. It’s the book
that I recommend to all of my students to get started with d3.js.
—Alberto Cairo, Knight Chair in Visual Journalism,
University of Miami
Scott Murray is pioneering a new approach to design—combining deep knowledge of
both code and visual principles to create work that is at once extraordinarily beautiful,
highly interactive, and coherently integrated. What’s more, he’s a teacher who generously
shares his knowledge. And now, he’s revised his wonderful book Interactive Data
Visualization for the Web—a foundational text for designers and anyone else
dealing with the coming onrush of data.
—Hugh Dubberly, Principal, Dubberly Design Office
We have been using Scott’s book in our CS171 Visualization course at Harvard for the
past three years. It is, by far, the most comprehensive and best introduction to D3 out
there. The tone of the book is conversational, and it is easily accessible by nonexperts and
beginners. Our students like it, and I believe they benefit from having
the materials presented in the order that Scott came up with.
We are definitely looking forward to the next edition!
—Hanspeter Pfister, An Wang Professor of Computer Science,
Harvard University
�
The first edition has simply been the most complete, effective, single source for learning
D3 and visualization on the web from scratch. I have recommended it countless times.
—Erik Cunningham, Software Engineer, Twitter
I can’t think of a better way to understand D3. It’s funny and engaging for a
nonprogrammer, deep and detailed for an engineer, and filled with practical
and visual bliss for the designer.
—Xaquín G.V., Visual Storyteller, formerly the Guardian,
The New York Times, and National Geographic
Scott Murray is the master of making technical instruction entertaining and fun.
I wish more books were written like this.
—Riley Rustad, Demand Planning—Data and Analytics, Adidas
Interactive Data Visualization for the Web, based on Scott’s outstanding online tutorials,
remains the clearest and most accessible introduction to D3. It’s even moderately funny.
—Kevin Quealy, Graphics Editor, The New York Times
I recommended the first edition to countless people, technical and nontechnical alike.
Scott’s ability to articulate key concepts concisely to a broad audience, without
oversimplifying, is unparalleled and refreshingly jargon-free. The first go-to book in the
canon of web-based data visualization? Definitely.
—Tom Longmate, Freelance Design Technologist
I have a bookshelf behind my desk full of reference books; but Scott Murray’s book is
never on that shelf, because it’s constantly on my desk.
—Gail Zuniga, Information Designer
I. Love. This. Book. In classes, bootcamps, and tutorials, I’ve worked hard to learn
JavaScript in many ways. Nothing has been clearer or easier to work with than this book.
I understand D3 and JavaScript better than ever before.
—Wesley Ratko, Geospatial Data Analyst
The most accessible introduction to d3 so far—invaluable for teaching purposes.
—Alan Smith, Data Visualization Editor, Financial Times
�
I learned the basics of D3 from Scott Murray’s book, which offers clear and fun guidance.
I have since been recommending it to all my design students.
Scott makes the process of learning D3 both pleasant and effective.
—Isabel Meirelles, Professor, OCAD University
This book is the definitive guide to D3. I use this book for every data visualization class
that I teach at USF. Students love the comprehensive coverage of the material
as well as the detailed examples.
—Alark Joshi, Associate Professor of Computer Science,
University of San Francisco
D3 is only easy if you learn it in the right order. Scott is a talented teacher and knows how
to progressively go from the very beginning to a deep understanding of the fundamental
concepts. There are many excellent books around, but this one is the place to start.
—Christophe Viau, Data Visualization Engineer
Scott Murray’s book is probably the most iconic book out there. It was the perfect starting
point on my journey up the steep learning curve. Scott doesn’t push or drag you up that
curve, he walks alongside and explains each step in an intelligible and—most important
for the big-eyed novice—friendly way.
—Lars Verspohl, Data Visualization Designer and Developer,
datamake
D3 has a unique data model which makes it very expressive and powerful, but it can be
difficult to learn if you’re coming to it from other JavaScript libraries or visualization
tools. Scott Murray’s book patiently yet efficiently walks the reader through examples that
establish a firm understanding of the fundamentals of D3. I continue to recommend
Scott’s book to colleagues four years after its introduction.
I know of no better way to learn D3.
—Andrew Brown, Data Scientist, SiteZeus
This book was the starting point for my career in data visualization. Based upon the
foundations I got from working through all the examples I have gotten multiple jobs and
had my work reach millions of people. Anytime someone asks
for an introduction to D3, I point them here.
—Nick Strayer, PhD Student, Data-Journalist, Vanderbilt
University, formerly The New York Times
�
A clear, concise, and approachable book on how D3 syntax and structures work. Because
it builds on a foundation of understanding the fundamentals, it has become an essential
reference in my library that I continue to use.
—Cindy Hoffman, Design Editor, Bloomberg Graphics
This book is required reading for all my introductory data vis classes.
The friendliest and most accessible introduction to D3 around!
—Lynn Cherny, Associate Professor, Emlyon Business School
This book explains D3 concepts better than any other resource out there. The examples
are easy to follow and clearly written. I have recommended it to dozens of people who
were looking to get started with D3 because it’s the best way I know of to learn the basics.
—Joe Fox, Graphics and Data Journalist, Los Angeles Times
In a world of truly terrible tech books, one man, equipped only with a strong verbal
acumen and a charming sense of humor, stands apart. That man is Scott Murray,
and his book is Interactive Data Visualization for the Web.
—Wendy Dherin, Software Engineer, Credit Karma
I came to D3 without a background in JavaScript, and this book was one of my guiding
lights. It builds carefully and logically, giving a solid introduction to both D3 and
interactive visualization as a field.
—Daniel Walter, Data Scientist, Distil Networks
When I was first learning D3, I turned to this amazing book and never needed to look
anywhere else. It is comprehensive and approachable, making for a great resource for
both beginners and experts needing a quick reference. It is always my first response when
somebody asks for instructional material on learning D3. I can’t recommend it enough!
—Peter Beshai, Data Visualization Engineer
As a data scientist working in the social sector, I need tools I can put to use in the field
quickly and meaningfully. I wanted to create interactive data visuals for use in my work,
but I couldn’t figure out how to make them. Then I found Scott Murray and his amazing
book on designing with D3. Within three days I had fully functional D3 pieces up online
with no tears. After several months of working through his in-depth examples I could
provide professional D3 products to my clients. His approach to teaching is intuitive,
practical, and user-friendly. The examples are great, and he teaches you enough
competencies that you can quickly broaden the standard recipes into custom designs.
�
—Heather Krause, Data Scientist, Datassist
This is the first book on D3 that I tell my students to read when they ask me for an
introductory guide to D3. I even recommend it more highly than the official D3
documentation and tutorials. I especially like how Scott breaks down complex chains of
D3 expressions into their constituent parts and explains each component in detail.
—Philip Guo, Assistant Professor of Cognitive Science,
UC San Diego
I can still remember the first time I read Interactive Data Visualization for the Web. The
next time I’ll read it will be on a remote island. The book’s wisdom will guide me through
hardship, and Scott’s witty humor will help me crack that coconut—it’s that useful!
—Maarten Vanhoof, Researcher, Open Lab,
Newcastle University
This book builds up the concepts in a brilliantly logical and simple way,
but also engaged me with moments of comedic gold.
—Rowan Cumming, Financial Services Senior Analyst
If D3 were a rollercoaster, Scott Murray’s Interactive Data Visualization for the Web
would be the chain lift—that slow and inevitable upward ratcheting that takes you to the
first and most exciting precipice—before the inevitable drop into madness.
—Jim Vallandingham, Data Visualization Engineer
I don’t use D3, but if I did, this is where I would start.
—Nicholas Felton, Information Designer, Feltron
�
�





 2023年江西萍乡中考道德与法治真题及答案.doc
 2012年重庆南川中考生物真题及答案.doc
 2013年江西师范大学地理学综合及文艺理论基础考研真题.doc
 2020年四川甘孜小升初语文真题及答案I卷.doc
 2020年注册岩土工程师专业基础考试真题及答案.doc
 2023-2024学年福建省厦门市九年级上学期数学月考试题及答案.doc
 2021-2022学年辽宁省沈阳市大东区九年级上学期语文期末试题及答案.doc
 2022-2023学年北京东城区初三第一学期物理期末试卷及答案.doc
 2018上半年江西教师资格初中地理学科知识与教学能力真题及答案.doc
 2012年河北国家公务员申论考试真题及答案-省级.doc
 2020-2021学年江苏省扬州市江都区邵樊片九年级上学期数学第一次质量检测试题及答案.doc
 2022下半年黑龙江教师资格证中学综合素质真题及答案.doc