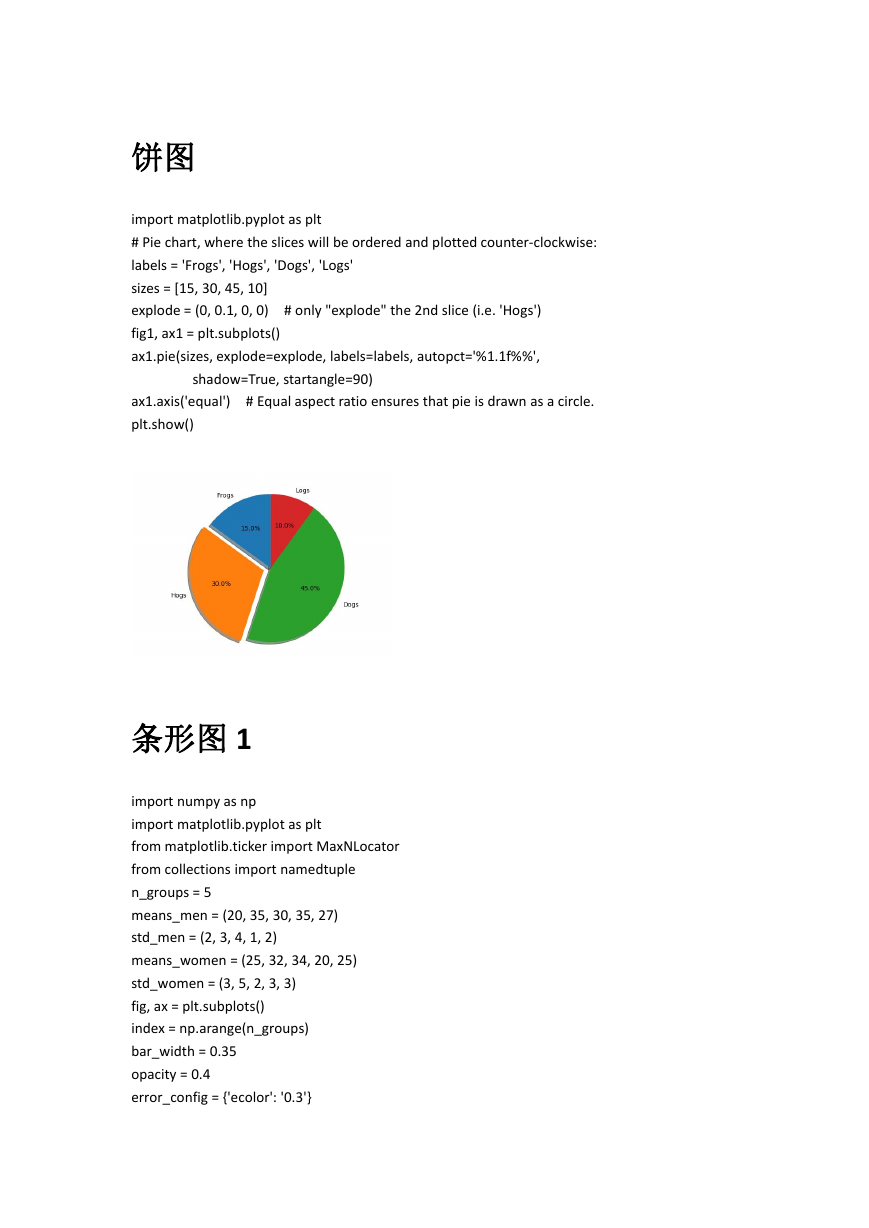
饼图
import matplotlib.pyplot as plt
# Pie chart, where the slices will be ordered and plotted counter-clockwise:
labels = 'Frogs', 'Hogs', 'Dogs', 'Logs'
sizes = [15, 30, 45, 10]
explode = (0, 0.1, 0, 0)
fig1, ax1 = plt.subplots()
ax1.pie(sizes, explode=explode, labels=labels, autopct='%1.1f%%',
# only "explode" the 2nd slice (i.e. 'Hogs')
shadow=True, startangle=90)
ax1.axis('equal')
plt.show()
# Equal aspect ratio ensures that pie is drawn as a circle.
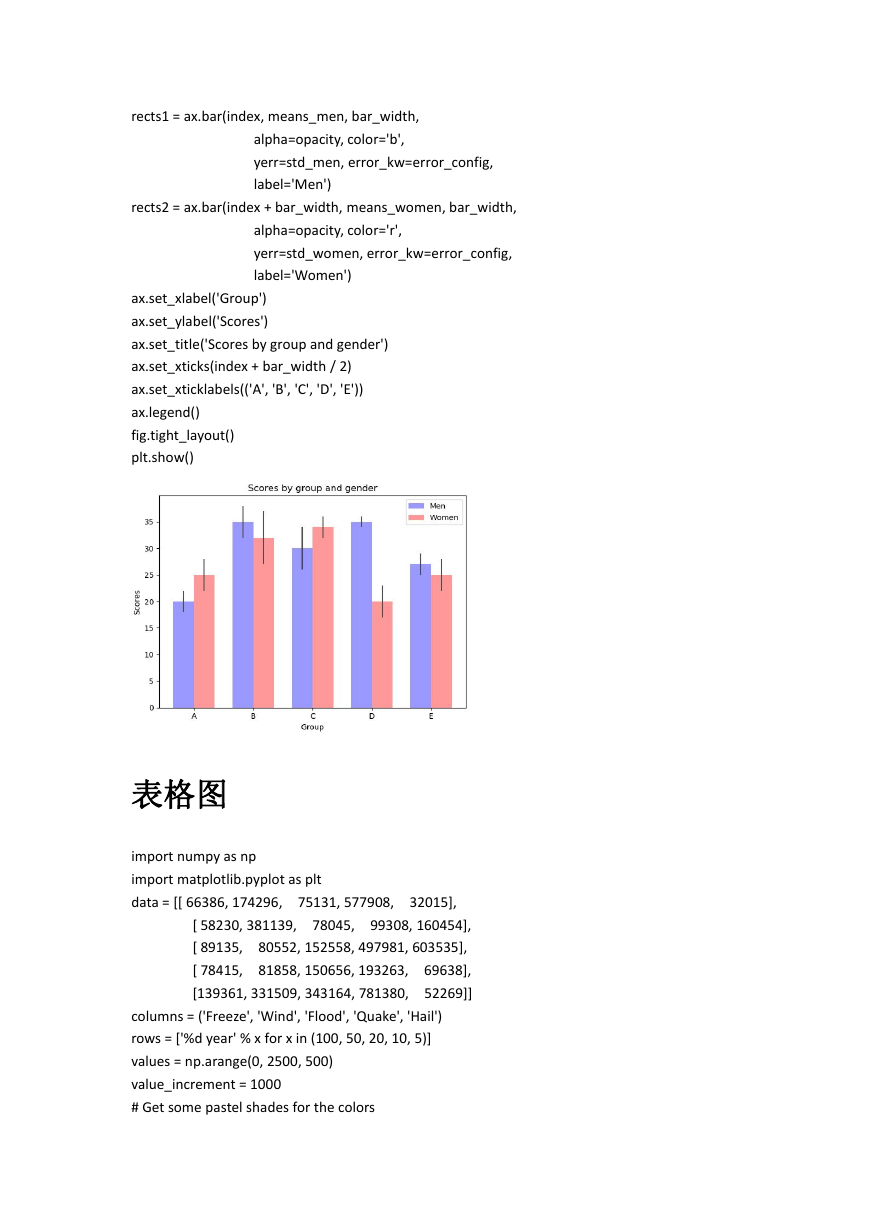
条形图 1
import numpy as np
import matplotlib.pyplot as plt
from matplotlib.ticker import MaxNLocator
from collections import namedtuple
n_groups = 5
means_men = (20, 35, 30, 35, 27)
std_men = (2, 3, 4, 1, 2)
means_women = (25, 32, 34, 20, 25)
std_women = (3, 5, 2, 3, 3)
fig, ax = plt.subplots()
index = np.arange(n_groups)
bar_width = 0.35
opacity = 0.4
error_config = {'ecolor': '0.3'}
�
rects1 = ax.bar(index, means_men, bar_width,
alpha=opacity, color='b',
yerr=std_men, error_kw=error_config,
label='Men')
rects2 = ax.bar(index + bar_width, means_women, bar_width,
alpha=opacity, color='r',
yerr=std_women, error_kw=error_config,
label='Women')
ax.set_xlabel('Group')
ax.set_ylabel('Scores')
ax.set_title('Scores by group and gender')
ax.set_xticks(index + bar_width / 2)
ax.set_xticklabels(('A', 'B', 'C', 'D', 'E'))
ax.legend()
fig.tight_layout()
plt.show()
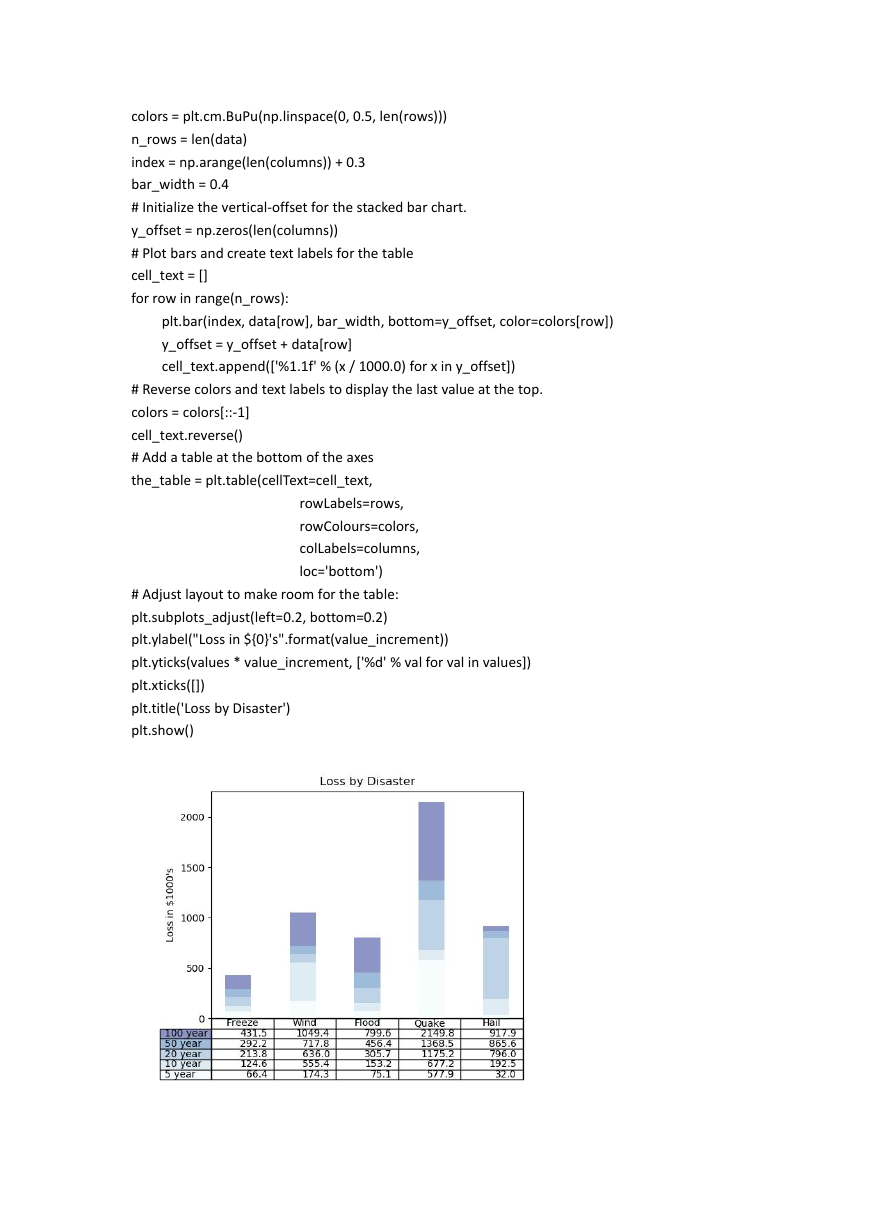
表格图
import numpy as np
import matplotlib.pyplot as plt
data = [[ 66386, 174296, 75131, 577908,
32015],
78045,
99308, 160454],
[ 58230, 381139,
80552, 152558, 497981, 603535],
[ 89135,
69638],
[ 78415,
81858, 150656, 193263,
[139361, 331509, 343164, 781380,
52269]]
columns = ('Freeze', 'Wind', 'Flood', 'Quake', 'Hail')
rows = ['%d year' % x for x in (100, 50, 20, 10, 5)]
values = np.arange(0, 2500, 500)
value_increment = 1000
# Get some pastel shades for the colors
�
colors = plt.cm.BuPu(np.linspace(0, 0.5, len(rows)))
n_rows = len(data)
index = np.arange(len(columns)) + 0.3
bar_width = 0.4
# Initialize the vertical-offset for the stacked bar chart.
y_offset = np.zeros(len(columns))
# Plot bars and create text labels for the table
cell_text = []
for row in range(n_rows):
plt.bar(index, data[row], bar_width, bottom=y_offset, color=colors[row])
y_offset = y_offset + data[row]
cell_text.append(['%1.1f' % (x / 1000.0) for x in y_offset])
# Reverse colors and text labels to display the last value at the top.
colors = colors[::-1]
cell_text.reverse()
# Add a table at the bottom of the axes
the_table = plt.table(cellText=cell_text,
rowLabels=rows,
rowColours=colors,
colLabels=columns,
loc='bottom')
# Adjust layout to make room for the table:
plt.subplots_adjust(left=0.2, bottom=0.2)
plt.ylabel("Loss in ${0}'s".format(value_increment))
plt.yticks(values * value_increment, ['%d' % val for val in values])
plt.xticks([])
plt.title('Loss by Disaster')
plt.show()
�
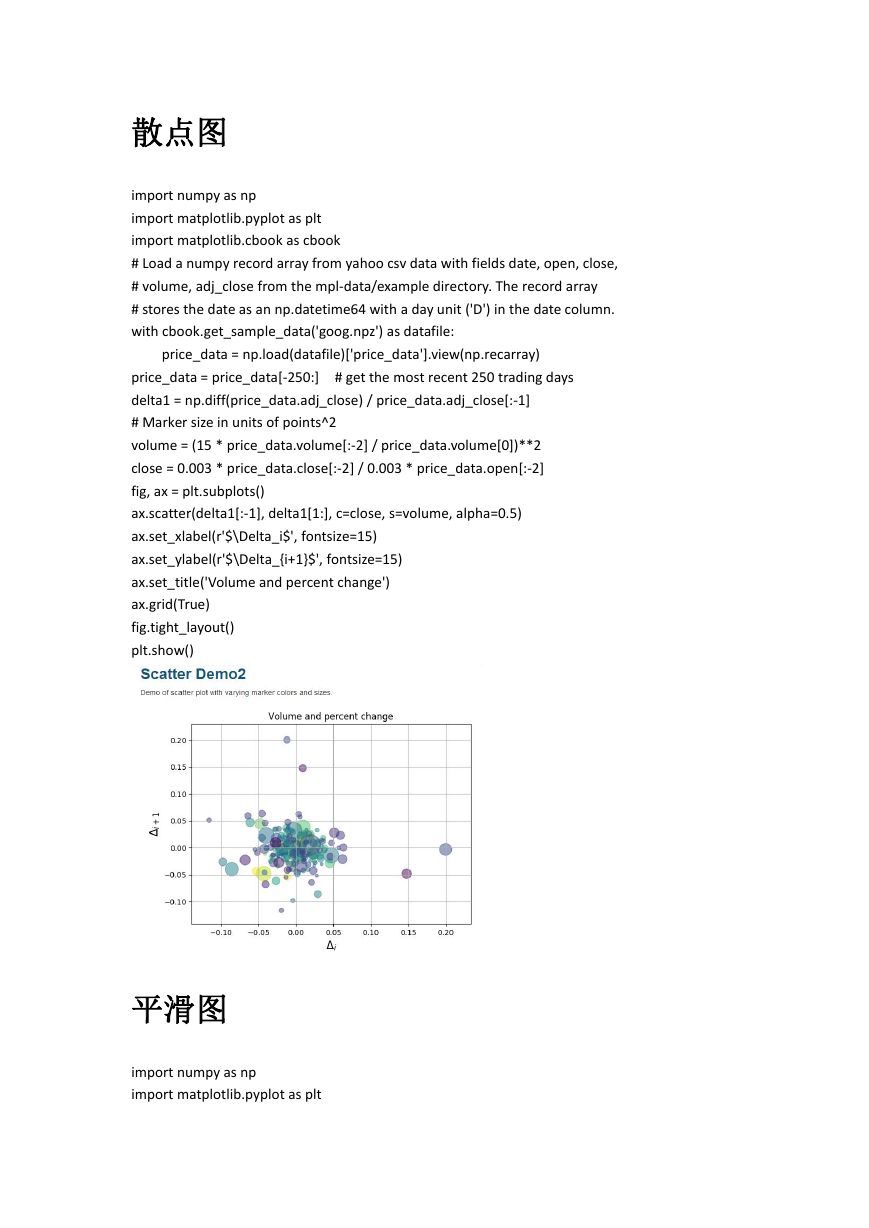
散点图
import numpy as np
import matplotlib.pyplot as plt
import matplotlib.cbook as cbook
# Load a numpy record array from yahoo csv data with fields date, open, close,
# volume, adj_close from the mpl-data/example directory. The record array
# stores the date as an np.datetime64 with a day unit ('D') in the date column.
with cbook.get_sample_data('goog.npz') as datafile:
price_data = np.load(datafile)['price_data'].view(np.recarray)
# get the most recent 250 trading days
price_data = price_data[-250:]
delta1 = np.diff(price_data.adj_close) / price_data.adj_close[:-1]
# Marker size in units of points^2
volume = (15 * price_data.volume[:-2] / price_data.volume[0])**2
close = 0.003 * price_data.close[:-2] / 0.003 * price_data.open[:-2]
fig, ax = plt.subplots()
ax.scatter(delta1[:-1], delta1[1:], c=close, s=volume, alpha=0.5)
ax.set_xlabel(r'$\Delta_i$', fontsize=15)
ax.set_ylabel(r'$\Delta_{i+1}$', fontsize=15)
ax.set_title('Volume and percent change')
ax.grid(True)
fig.tight_layout()
plt.show()
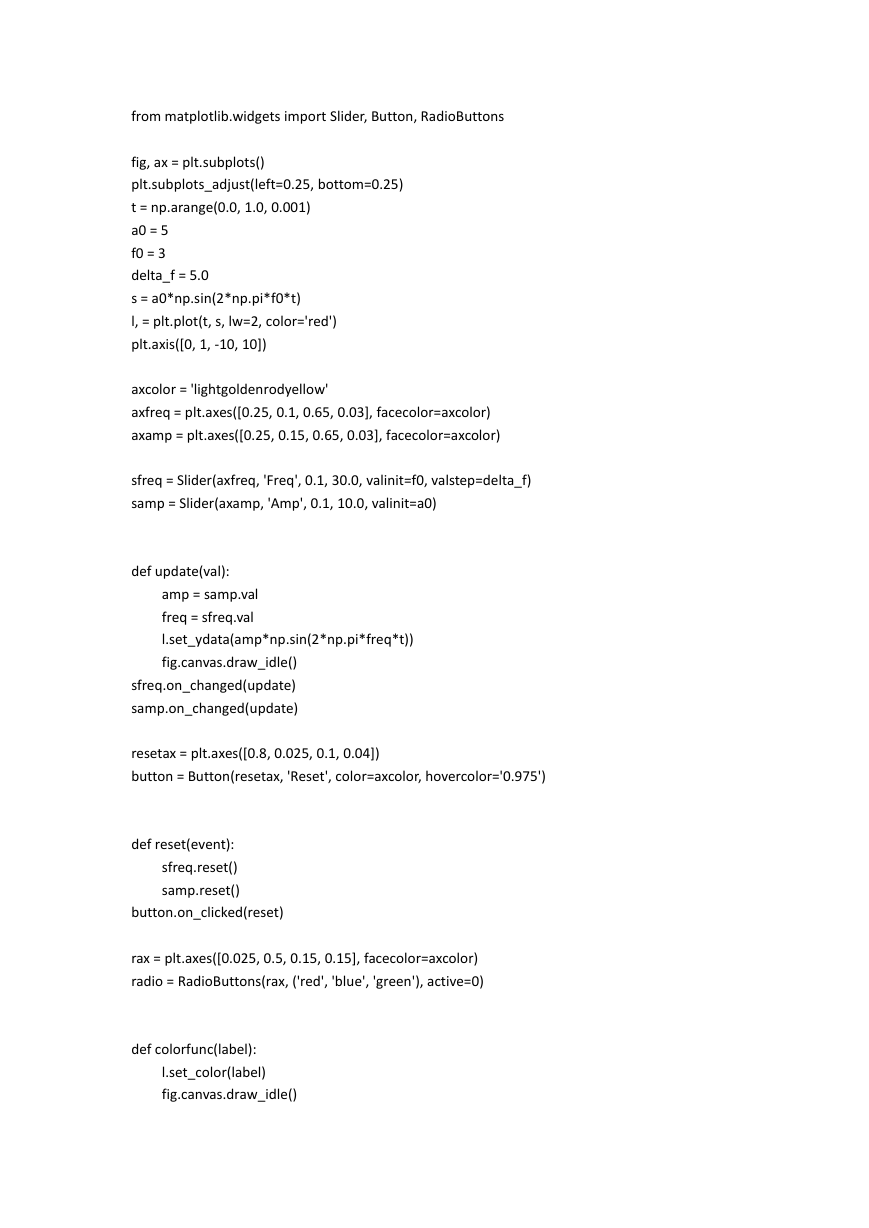
平滑图
import numpy as np
import matplotlib.pyplot as plt
�
from matplotlib.widgets import Slider, Button, RadioButtons
fig, ax = plt.subplots()
plt.subplots_adjust(left=0.25, bottom=0.25)
t = np.arange(0.0, 1.0, 0.001)
a0 = 5
f0 = 3
delta_f = 5.0
s = a0*np.sin(2*np.pi*f0*t)
l, = plt.plot(t, s, lw=2, color='red')
plt.axis([0, 1, -10, 10])
axcolor = 'lightgoldenrodyellow'
axfreq = plt.axes([0.25, 0.1, 0.65, 0.03], facecolor=axcolor)
axamp = plt.axes([0.25, 0.15, 0.65, 0.03], facecolor=axcolor)
sfreq = Slider(axfreq, 'Freq', 0.1, 30.0, valinit=f0, valstep=delta_f)
samp = Slider(axamp, 'Amp', 0.1, 10.0, valinit=a0)
def update(val):
amp = samp.val
freq = sfreq.val
l.set_ydata(amp*np.sin(2*np.pi*freq*t))
fig.canvas.draw_idle()
sfreq.on_changed(update)
samp.on_changed(update)
resetax = plt.axes([0.8, 0.025, 0.1, 0.04])
button = Button(resetax, 'Reset', color=axcolor, hovercolor='0.975')
def reset(event):
sfreq.reset()
samp.reset()
button.on_clicked(reset)
rax = plt.axes([0.025, 0.5, 0.15, 0.15], facecolor=axcolor)
radio = RadioButtons(rax, ('red', 'blue', 'green'), active=0)
def colorfunc(label):
l.set_color(label)
fig.canvas.draw_idle()
�
radio.on_clicked(colorfunc)
plt.show()
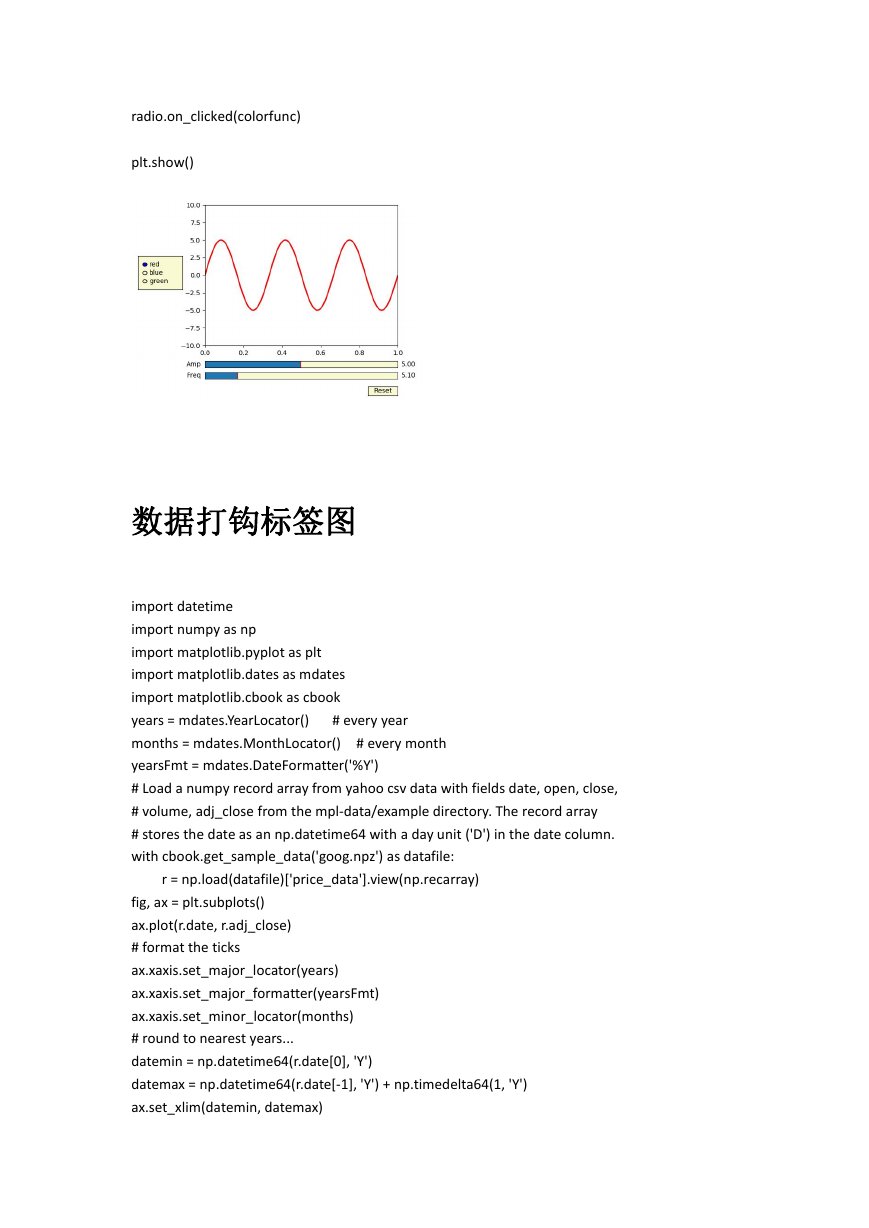
数据打钩标签图
import datetime
import numpy as np
import matplotlib.pyplot as plt
import matplotlib.dates as mdates
import matplotlib.cbook as cbook
years = mdates.YearLocator()
months = mdates.MonthLocator()
yearsFmt = mdates.DateFormatter('%Y')
# Load a numpy record array from yahoo csv data with fields date, open, close,
# volume, adj_close from the mpl-data/example directory. The record array
# stores the date as an np.datetime64 with a day unit ('D') in the date column.
with cbook.get_sample_data('goog.npz') as datafile:
# every month
# every year
r = np.load(datafile)['price_data'].view(np.recarray)
fig, ax = plt.subplots()
ax.plot(r.date, r.adj_close)
# format the ticks
ax.xaxis.set_major_locator(years)
ax.xaxis.set_major_formatter(yearsFmt)
ax.xaxis.set_minor_locator(months)
# round to nearest years...
datemin = np.datetime64(r.date[0], 'Y')
datemax = np.datetime64(r.date[-1], 'Y') + np.timedelta64(1, 'Y')
ax.set_xlim(datemin, datemax)
�
# format the coords message box
def price(x):
return '$%1.2f' % x
ax.format_xdata = mdates.DateFormatter('%Y-%m-%d')
ax.format_ydata = price
ax.grid(True)
# rotates and right aligns the x labels, and moves the bottom of the
# axes up to make room for them
fig.autofmt_xdate()
plt.show()
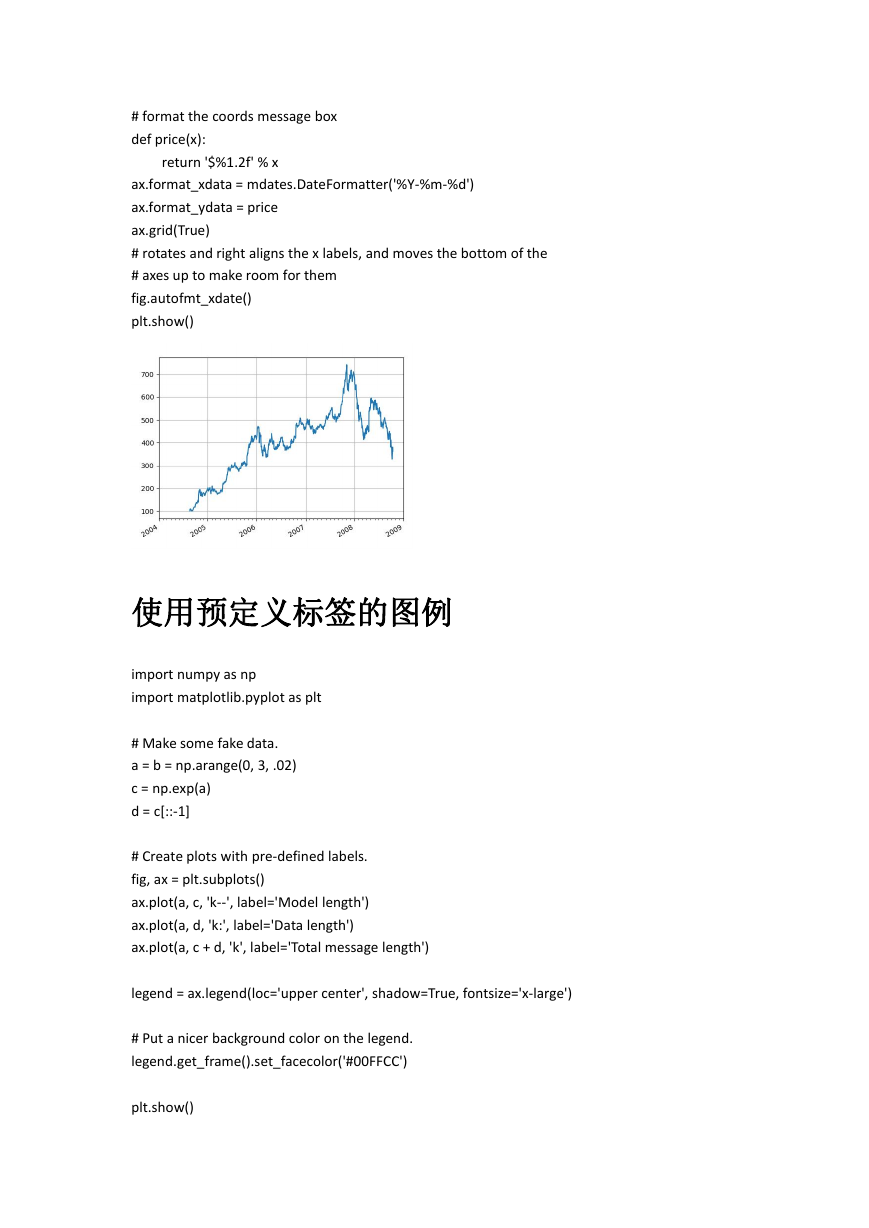
使用预定义标签的图例
import numpy as np
import matplotlib.pyplot as plt
# Make some fake data.
a = b = np.arange(0, 3, .02)
c = np.exp(a)
d = c[::-1]
# Create plots with pre-defined labels.
fig, ax = plt.subplots()
ax.plot(a, c, 'k--', label='Model length')
ax.plot(a, d, 'k:', label='Data length')
ax.plot(a, c + d, 'k', label='Total message length')
legend = ax.legend(loc='upper center', shadow=True, fontsize='x-large')
# Put a nicer background color on the legend.
legend.get_frame().set_facecolor('#00FFCC')
plt.show()
�
数学公式编辑图
from __future__ import print_function
import matplotlib.pyplot as plt
import subprocess
import sys
import re
import gc
# Selection of features following "Writing mathematical expressions" tutorial
mathtext_titles = {
0: "Header demo",
1: "Subscripts and superscripts",
2: "Fractions, binomials and stacked numbers",
3: "Radicals",
4: "Fonts",
5: "Accents",
6: "Greek, Hebrew",
7: "Delimiters, functions and Symbols"}
n_lines = len(mathtext_titles)
# Randomly picked examples
mathext_demos = {
0: r"$W^{3\beta}_{\delta_1 \rho_1 \sigma_2} = "
r"U^{3\beta}_{\delta_1 \rho_1} + \frac{1}{8 \pi 2} "
r"\int^{\alpha_2}_{\alpha_2} d \alpha^\prime_2 \left[\frac{ "
r"U^{2\beta}_{\delta_1 \rho_1} - \alpha^\prime_2U^{1\beta}_"
r"{\rho_1 \sigma_2} }{U^{0\beta}_{\rho_1 \sigma_2}}\right]$",
�


 2023年江西萍乡中考道德与法治真题及答案.doc
 2012年重庆南川中考生物真题及答案.doc
 2013年江西师范大学地理学综合及文艺理论基础考研真题.doc
 2020年四川甘孜小升初语文真题及答案I卷.doc
 2020年注册岩土工程师专业基础考试真题及答案.doc
 2023-2024学年福建省厦门市九年级上学期数学月考试题及答案.doc
 2021-2022学年辽宁省沈阳市大东区九年级上学期语文期末试题及答案.doc
 2022-2023学年北京东城区初三第一学期物理期末试卷及答案.doc
 2018上半年江西教师资格初中地理学科知识与教学能力真题及答案.doc
 2012年河北国家公务员申论考试真题及答案-省级.doc
 2020-2021学年江苏省扬州市江都区邵樊片九年级上学期数学第一次质量检测试题及答案.doc
 2022下半年黑龙江教师资格证中学综合素质真题及答案.doc