Growing Like China∗
Zheng Song
Fudan University and Chinese University of Hong Kong
Kjetil Storesletten
Federal Reserve Bank of Minneapolis and CEPR
Fabrizio Zilibotti
University of Zurich and CEPR
November 2009 (First version: March 2008)
Abstract
This paper constructs a growth model that is consistent with salient features of
the recent Chinese growth experience: high output growth, sustained returns on
capital investment, extensive reallocation within the manufacturing sector, falling
labor share and accumulation of a large foreign surplus. The building blocks of
the theory are asymmetric financial imperfections and heterogeneous productivity.
Some firms use more productive technologies, but low-productivity firms survive
because of better access to credit markets. Due to the financial imperfections,
high-productivity firms — which are run by entrepreneurs — must be financed out
of internal savings. If these savings are sufficiently large, the high-productivity
firms outgrow the low-productivity firms and attract an increasing employment
share. The downsizing of the financially integrated firms forces a growing share
of domestic savings to be invested in foreign assets, generating a foreign surplus.
A calibrated version of the theory can account quantitatively for China’s growth
experience during 1992-2007.
JEL Codes. F43, G21, O16, O47, O53, P23, P31.
∗We thank the editor, two referees and seminar participants at Columbia University, CREi, China
Economics Summer Institute 2009, Chinese University of Hong Kong, EEA Annual Congress 2009,
Federal Reserve of St.Louis, IIES, London Business School, London School of Economics (conference
"The Emergence of China & India in the Global Economy", July 3—5 2008), Minnesota Workshop in
Macroeconomic Theory, MIT, Normac, SED Annual Meeting, Tsinghua Workshop in Macroeconomics,
Universitat Autonoma, Università Bocconi, Università Cà Foscari Venice, University of Cambridge,
University of Oslo, University of Rochester, University of St. Gallen, University of Zurich, WISE and
Yale University for comments. Financial support from the European Research Council (ERC Advanced
Grant IPCDP-229883) and from the Research Council of Norway (162851, 179522 ESOP, and 183522)
is gratefully acknowledged. Any views expressed here are those of the authors and not those of the
Federal Reserve Bank of Minneapolis or the Federal Reserve System.
�
1 Introduction
Over the last thirty years, China has undergone a spectacular economic transformation
involving not only fast economic growth and sustained capital accumulation, but also
major shifts in the sectoral composition of output, increased urbanization and a growing
importance of markets and entrepreneurial skills. Reallocation of labor and capital across
manufacturing firms has been a key source of productivity growth. The rate of return
on investment has remained well above 20%, higher than in most industrialized and
developing economies. If investment rates have been high, saving rates have been even
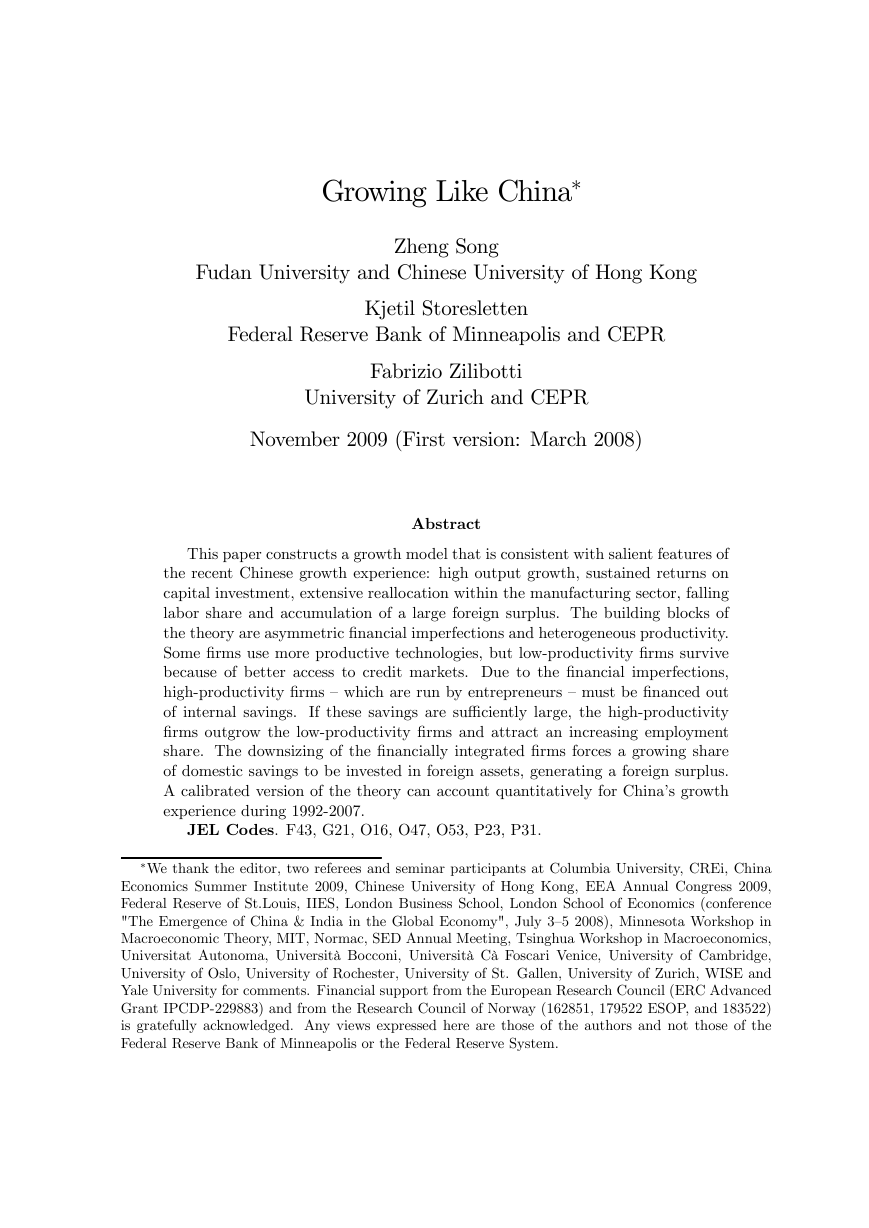
higher: in the last fifteen years, China has experienced a growing net foreign surplus:
its foreign reserves swelled from 21 billion USD in 1992 (5% of its annual GDP) to 2,130
billion USD in June 2009 (46% of its GDP); see Figure 1.
FIGURE 1 HERE
The combination of high growth and high return to capital, on the one hand, and a
growing foreign surplus, on the other hand, is puzzling. A closed-economy neoclassical
growth model predicts that the high investment rate would lead to a fall in the return
to capital. An open-economy model predicts a large net capital inflow rather than an
outflow, owing to the high domestic return to capital.
In this paper, we propose a
theory of economic transition that solves this puzzle while being consistent with salient
qualitative and quantitative features of the Chinese experience. The focal points of
the theory are financial frictions and firms’ reallocation of resources across firms. In
our theory, both the sustained return to capital and the foreign surplus arise from
the reallocation of capital and labor from less productive externally financed firms to
entrepreneurial firms that are more productive, but have less access to external financing.
As financially integrated firms shrink, a larger proportion of the domestic savings is
invested in foreign assets. Thus, the combination of high growth and high investment is
consistent with the accumulation of a foreign surplus.
Our paper is part of a recent literature arguing that low aggregate total factor pro-
ductivity (TFP) — especially in developing countries — is the result of micro-level resource
misallocation (see Parente et al., 2000; Caselli and Coleman, 2002; Banerjee and Duflo,
2005; Restuccia and Rogerson, 2008; Gancia and Zilibotti, 2009; and Hsieh and Klenow,
1
�
2009). While pockets of efficient firms using state-of-the-art technologies may exist, these
firms fail to attract the large share of productive resources that efficiency would dictate,
due to financial frictions and other imperfections. Most existing literature emphasizes
the effects of resource misallocation on average productivity.
In contrast, our paper
argues that when a country starts from a situation of severe inefficiency, but manages
to ignite the engine of reallocation, it has the potential to grow fast over a prolonged
transition, since efficient firms can count on a highly elastic supply of factors attracted
from the less productive firms.
To analyze such a transition, we construct a model in which firms are heterogeneous
in productivity and access to financial markets. High-productivity firms are operated by
agents with entrepreneurial skills who are financially constrained and who must rely on
retained earnings to finance their investments. Low-productivity firms can survive due
to their better access to credit markets, since the growth potential of high-productivity
firms is limited by the extent of entrepreneurial savings. If the saving flow is sufficiently
large, high-productivity firms outgrow low-productivity ones, progressively driving them
out of the market. During the transition, the dynamic equilibrium has AK features:
within each type of firms, the rate of return to capital is constant due to labor mobility
and to the financial integration of the low-productivity firms. Due to a composition
effect, the aggregate rate of return to capital actually increases. Moreover, the economy
accumulates a foreign surplus. While investments in the expanding firms are financed
by the retained earnings of entrepreneurs, wage earners deposit their savings with inter-
mediaries who can invest them in loans to domestic firms and in foreign bonds. As the
demand for funds from financially integrated domestic firms declines, a growing share
of the intermediated funds must be invested abroad, building a growing foreign surplus.
This prediction is consistent with the observation that the difference between deposits
and domestic bank loans has been growing substantially, tracking China’s accumulation
of foreign reserves (see again Figure 1). After the transition, the economy behaves as
in a standard neoclassical model, where capital accumulation is subject to decreasing
returns.
Reallocation within the manufacturing sector — the driving force in our model — has
been shown to be an important source of productivity growth in China. In an influ-
ential paper, Hsieh and Klenow (2009) estimate that reallocation across manufacturing
firms with different productivity accounted for an annual 2 percentage point increase in
aggregate TFP during 1998—2005. Brandt et al. (2009) estimate that between 42% and
67% of the aggregate TFP growth in Chinese manufacturing was due to productivity
2
�
differences between entering and exiting firms during 1998-2005.
Our theory yields several additional predictions consistent with the evidence of
China’s transition.
1. The theory predicts that the surplus — savings minus investment — should increase
with the share of entrepreneurial firms.
Consistent with this prediction, we find that the net surplus is significantly higher
in Chinese provinces in which the employment share of domestic private firms has
increased faster.
2. In our basic, benchmark model, all firms produce the same good and differ only
in TFP. We extend the theory to a two-sector model in which firms can specialize
in the production of more or less capital-intensive goods. This extended model
predicts that financially constrained firms with high TFP will specialize in labor-
intensive activities (even though they have no technological comparative advan-
tage). Thus, the transition proceeds in stages: first low-productivity firms retreat
into capital-intensive industries, and then they gradually vanish. This is consis-
tent with the observed dynamics of sectoral reallocation in China, where young
high-productivity private firms have entered extensively in labor-intensive sectors,
while old state-owned firms continue to dominate capital-intensive industries.
The theory is related to the seminal contribution of Lewis (1954), who constructs
a model of reallocation from agriculture to industry where the supply of labor in man-
ufacturing is unlimited due to structural overemployment in agriculture. While his
mechanism is similar in some respects to ours, productivity increases in his model rely
on some form of hidden unemployment in the traditional sector. Lewis’ theory captures
aspects of the reallocation between rural and urban areas in China, while our focus is
on the reallocation within the industrial sector. Our paper is also related to Ventura
(1997), who shows that in economies engaging in external trade, capital accumulation is
not subject to diminishing returns because resources are moved from labor-intensive to
capital-intensive sectors. Ventura’s model does not assume any initial inefficiency, nor
does it imply that TFP should grow within each industry — a key implication of our
theory.1
1In this respect, our work is related to the seminal papers of Kuznets (1966) and Chenery and
Syrquin (1975), who study soruces of productivity growth during economic transitions.
3
�
Neither Lewis’ nor Ventura’s theory has any implication regarding trade imbalances.
Matsuyama (2004 and 2005) shows that financial frictions may induce trading economies
to specialize in industries in which they do not have a technological comparative advan-
tage. See also the work of Antras and Caballero (2009). In our model, by a similar
mechanism, less efficient firms can survive and even outgrow more productive ones. Our
two-sector extension also predicts that financial constraints generate specialization in
spite of the lack of any technological comparative advantage, though the mechanism is
different.
Gourinchas and Jeanne (2007) document that it is common to observe capital outflow
from fast-growing developing economies with high marginal product of capital. As in the
case of China, countries with fast TFP growth tend to have both large capital outflows
and large investment rates, while the opposite is true for slow-growing countries. They
label this finding the "allocation puzzle". Our theory can provide a rationale to this
observation. In a related paper, Buera and Shin (2009) focus on the current account
surpluses experienced by a number of Asian economies in the 1980s (with the notable
exception of China, which experienced current account deficits during the 1980s). Buera
and Shin argue — as we do — that financial frictions can contribute to the explanation of
this puzzle. While in our paper the foreign surplus is driven by the dwindling demand for
domestic borrowing, due to the declining financially integrated firms, they emphasize
increased domestic savings by agents who are planning to become entrepreneurs but
need to save to finance start-up costs.
A few recent papers address the more specific question of why China is accumulating
a large foreign surplus. Most papers emphasize the country’s high saving rate. Kuijs
(2005) shows that household and enterprise saving rates in China are, respectively, 11.8
and 8.6 percentage points higher than those in the United States. Demography, an
imperfect financial sector, and the lack of welfare and pension benefits are among the
factors proposed as explanations for this (e.g. Kraay, 2000). However, it remains unclear
why domestic savings are not invested domestically given the high rate of return to
capital in China. Mendoza et al. (2009) argue that this may be explained by differences
in financial development inducing savers in emerging economies to seek insurance in
safe US bonds (see also Caballero et al., 2008, and Sandri, 2009). Dooley et al. (2007)
propose a strategic political motive: the Chinese government would influence wages,
interest rates and international financial transactions so as to foster employment and
export-led growth.
4
�
Our paper is organized as follows. Section 2 describes some empirical evidence of
China since 1992. Section 3 describes the benchmark model and characterizes equi-
librium. Section 4 discusses quantitative implications of the theory with the aid of a
calibrated economy. Section 5 presents an extension to a two-sector environment that
captures additional features of the Chinese transition. Section 6 concludes. A technical
Appendix available from our web pages contains the formal proofs.
2 The Transition of China: Empirical Evidence
2.1 Political Events and Macroeconomic Trends
China introduced its first economic reforms in December 1978. The early reforms re-
duced land collectivization, increased the role of local governments and communities,
and experimented with market reforms in a few selected areas. After a period of eco-
nomic and political instability, a new stage of the reform process was launched in 1992,
after Deng Xiaoping’s Southern Tour, during which the leader spoke in favor of an accel-
eration of reforms. Since then, China has moved towards a full-fledged market economy.
The process gained momentum in 1997, as the 15th Congress of the Communist Party
of China officially endorsed an increase in the role of private firms in the economy.
The focus of this paper is on the post-1992 Chinese transition, a period characterized
by fast and stable growth and by a pronounced resource reallocation within the man-
ufacturing sector. In spite of very high investment rates (39% on average), the rate of
return to capital has remained stable: While the aggregate return to capital has fallen
slightly (from 28% in 1993 to 21% in 2005), the rate of return to capital in manufacturing
has been increasing since the early 1990s and climbed close to 35% in 2003, according
to Figure 11 in Bai et al. (2006). High corporate returns have not been matched by the
return on financial assets available to individual savers: the average real rate of return
on bank deposits, the main financial investment of Chinese households, was close to zero
during the same period. Wage growth has been lower than growth in output per capita
in recent years.2 Similarly, the labor share of aggregate output fell gradually from 59%
2According to Banister (2007, Table 10, based on the China Labor Statistical Yearbook) the average
real annual growth of wages in the urban manufacturing sector between 1992 and 2004 was 7.5 percent,
and a mere 4.6 percent if one excludes state-owned and collectively owned enterprises. In the same
period, the average growth rate of real GDP per capita was about 9 percent. Using data from the
NBS Urban Household Surveys 1992—2006, Ge and Yang (2009) report an annual growth rate of 4.1
percent for the basic wage (the lowest skill category) and of 6.2 percent for workers with "middle-
school education and below." These are useful benchmarks since they separate the wage growth due
to technological progress from that due to human capital accumulation — which reflects the increasing
5
�
in 1998 to 47% in 2007 (Bai and Qian, 2009, Table 4).3 The falling labor share has
contributed to rising inequality even across urban households (Benjamin et al., 2008).
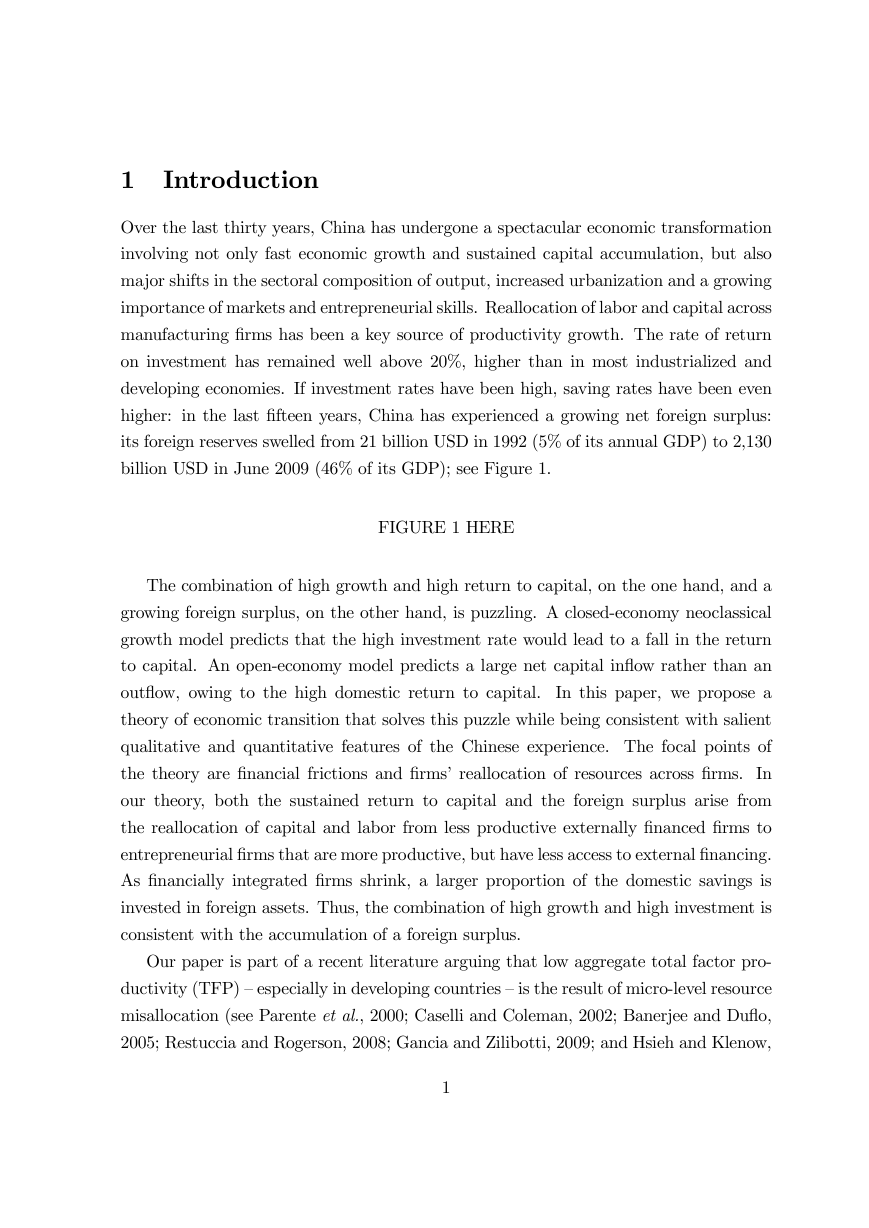
FIGURE 2 HERE
2.2 Reallocation in Manufacturing
The reallocation of capital and labor within the manufacturing sector is a focal point
of our paper. Figure 2 plots alternative measures of the evolution of the employment
share of private enterprises. Our preferred measure is based on annual firm-level surveys
conducted by China’s National Bureau of Statistics (NBS), which include the universe of
Chinese industrial firms (manufacturing, mining and construction) with sales over 5 mil-
lion RMB. The solid line plots the proportion of domestic private enterprises (DPE) as a
percent of DPE plus state-owned enterprises (SOE) in the NBS surveys. It shows an in-
crease from 4% in 1998 to 56% in 2007. This is the most relevant measure for our theory.4
However, it excludes two important firm categories: foreign enterprises (FE) and collec-
tively owned enterprises (COE). Therefore, for completeness, we also report a broader
measure of the private employment share, namely, (DPE+FE)/(DPE+FE+SOE+COE),
see the dashed line. The NBS measures of private employment share could be biased
downwards, due to the exclusion of small firms and non-industrial firms. Therefore,
we also report the corresponding ratios from aggregate statistics from the China Labor
Statistical Yearbook (CLSY).5 According to this measure, the DPE/(DPE+SOE) share
was 19% in 1997 and 54% in 2007. All measures suggest that the share of DPE was low
until 1997 and that most of the transition took place thereafter. This accords well with
the political events outlined above.
quantity and quality of education. Two additional remarks are in order. First, wages are deflated using
the provincial consumer price index (CPI). The annual CPI growth rate was on average 0.9 percentage
points lower than that of the GDP deflator in these years. Second, the compliance rate for pension
contributions paid by employers declined dramatically in this period. Both considerations suggest that
the growth of labor costs per worker for firms was lower than the figures above.
3Bai and Qian (2009) report data until 2004. The estimates for 2004—07 were kindly provided by
Bai and Qian.
4NBS data are only available since 1998. The figure shows the share of firms classified as DPE by
the NBS. If, instead, we classify as DPE all firms with a private ownership share above 50%, the DPE
shares would rise from 12% in 1998 to 59% in 2007.
5One problem with the CLSY is that it does not classify ownership for all urban employment. More
precisely, the provincial data classifying employment according to ownership adds up to only 60% of
the aggregate measure of urban employment. The dotted line is then computed by assuming that the
ratio of DPE to SOE in the unclassified aggregate data is the same as that in the provincial data.
6
�
2.3 Productivity and Credit Frictions
DPE and SOE differ in two important aspects: productivity and access to financial
markets. SOE are, on average, less productive and have better access to external credit
than do DPE. This makes ownership structure a natural proxy for the different types
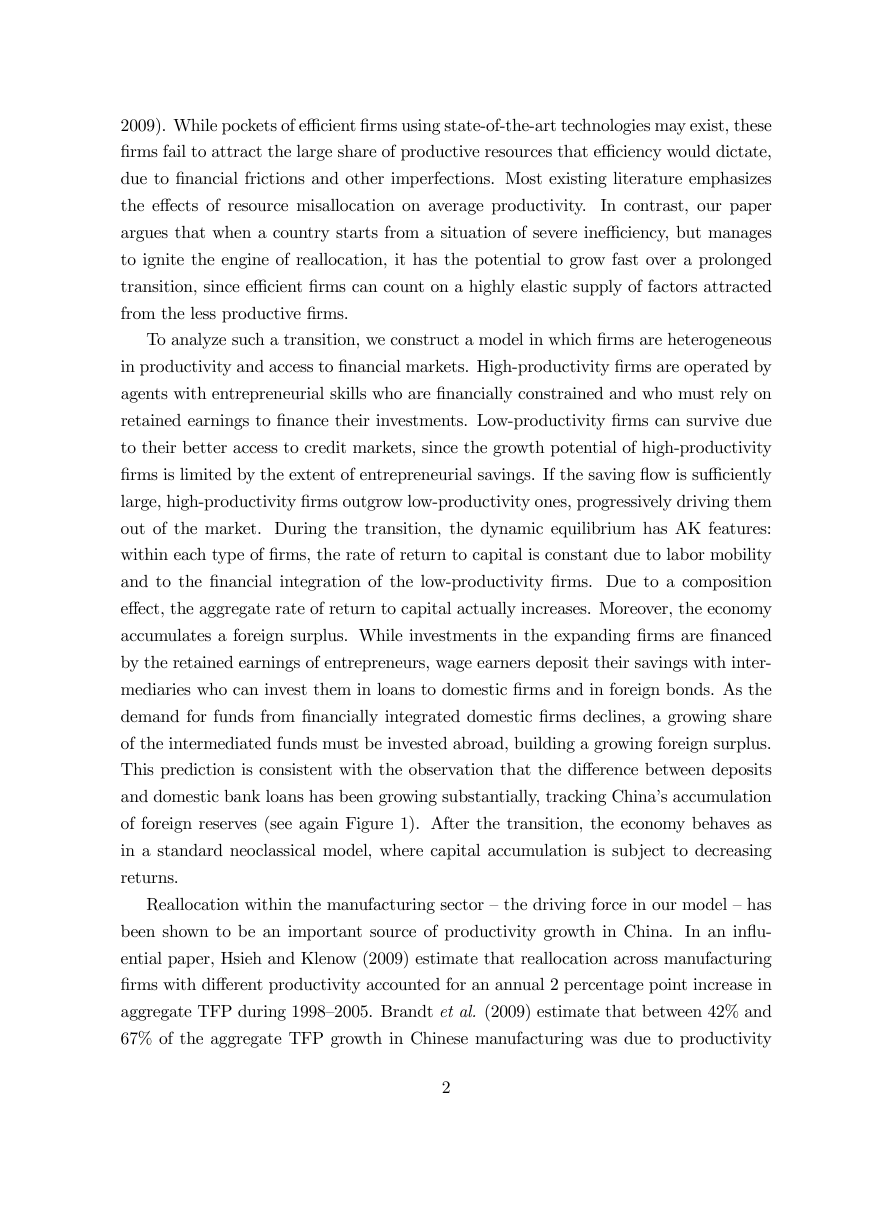
of firms in our theory. Figure 3 shows a measure of profitability, i.e., the ratio of total
profits (measured as operation profits plus subsidies plus investment returns) to fixed
assets net of depreciation. Based on this measure, the gap between DPE and SOE is
about 9 percentage points per year, similar to that reported by Islam et al. (2006).6
Large productivity differences also emerge from TFP accounting: Brandt et al. (2008,
Table 17.3) estimate an average TFP gap between DPE and SOE of 1.8 during 1998—
2004, while Brandt and Zhu (2009) estimate a gap of 2.3 in 2004. Using a different
methodology, Hsieh and Klenow (2009) estimate a "revenue-TFP gap" of 1.42.
FIGURE 3 HERE
FIGURE 4 HERE
Financial and contractual imperfections are also well documented. In a cross-country
comparative study, Allen et al. (2005) find that China scores poorly in terms of creditor
rights, investor protection, accounting standards, non-performing loans and corruption.7
In this environment, Chinese firms must rely heavily on retained earnings to finance
investments and operational costs. Financial repression is far from uniform: private
firms are subject to strong discrimination in credit markets. The Chinese banks — mostly
state owned — tend to offer easier credit to SOE (Boyreau-Debray and Wei, 2005). As a
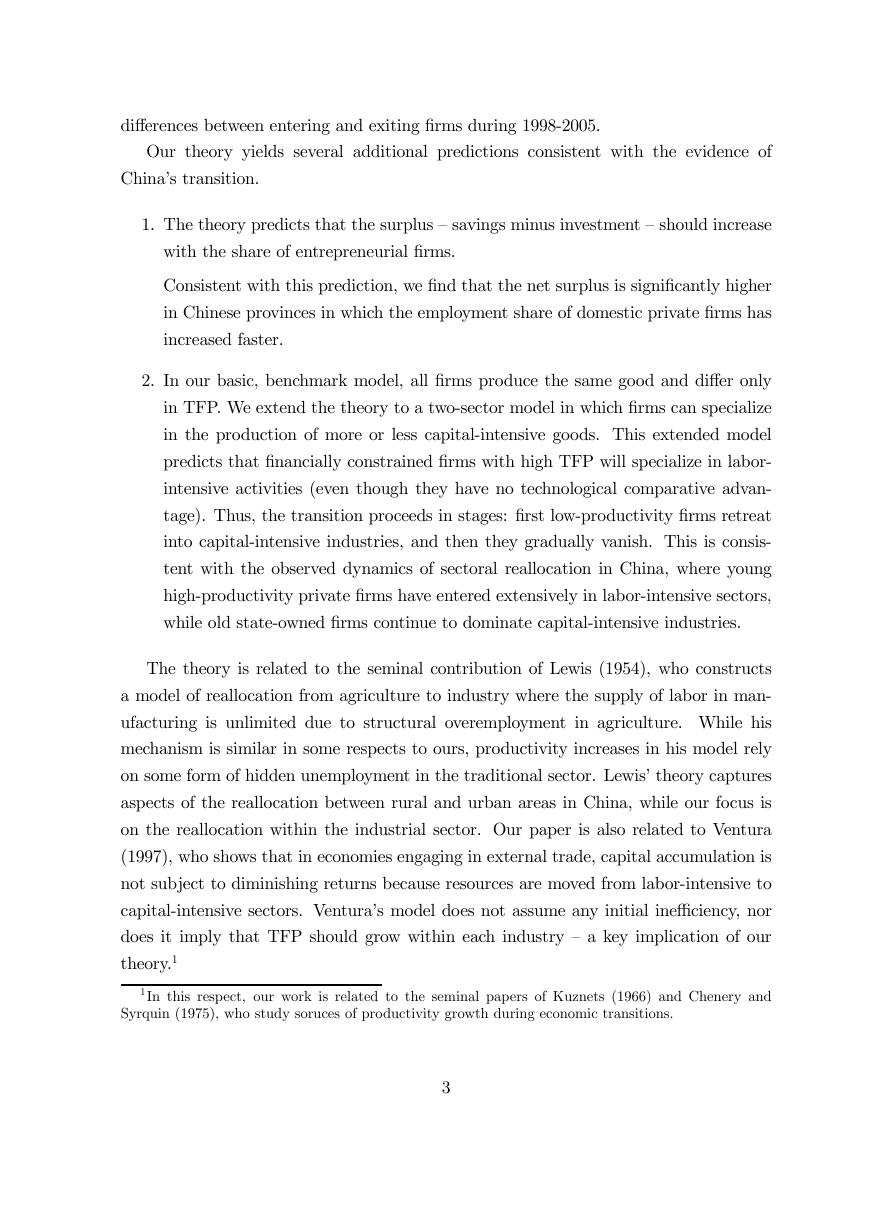
result, SOE can finance a larger share of their investments through external financing.
Figure 4 shows that SOE finance more than 30% of their investments through bank
loans compared to less than 10% for DPE. Similarly, Dollar and Wei (2007, Table 3.1)
6A concern with the official data is that the ownership classification is based on ownership at the
time of initial registration. However, many firms have subsequently been privatized. This problem is
addressed by Dollar and Wei (2007), who use survey data on 12400 firms, classified according to their
current ownership. They find the average return to capital to be twice as high in private firms as in
fully state-owned enterprises (Dollar and Wei, 2007, Table 6). Interestingly, collectively owned firms
also have a much higher productivity than SOE.
7Interestingly, some reforms of the financial system have been undertaken, including a plan to turn
the four major state-owned commercial banks into joint-stock companies. This effort involves consulting
foreign advisors to improve the managerial efficiency of banks (Kwan, 2006). In section 3.7 we discuss
the role of financial development during the economic transition.
7
�



 2023年江西萍乡中考道德与法治真题及答案.doc
 2012年重庆南川中考生物真题及答案.doc
 2013年江西师范大学地理学综合及文艺理论基础考研真题.doc
 2020年四川甘孜小升初语文真题及答案I卷.doc
 2020年注册岩土工程师专业基础考试真题及答案.doc
 2023-2024学年福建省厦门市九年级上学期数学月考试题及答案.doc
 2021-2022学年辽宁省沈阳市大东区九年级上学期语文期末试题及答案.doc
 2022-2023学年北京东城区初三第一学期物理期末试卷及答案.doc
 2018上半年江西教师资格初中地理学科知识与教学能力真题及答案.doc
 2012年河北国家公务员申论考试真题及答案-省级.doc
 2020-2021学年江苏省扬州市江都区邵樊片九年级上学期数学第一次质量检测试题及答案.doc
 2022下半年黑龙江教师资格证中学综合素质真题及答案.doc