Modern Instrumentation, 2017, 6, 15-27
http://www.scirp.org/journal/mi
ISSN Online: 2165-9273
ISSN Print: 2165-9257
Construction of a Potentiostat to Perform
Electrochemical Impedance Spectroscopy (EIS)
Tests
Francisco Sepúlveda1, José Hernández2, Andrés Manríquez1
1Departamento de Ingeniería Mecánica, Universidad de Santiago de Chile, Santiago, Chile
2Departamento de Materiales Avanzados, Comisión Chilena de Energía Nuclear, Santiago, Chile
How to cite this paper: Sepúlveda, F.,
Hernández, J. and Manríquez, A. (2017)
Construction of a Potentiostat to Perform
Electrochemical Impedance Spectroscopy
(EIS) Tests. Modern Instrumentation, 6,
15-27.
https://doi.org/10.4236/mi.2017.62002
Received: August 25, 2017
Accepted: October 31, 2017
Published: November 3, 2017
Copyright © 2017 by authors and
Scientific Research Publishing Inc.
This work is licensed under the Creative
Commons Attribution International
License (CC BY 4.0).
http://creativecommons.org/licenses/by/4.0/
Open Access
Abstract
In this work, it was developed the construction of a potentiostat for the execu-
tion of Electrochemical Impedance Spectroscopy (EIS) experiments, using an
Agilent 33220a signal generator, a RIGOL 1064b oscilloscope and a proto-
board for the connection of operational amplifiers to an electrochemical cell.
The coordination of the global operation, in addition to data acquisition, was
performed using a code generated in the LabVIEW program. The system ana-
lyzed was the corrosion of an 1100 aluminum plate in water, in order to com-
pare the results obtained by other authors. The data acquisition consisted in
obtaining the values of amplitude, RMS voltage and phase angle between the
generated power signals and the current output, in order to obtain the im-
pedance of the system, for different signal frequencies. Finally, the values ob-
tained were plotted on a Nyquist diagram. In this way, the objective of this ar-
ticle is to demonstrate that with conventional laboratory equipment it is
possible to implement an experimental device, capable of delivering results
similar to those obtained by commercial equipment.
Keywords
EIS, Impedance, LabVIEW
1. Introduction
Electrochemical Impedance Spectroscopy (EIS) is a relatively new and powerful
method for characterizing many of the electrical properties of materials and
conductors. It can be used to investigate the dynamics of an electrode, the mo-
bile load of solutions or interfacial regions of any electrode, whether solid or liq-
DOI: 10.4236/mi.2017.62002 Nov. 3, 2017
15
Modern Instrumentation
�
F. Sepúlveda et al.
uid, and even insulators [1].
The input of a voltage will be given by the expression:
The most common approach for the development of this technique is to
measure the impedance of an electrochemical system by applying a single fre-
quency alternating voltage to the interface. And thus, the system responds with a
phase shift and amplitude between the applied voltage and the resulting current.
This result is visualized in its real and imaginary components [2]. There is a
wide variety of commercial equipment to measure impedance as a function of
frequency, in intervals of approximately 1 mHz to 80 MHz [3].
V V
0
, where
V0 is the maximum amplitude of the voltage, and ω the frequency in rad/s. In a
similar way to an electric circuit containing combinations of resistances and ca-
pacitances, the electrochemical solution can be represented. The circulating cur-
(
)
rent in the cell can be described by the following expression:
,
tω φ
where φ is the phase angle between the input voltage and the response. The
electrochemical phenomena that occur in the systems will be represented by ei-
ther resistors, capacitors and/or coils. This equivalent representation is known as
the Randles Cell [4].
(
tω
)
I
0 sin
∗
sin
=
I
=
+
The Electrochemical Impedance Spectroscopy (EIS) studies allow a wide cha-
racterization of various electrochemical systems. Its main applications are: [5]
The determination of surface quality of the electrolytic deposits, because EIS
tests are very sensitive to the conditions of the deposit.
Quantification of deterioration of electrode surfaces, EIS tests are applied
without the need to conduct a destructive test, such as the salt fog chamber or
weight loss over time.
Obtaining results in short periods of time.
Allows the determination of reaction mechanisms in the obtaining of metals
by electro deposits.
However, EIS tests also have a number of disadvantages compared to the most
commonly used electrochemical techniques, such as linear or cyclic voltamme-
try: [5]
Equipment is expensive.
Requires data analysis in the complex plane.
Requires complicated data analysis.
It is for these reasons that this work will show the fundamental principles and
methodology applied to construct a potentiostat from an Agilent 33220a Signal
Generator and a Rigol DS 1064b Oscilloscope, which will be used to characterize
the corrosion of an aluminum plate in raw water. This allows obtaining an image
of the components in real and imaginary impedance between the voltage and the
current, as well as of the phase difference between both signals for different fre-
quencies, which allows the determination of adsorption mechanisms and/or
formation of films on the surface of the electrode.
The potentiostats used to develop these kinds of tests can reach values of 7.000
- 8.000 US$ [3]. The goal of this article is to show that, using conventional gear
16
Modern Instrumentation
DOI: 10.4236/mi.2017.62002
�
F. Sepúlveda et al.
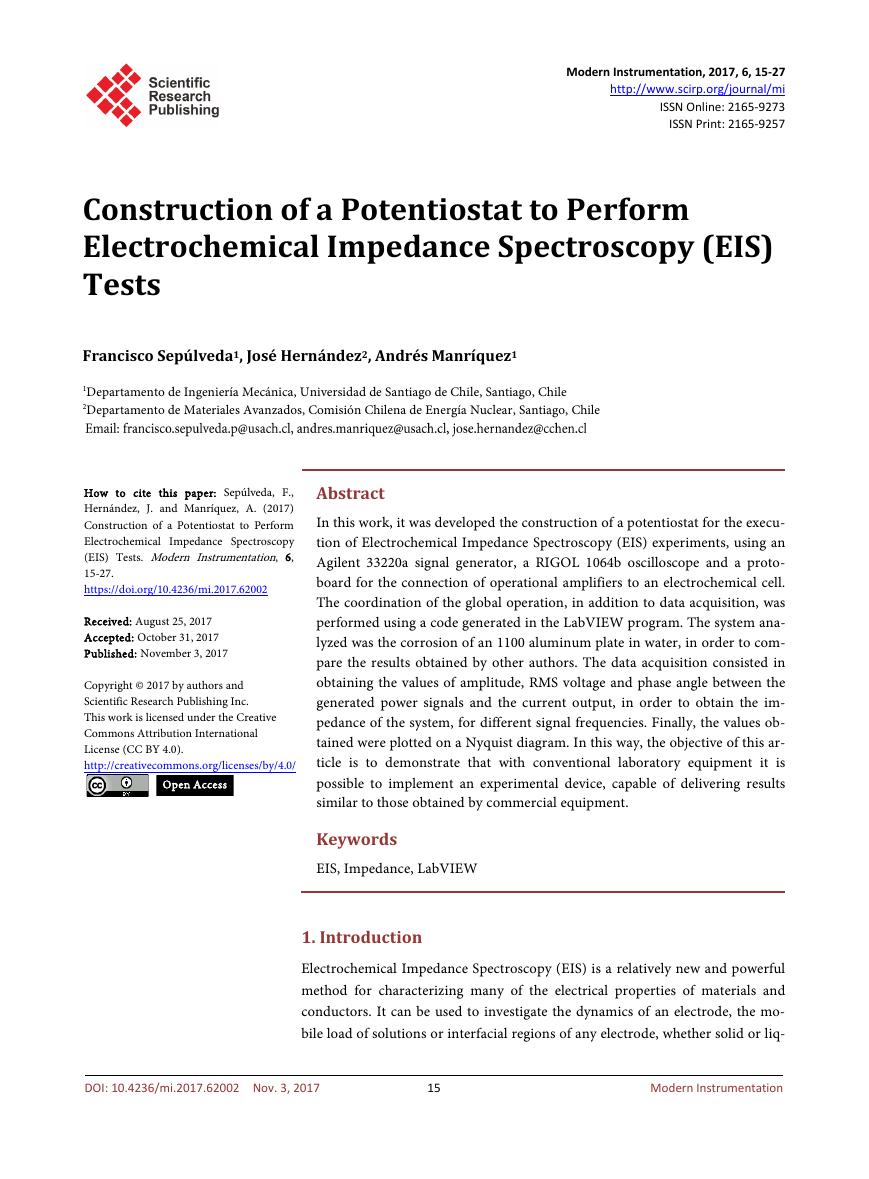
Figure 1. Nyquist diagram for an electrochemical system, with its corres-
ponding equivalent circuit (Randles cell) [6] [7].
from any instrumentation laboratory and the fundamental principles of opera-
tion, it is possible to obtain very similar results with lower costs.
2. Experimental Development
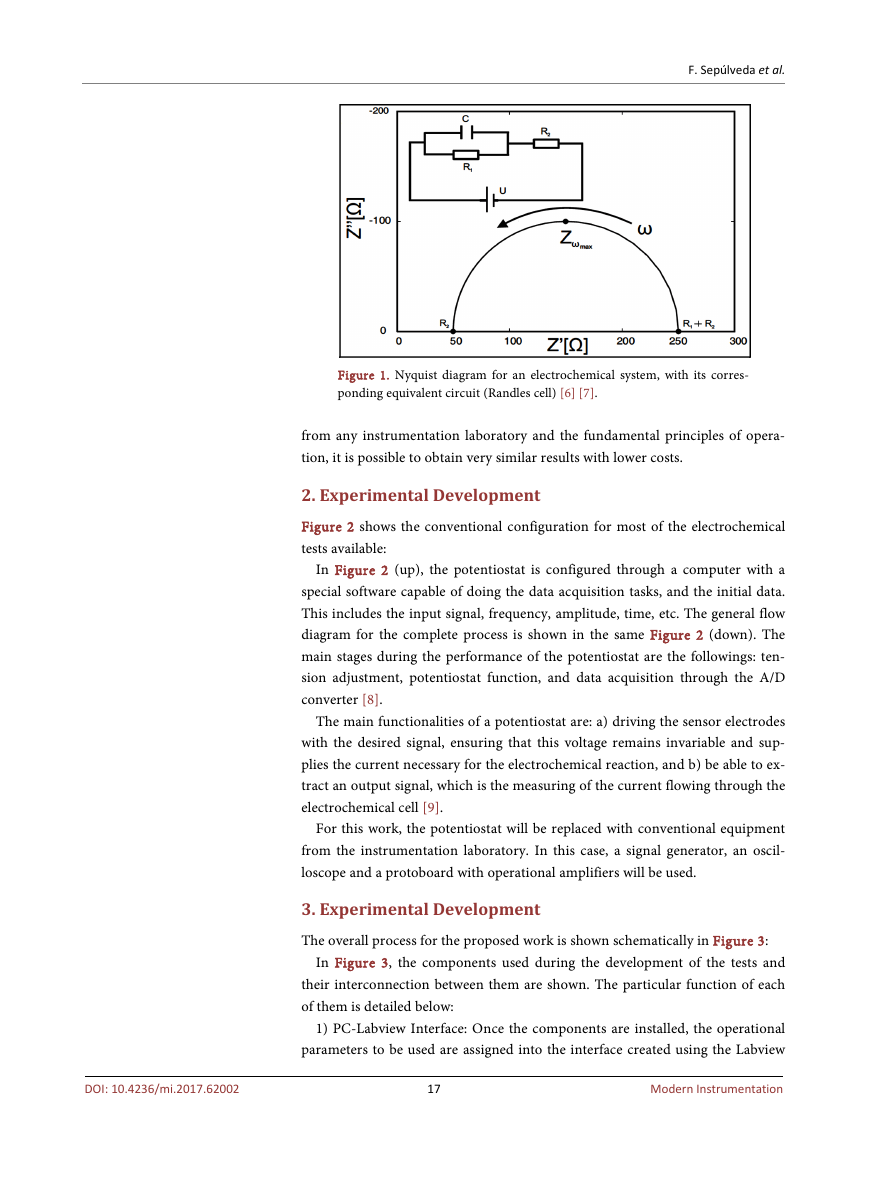
Figure 2 shows the conventional configuration for most of the electrochemical
tests available:
In Figure 2 (up), the potentiostat is configured through a computer with a
special software capable of doing the data acquisition tasks, and the initial data.
This includes the input signal, frequency, amplitude, time, etc. The general flow
diagram for the complete process is shown in the same Figure 2 (down). The
main stages during the performance of the potentiostat are the followings: ten-
sion adjustment, potentiostat function, and data acquisition through the A/D
converter [8].
The main functionalities of a potentiostat are: a) driving the sensor electrodes
with the desired signal, ensuring that this voltage remains invariable and sup-
plies the current necessary for the electrochemical reaction, and b) be able to ex-
tract an output signal, which is the measuring of the current flowing through the
electrochemical cell [9].
For this work, the potentiostat will be replaced with conventional equipment
from the instrumentation laboratory. In this case, a signal generator, an oscil-
loscope and a protoboard with operational amplifiers will be used.
3. Experimental Development
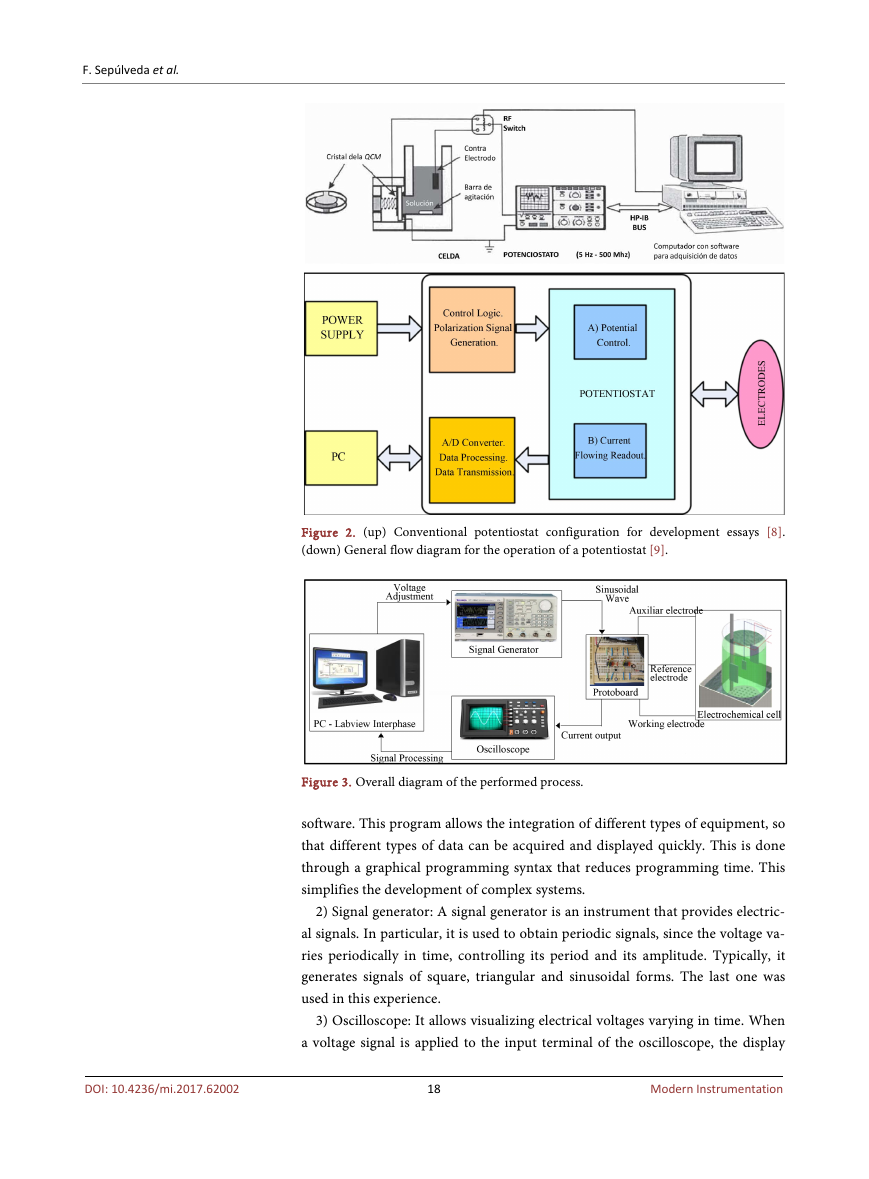
The overall process for the proposed work is shown schematically in Figure 3:
In Figure 3, the components used during the development of the tests and
their interconnection between them are shown. The particular function of each
of them is detailed below:
1) PC-Labview Interface: Once the components are installed, the operational
parameters to be used are assigned into the interface created using the Labview
17
Modern Instrumentation
DOI: 10.4236/mi.2017.62002
�
F. Sepúlveda et al.
Figure 2. (up) Conventional potentiostat configuration for development essays [8].
(down) General flow diagram for the operation of a potentiostat [9].
Figure 3. Overall diagram of the performed process.
software. This program allows the integration of different types of equipment, so
that different types of data can be acquired and displayed quickly. This is done
through a graphical programming syntax that reduces programming time. This
simplifies the development of complex systems.
2) Signal generator: A signal generator is an instrument that provides electric-
al signals. In particular, it is used to obtain periodic signals, since the voltage va-
ries periodically in time, controlling its period and its amplitude. Typically, it
generates signals of square, triangular and sinusoidal forms. The last one was
used in this experience.
3) Oscilloscope: It allows visualizing electrical voltages varying in time. When
a voltage signal is applied to the input terminal of the oscilloscope, the display
18
Modern Instrumentation
DOI: 10.4236/mi.2017.62002
�
F. Sepúlveda et al.
will show a graphical representation of the voltage as a function of time. The os-
cilloscope not only allows to visualize the signal, but also to measure its period,
amplitude and, fundamental for the development of this experience, to deter-
mine the phase between the input and output signals to the protoboard.
4) Protoboard: The protoboard are small boards with perforations throughout
its area, in which were placed operational amplifiers, which allow making mea-
surements in the electrochemical cell.
5) Electrochemical cell: The electrochemical cell represents the working sys-
tem to be characterized, which consists of 3 electrodes. The first is the auxiliary
electrode, which is the input of the sine wave of the signal generator. The refer-
ence electrode, which allows measurements of voltage in the cell, and the work-
ing electrode, which is the material to be characterized in the working solution.
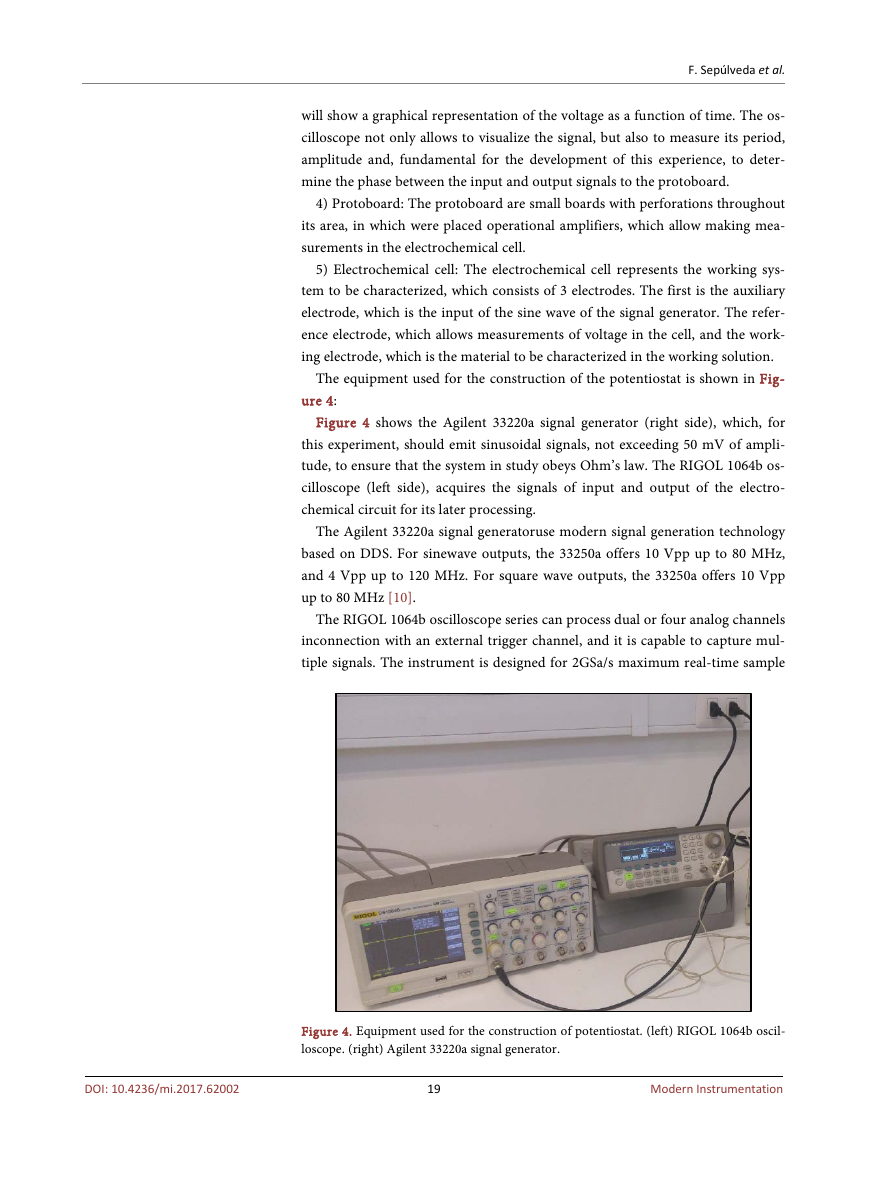
The equipment used for the construction of the potentiostat is shown in Fig-
ure 4:
Figure 4 shows the Agilent 33220a signal generator (right side), which, for
this experiment, should emit sinusoidal signals, not exceeding 50 mV of ampli-
tude, to ensure that the system in study obeys Ohm’s law. The RIGOL 1064b os-
cilloscope (left side), acquires the signals of input and output of the electro-
chemical circuit for its later processing.
The Agilent 33220a signal generatoruse modern signal generation technology
based on DDS. For sinewave outputs, the 33250a offers 10 Vpp up to 80 MHz,
and 4 Vpp up to 120 MHz. For square wave outputs, the 33250a offers 10 Vpp
up to 80 MHz [10].
The RIGOL 1064b oscilloscope series can process dual or four analog channels
inconnection with an external trigger channel, and it is capable to capture mul-
tiple signals. The instrument is designed for 2GSa/s maximum real-time sample
Figure 4. Equipment used for the construction of potentiostat. (left) RIGOL 1064b oscil-
loscope. (right) Agilent 33220a signal generator.
19
Modern Instrumentation
DOI: 10.4236/mi.2017.62002
�
F. Sepúlveda et al.
rate, 50 GSa/s maximum equivalent sample rate and 200MHz maximum band-
width. Besides, abundant trigger modes, math and acquire functions enable it
easy to capture and analyze waveforms [11].
For both hardware to work in a coordinated way, a code was developed in
LabVIEW that allows the subsequent acquisition and processing of the men-
tioned signals. In the following figures are shown the codes used to organize
their operation.
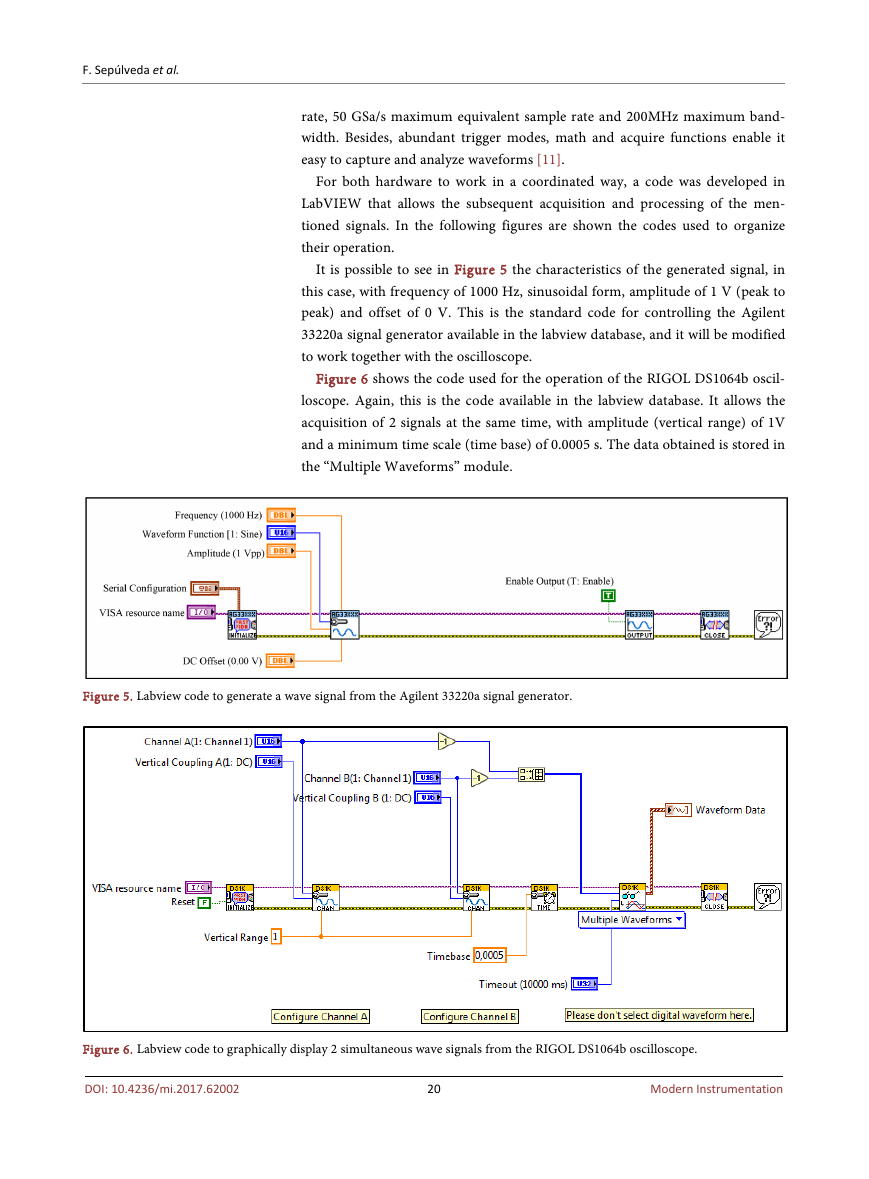
It is possible to see in Figure 5 the characteristics of the generated signal, in
this case, with frequency of 1000 Hz, sinusoidal form, amplitude of 1 V (peak to
peak) and offset of 0 V. This is the standard code for controlling the Agilent
33220a signal generator available in the labview database, and it will be modified
to work together with the oscilloscope.
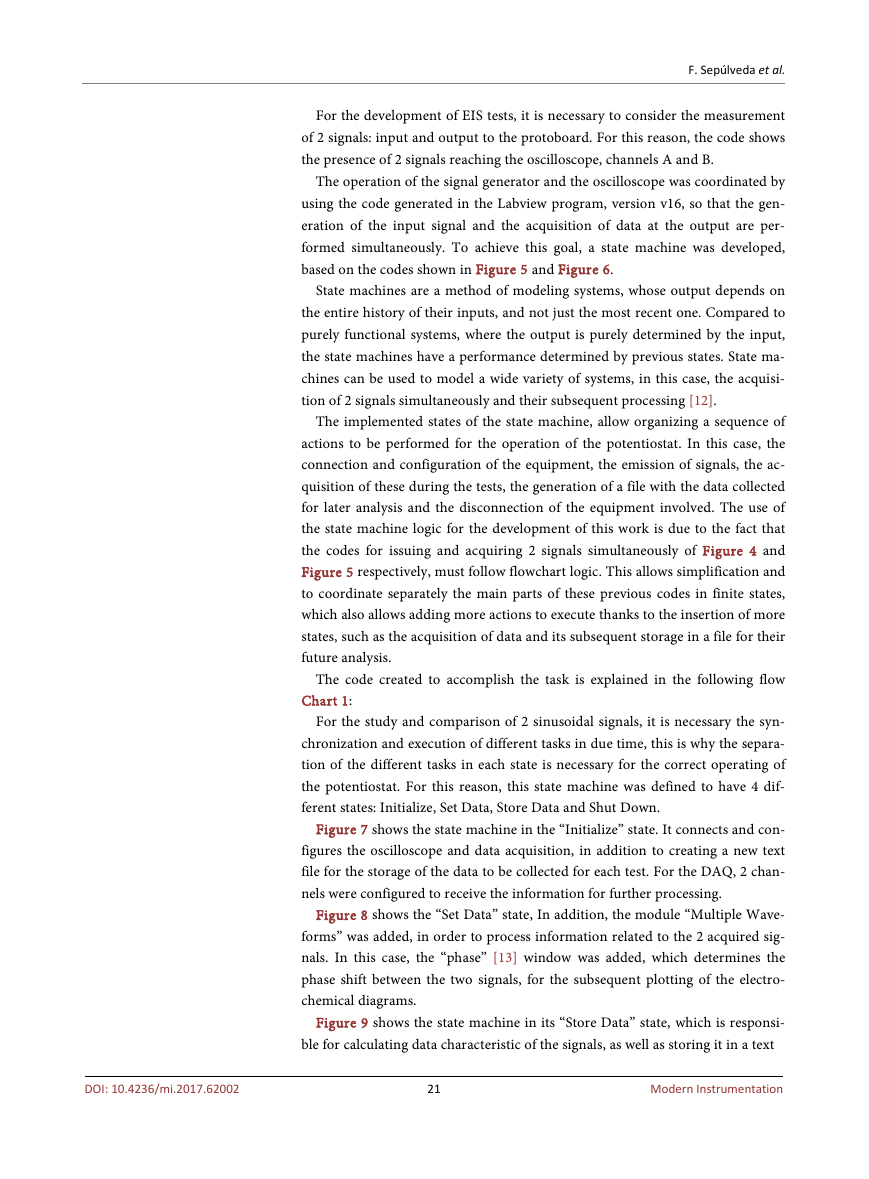
Figure 6 shows the code used for the operation of the RIGOL DS1064b oscil-
loscope. Again, this is the code available in the labview database. It allows the
acquisition of 2 signals at the same time, with amplitude (vertical range) of 1V
and a minimum time scale (time base) of 0.0005 s. The data obtained is stored in
the “Multiple Waveforms” module.
Figure 5. Labview code to generate a wave signal from the Agilent 33220a signal generator.
Figure 6. Labview code to graphically display 2 simultaneous wave signals from the RIGOL DS1064b oscilloscope.
DOI: 10.4236/mi.2017.62002
20
Modern Instrumentation
�
F. Sepúlveda et al.
For the development of EIS tests, it is necessary to consider the measurement
of 2 signals: input and output to the protoboard. For this reason, the code shows
the presence of 2 signals reaching the oscilloscope, channels A and B.
The operation of the signal generator and the oscilloscope was coordinated by
using the code generated in the Labview program, version v16, so that the gen-
eration of the input signal and the acquisition of data at the output are per-
formed simultaneously. To achieve this goal, a state machine was developed,
based on the codes shown in Figure 5 and Figure 6.
State machines are a method of modeling systems, whose output depends on
the entire history of their inputs, and not just the most recent one. Compared to
purely functional systems, where the output is purely determined by the input,
the state machines have a performance determined by previous states. State ma-
chines can be used to model a wide variety of systems, in this case, the acquisi-
tion of 2 signals simultaneously and their subsequent processing [12].
The implemented states of the state machine, allow organizing a sequence of
actions to be performed for the operation of the potentiostat. In this case, the
connection and configuration of the equipment, the emission of signals, the ac-
quisition of these during the tests, the generation of a file with the data collected
for later analysis and the disconnection of the equipment involved. The use of
the state machine logic for the development of this work is due to the fact that
the codes for issuing and acquiring 2 signals simultaneously of Figure 4 and
Figure 5 respectively, must follow flowchart logic. This allows simplification and
to coordinate separately the main parts of these previous codes in finite states,
which also allows adding more actions to execute thanks to the insertion of more
states, such as the acquisition of data and its subsequent storage in a file for their
future analysis.
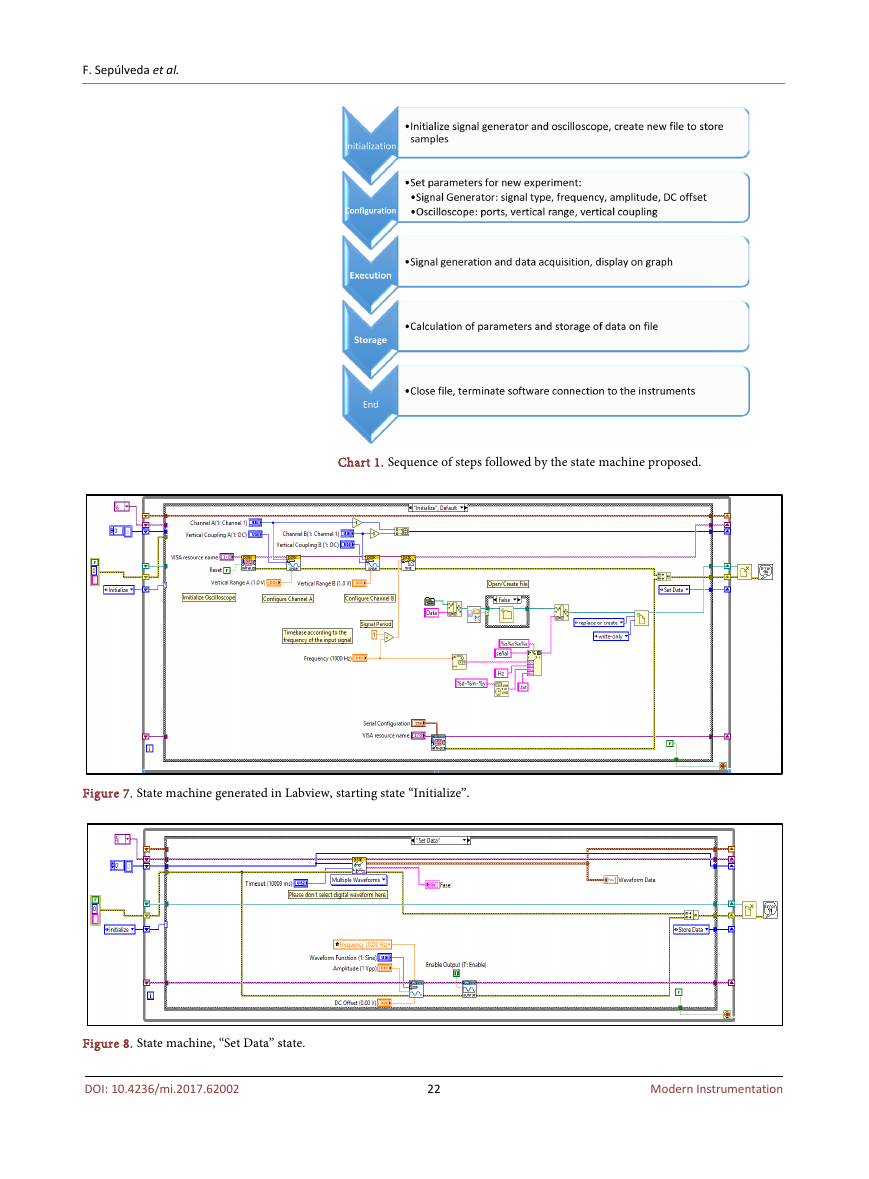
The code created to accomplish the task is explained in the following flow
Chart 1:
For the study and comparison of 2 sinusoidal signals, it is necessary the syn-
chronization and execution of different tasks in due time, this is why the separa-
tion of the different tasks in each state is necessary for the correct operating of
the potentiostat. For this reason, this state machine was defined to have 4 dif-
ferent states: Initialize, Set Data, Store Data and Shut Down.
Figure 7 shows the state machine in the “Initialize” state. It connects and con-
figures the oscilloscope and data acquisition, in addition to creating a new text
file for the storage of the data to be collected for each test. For the DAQ, 2 chan-
nels were configured to receive the information for further processing.
Figure 8 shows the “Set Data” state, In addition, the module “Multiple Wave-
forms” was added, in order to process information related to the 2 acquired sig-
nals. In this case, the “phase” [13] window was added, which determines the
phase shift between the two signals, for the subsequent plotting of the electro-
chemical diagrams.
Figure 9 shows the state machine in its “Store Data” state, which is responsi-
ble for calculating data characteristic of the signals, as well as storing it in a text
21
Modern Instrumentation
DOI: 10.4236/mi.2017.62002
�
F. Sepúlveda et al.
Chart 1. Sequence of steps followed by the state machine proposed.
Figure 7. State machine generated in Labview, starting state “Initialize”.
Figure 8. State machine, “Set Data” state.
DOI: 10.4236/mi.2017.62002
22
Modern Instrumentation
�



 2023年江西萍乡中考道德与法治真题及答案.doc
 2012年重庆南川中考生物真题及答案.doc
 2013年江西师范大学地理学综合及文艺理论基础考研真题.doc
 2020年四川甘孜小升初语文真题及答案I卷.doc
 2020年注册岩土工程师专业基础考试真题及答案.doc
 2023-2024学年福建省厦门市九年级上学期数学月考试题及答案.doc
 2021-2022学年辽宁省沈阳市大东区九年级上学期语文期末试题及答案.doc
 2022-2023学年北京东城区初三第一学期物理期末试卷及答案.doc
 2018上半年江西教师资格初中地理学科知识与教学能力真题及答案.doc
 2012年河北国家公务员申论考试真题及答案-省级.doc
 2020-2021学年江苏省扬州市江都区邵樊片九年级上学期数学第一次质量检测试题及答案.doc
 2022下半年黑龙江教师资格证中学综合素质真题及答案.doc