Energy and Power Engineering, 2020, 12, 63-72
https://www.scirp.org/journal/epe
ISSN Online: 1947-3818
ISSN Print: 1949-243X
A Multi-Objective Coordinated Charging and
Discharging Strategy for Electric Vehicles
Based on Stackelberg Game
Haozhe Xu, Xueliang Huang
School of Electrical Engineering, Southeast University, Nanjing, China
How to cite this paper: Xu, H.Z. and
Huang, X.L. (2020) A Multi-Objective Coor-
dinated Charging and Discharging Strategy
for Electric Vehicles Based on Stackelberg
Game. Energy and Power Engineering, 12,
63-72.
https://doi.org/10.4236/epe.2020.124B007
Received: March 11, 2020
Accepted: April 7, 2020
Published: April 10, 2020
Abstract
For the negative impact of large-scale electric vehicles (EVs) disorderly
charging on the power grid, a multi-objective optimization strategy for coor-
dinated charging and discharging of EVs based on Stackelberg game is pro-
posed. As the leader, the grid company aims to stabilize load fluctuations and
formulate a reasonable electricity price strategy to guide EVs to participate in
vehicle-to-grid (V2G); As followers, EV users optimize their charging plans
based on electricity price information with the objective of reducing costs and
obtaining good comfort. This paper uses the MOPSO algorithm to solve the
proposed multi-objective Stackelberg problem, and calculates the optimiza-
tion results under various preferences, which proves the effectiveness of the
pro-posed model and method.
Keywords
Vehicle-to-Grid (V2G), Stackelberg Game, Electric Vehicle (EV), Optimal
Dispatch
1. Introduction
With the increasingly serious problems of global environmental pollution and
energy shortage, electric vehicle with the characteristics of environmental pro-
tection and energy saving has been widely concerned and rapidly developed. The
increase in the number of EVs and their uncoordinated charging will cause
problems such as grid overload, increased network losses, and harmonic pollu-
tion [1] [2] [3], which is not conducive to the security and stability of the power
grid. V2G uses the mobile energy storage characteristic of EVs to rationally re-
gulate the charging and discharging of EVs, which can not only alleviate fluctua-
DOI: 10.4236/epe.2020.124B007 Apr. 10, 2020
63
Energy and Power Engineering
�
H. Z. Xu, X. L. Huang
DOI: 10.4236/epe.2020.124B007
tions in the load on the power grid, but also create revenue for EV users [4].
The Stackelberg problem with the hierarchical structure was first raised by
Von Stackelberg in 1952 when he studied market economy issues [5]. In [6], a
Stackelberg game approach was used to deal with the charging strategy in the
case of one aggregator and multiple aggregators. Similar approaches were used
in [7] to stimulate the game between community charging agents and EVs, by
transforming the game into linear programming, the pricing and power pur-
chasing strategies of smart community agents were obtained. In [8], a Stackel-
berg game model is established to study the V2G problem in the parking lot and
the battery loss and transmission loss are considered to optimize the robust cha-
racteristics of the system. Additionally, a charging guidance method based on
electricity price signals.is proposed in [9] to maximize EVs benefits and to even-
tually flatten aggregated load curves. The work in [10] considered the uncer-
tainty of EV behavior during the game, and proposed a real-time asynchronous
DR algorithm, which effectively reduced the load fluctuation of the power grid.
A three-layer Stackelberg model including power grid, energy storage, and users
is constructed in [11], and the Jaya-based Boltzmann machine algorithm was
used to maximize the overall benefits of the game players.
The Stackelberg model in the above literature only considers the single objec-
tive of each subject, and in reality, the objectives of the game players are often
diversified. Especially for EVs, only considering economic objective may ignores
the user’s requirement for comfort. Based on the previous research, this paper
builds a Stackelberg multi-objective optimization model with the grid as the
leader and the EV users as the followers. The MOPSO algorithm is used to cal-
culate the charging and discharging strategies under different preferences. Main
contributions of this paper include following key points:
• Using a Stackelberg game between grid and EVs and considering their mul-
tiple objectives to make the model closer to reality.
• Designing examples with different preferences, and finding Stackelberg equi-
librium with MOPSO algorithm and fuzzy theory.
The remaining of this paper is organized as follows: Section 2 discusses the
system model and formulates the Stackelberg problem. In Section 3, the solution
techniques adopted in this work have been discussed. The results obtained from
our simulations are provided and discussed in Section 4. Section 5 concludes the
paper
2. System Model
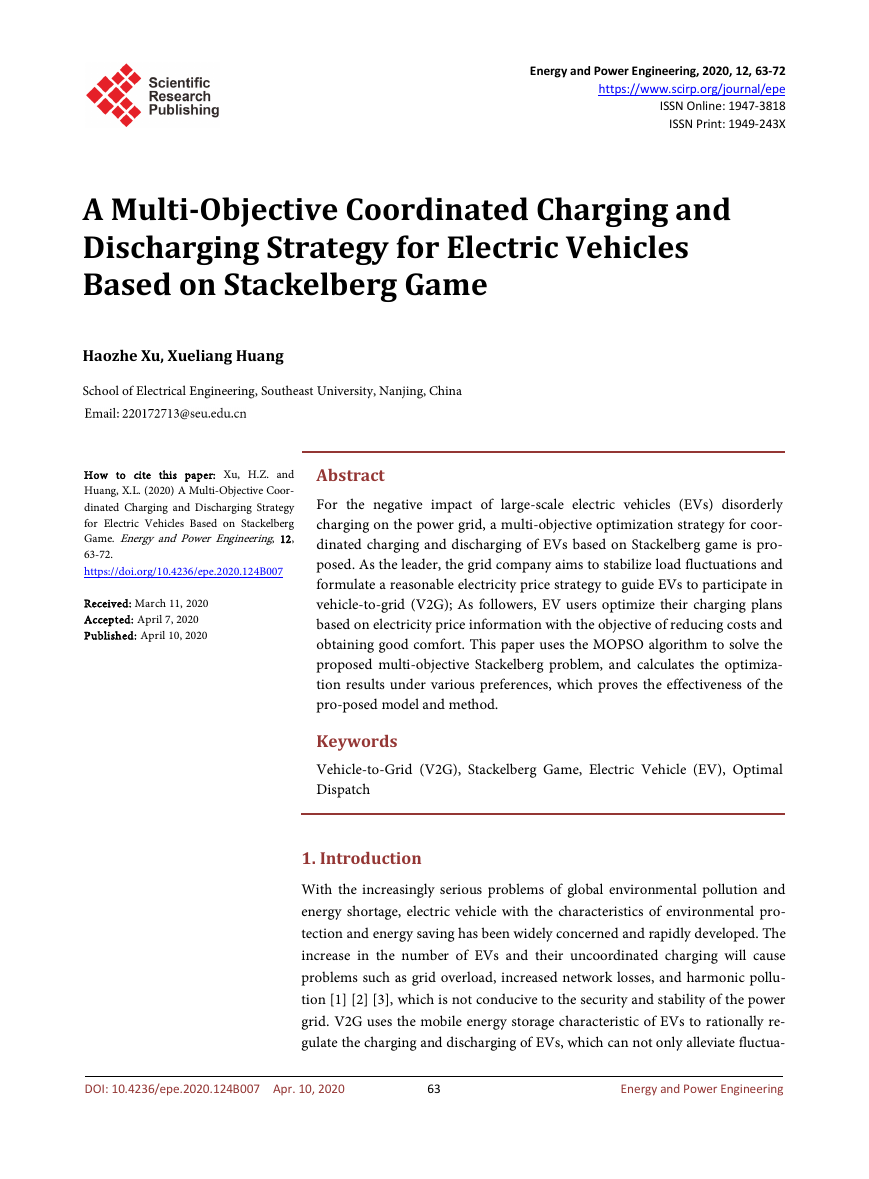
As shown in Figure 1, the power grid is upper-level leader, and EVs are low-
er-level followers. EV users adjust their charge and discharge plans to respond to
electricity price signals from the power grid in order to reduce the cost of elec-
tricity, but they will also consider their original charging plan. Different types of
EVs have different behavior characteristics and power requirements [12]. The
research object of this article is private EV.
64
Energy and Power Engineering
�
H. Z. Xu, X. L. Huang
Figure 1. V2G system model.
2.1. User Model
According to what has been s explained in Section 1, EV users participate in V2G
and formulate their own charging and discharging plans to reduce charging
costs. On the other hand, they also want to obtain good experience of consum-
ing. Therefore, the objectives of EV users should include the two aspects of
economy and comfort. The user problem can be formulated as follows:
• Objective 1: Optimal economy
T
∑
. (1)
t K x
,
i t
p x
⋅
,
t
i t
min
U
⋅ ∆ +
t
⋅ ∆
1,
EV i
=
(
t
1
=
⋅
d
)
i tx > means charging and
,
,i tx is the charging or discharging power of EV i during the time interval
where
0
t,
tp is the electric-
ity price in the interval t.
dK is the battery discount rate. Factors affecting the
discount rate include battery discharge depth, charge and discharge power,
temperature, etc. [13] [14].
• Objective 2: Optimal Comfort
i tx < means discharging.
,
0
The comfort of EV users is closely related to their charging plans. When there
is no difference in electricity prices in different time periods and the user has no
economic considerations, the user will choose the charging plan that best meets
his own habits. Therefore, the user’s load curve without the difference in elec-
tricity prices can be used as the maximum comfort curve, and the deviation be-
tween the actual load curve and the maximum comfort curve can be used as an
index to measure the electric comfort of the EV user. Therefore, the optimiza-
tion problem is formulated as follows:
T
∑
t
1
=
max
U
2,
EV i
1
= −
α
t
(
x
,
i t
−
x
, ,0
i t
)
T
∑
t
1
=
x
, ,0
i t
. (2)
DOI: 10.4236/epe.2020.124B007
i tx
, ,0
is the original planned load of EV i in the interval t, and it depends
where,
on the driving habits and travel characteristics of the user. It can be simulated by
65
Energy and Power Engineering
�
H. Z. Xu, X. L. Huang
Monte Carlo method after fitting the relevant statistical data [15] [16] [17].
tα
is the influence coefficient, which measures the influence of the deviation on the
user’s comfort. A small value can be set at night and a large value can be set
during the day.
• The constraints of users
≤
. .
s t
x
min
SOC
SOC
≤
,
i t
x
,
i t
≤
min
. (3)
. (4)
max
SOC
,
i t
=
SOC
, 1
i t
−
⋅ ∆ . (5)
t
≤
x
max
SOC
x
,
i t
C
0
SOC
+
)
=
max
SOC
, (
i t departure
. (6)
where (3) provides the upper and lower boundaries for charge and discharge
power of EV and (4) gives the upper and lower boundaries of the battery SOC
(State of Charge). (5) shows the relationship between the current SOC and the
SOC of the previous period. In (6) the sequence of charging/discharging should
be in a way that by the time that the EV owner decides to leaves the house, the
SOC should reached maximum.
2.2. Grid Model
The objectives of the power grid include reducing the standard deviation of the
load, reducing the peak-to-valley difference, and increasing the revenue from
electricity sales. Some literatures [18] [19] [20] have studied the economic bene-
fits of V2G to the grid, i.e., the effect of subsidizing EVs to participate in V2G is
conducive to the reduction of the overall cost of the grid. Therefore, we no long-
er consider the objective of maximizing the electricity sales revenue of the power
grid, and only considers the index of load stability.
• Objective 1: Reduce standard deviation of the load
min
U
grid
1
=
1
T
T =
1
t
−∑
L
t
(
2
L
)
. (7)
I
L
t
=
L
0,
t
1
=
x
,
i t
+ ∑ . (8)
i
1 T
⋅∑ . (9)
T =
1
t
L
t
L
=
0,tL is the power of grid without EV load in the interval t.
where
load in the interval t. L is the daily average load after scheduling.
• Objective 2: Reduce peak-to-valley differences
L
min
gridU
min
=
−
2
tL is the total
L
max
minL
. (10)
is the daily minimum load.
maxL
where,
• The constraints of grid
is the daily maximum load,
DOI: 10.4236/epe.2020.124B007
66
Energy and Power Engineering
<
. .
s t
p
p
min
t
tL M≤
<
p
max
. (11)
. (12)
�
H. Z. Xu, X. L. Huang
where (16) provides the upper and lower boundaries for electricity price in each
time period. (17) limits the maximum value of the total load and it cannot ex-
ceed the maximum capacity of the distribution network.
3. Stackelberg Game Model Solution
The original load curve of an EV depends on the owner’s behavior, the battery
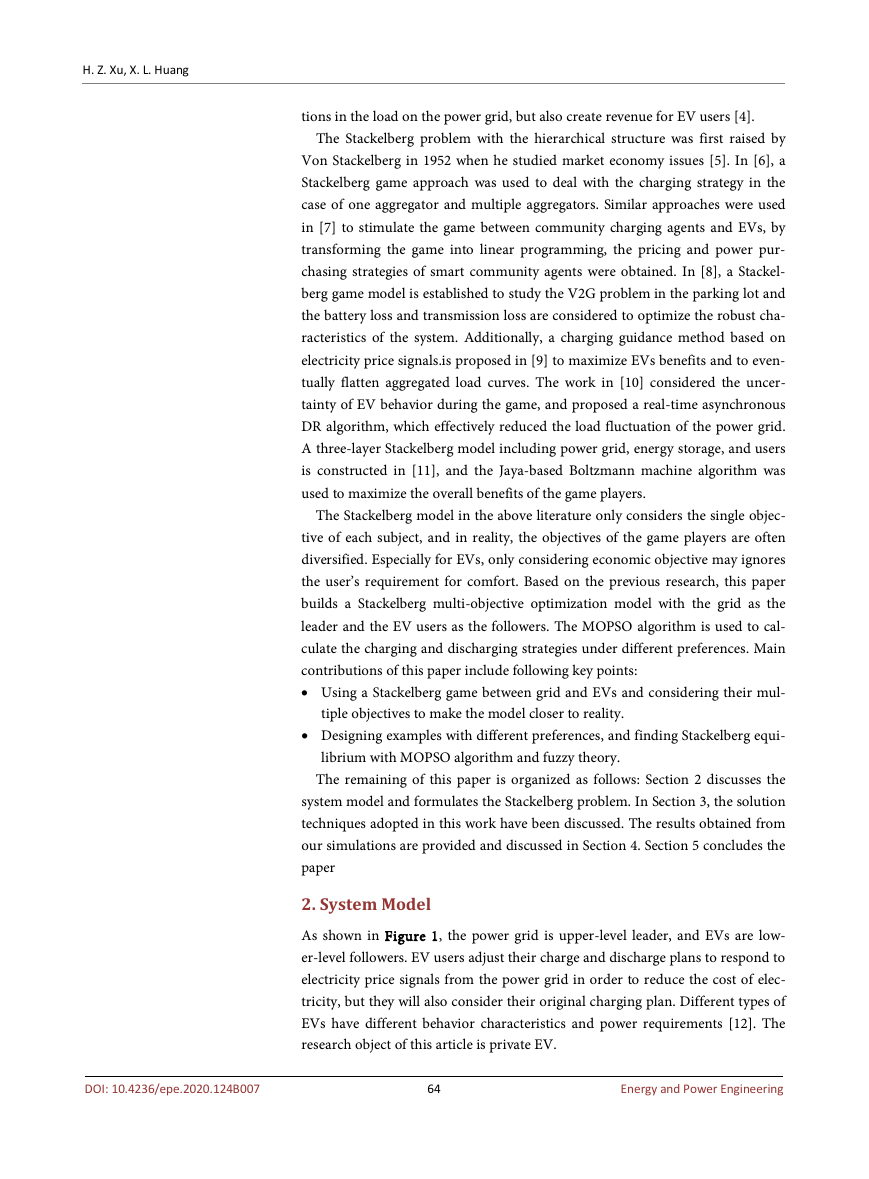
parameters of the EV, etc. The relevant statistics of the 2009 National Household
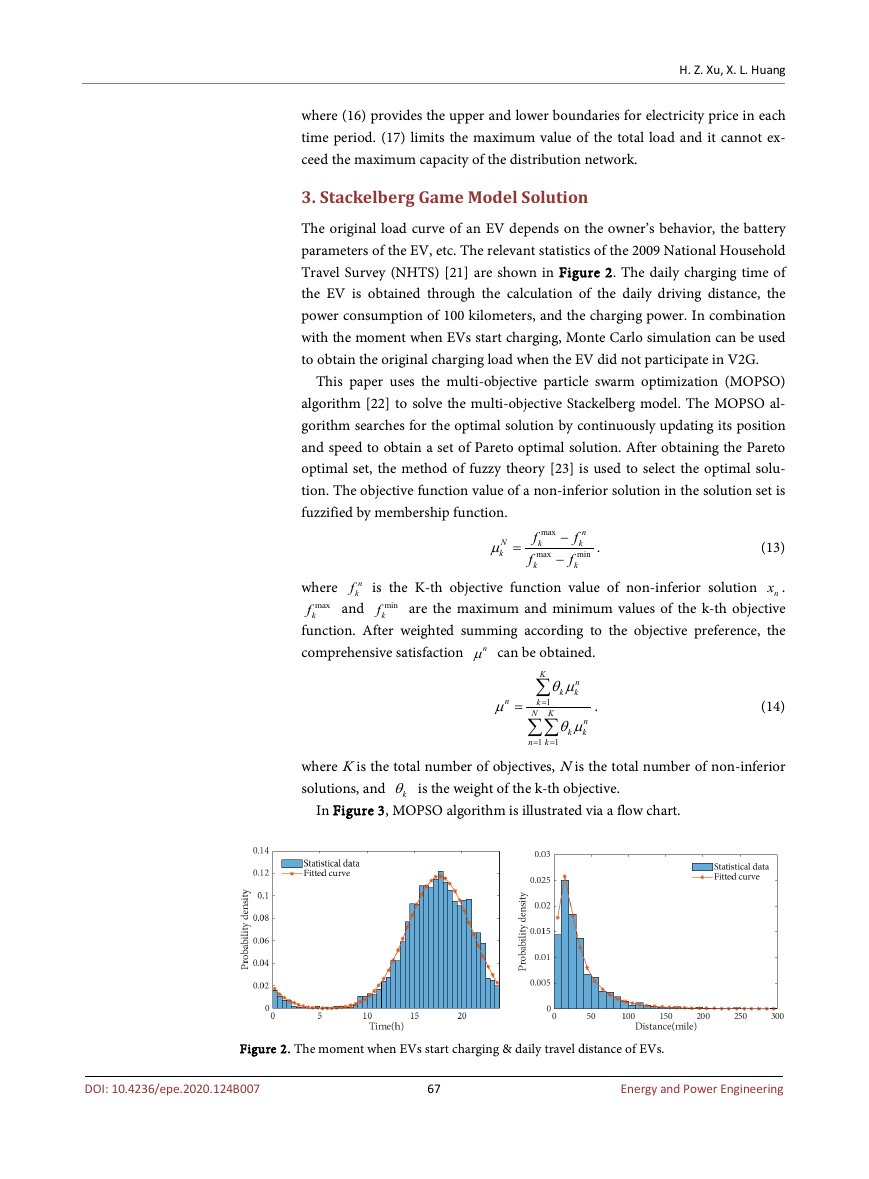
Travel Survey (NHTS) [21] are shown in Figure 2. The daily charging time of
the EV is obtained through the calculation of the daily driving distance, the
power consumption of 100 kilometers, and the charging power. In combination
with the moment when EVs start charging, Monte Carlo simulation can be used
to obtain the original charging load when the EV did not participate in V2G.
This paper uses the multi-objective particle swarm optimization (MOPSO)
algorithm [22] to solve the multi-objective Stackelberg model. The MOPSO al-
gorithm searches for the optimal solution by continuously updating its position
and speed to obtain a set of Pareto optimal solution. After obtaining the Pareto
optimal set, the method of fuzzy theory [23] is used to select the optimal solu-
tion. The objective function value of a non-inferior solution in the solution set is
fuzzified by membership function.
N
µ
k
=
max
f
k
max
k
−
−
f
n
f
k
min
k
f
. (13)
n
kf
and
is the K-th objective function value of non-inferior solution
where
nx .
are the maximum and minimum values of the k-th objective
max
kf
function. After weighted summing according to the objective preference, the
comprehensive satisfaction
nµ can be obtained.
min
kf
n
µ
=
K
n
1
=
k
∑
n
θµ
k
1
k
=
N K
k
∑∑
n
θµ
k
1
=
k
. (14)
where K is the total number of objectives, N is the total number of non-inferior
solutions, and
kθ is the weight of the k-th objective.
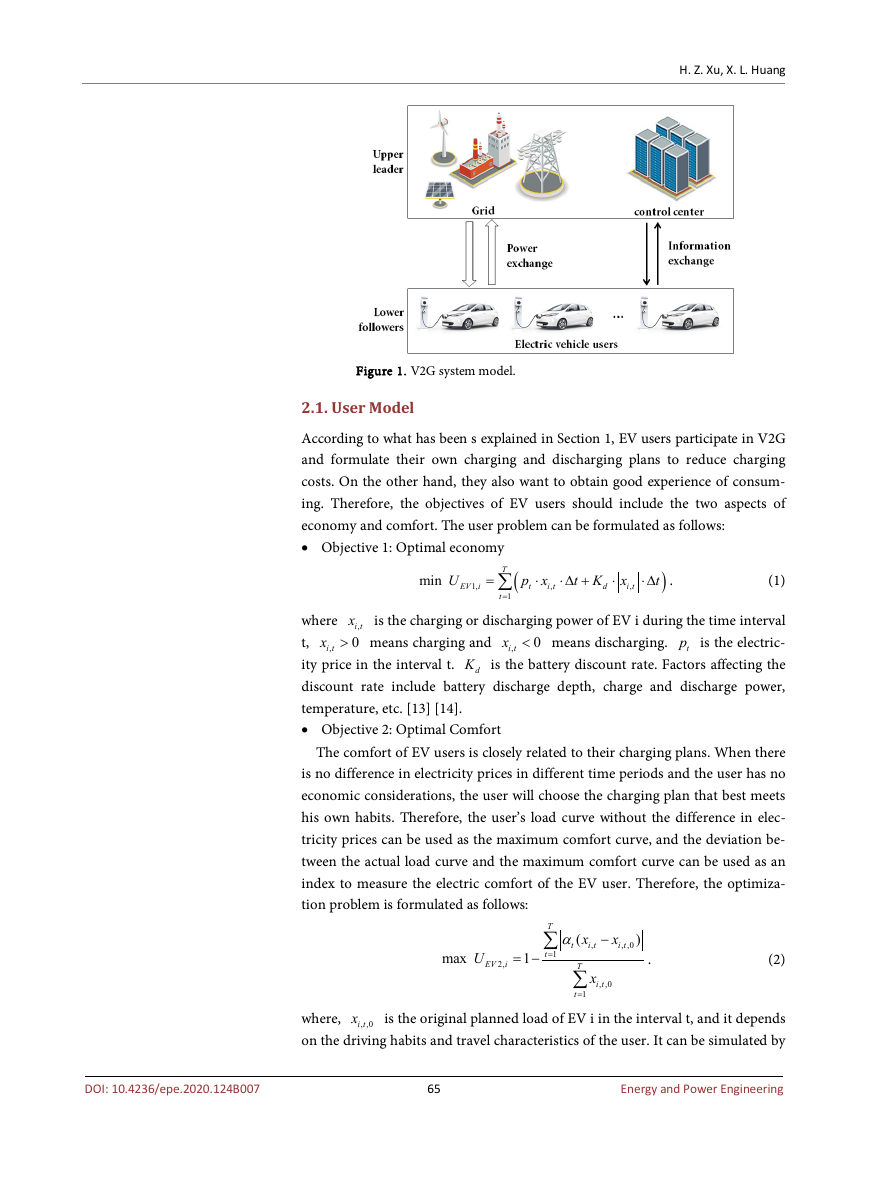
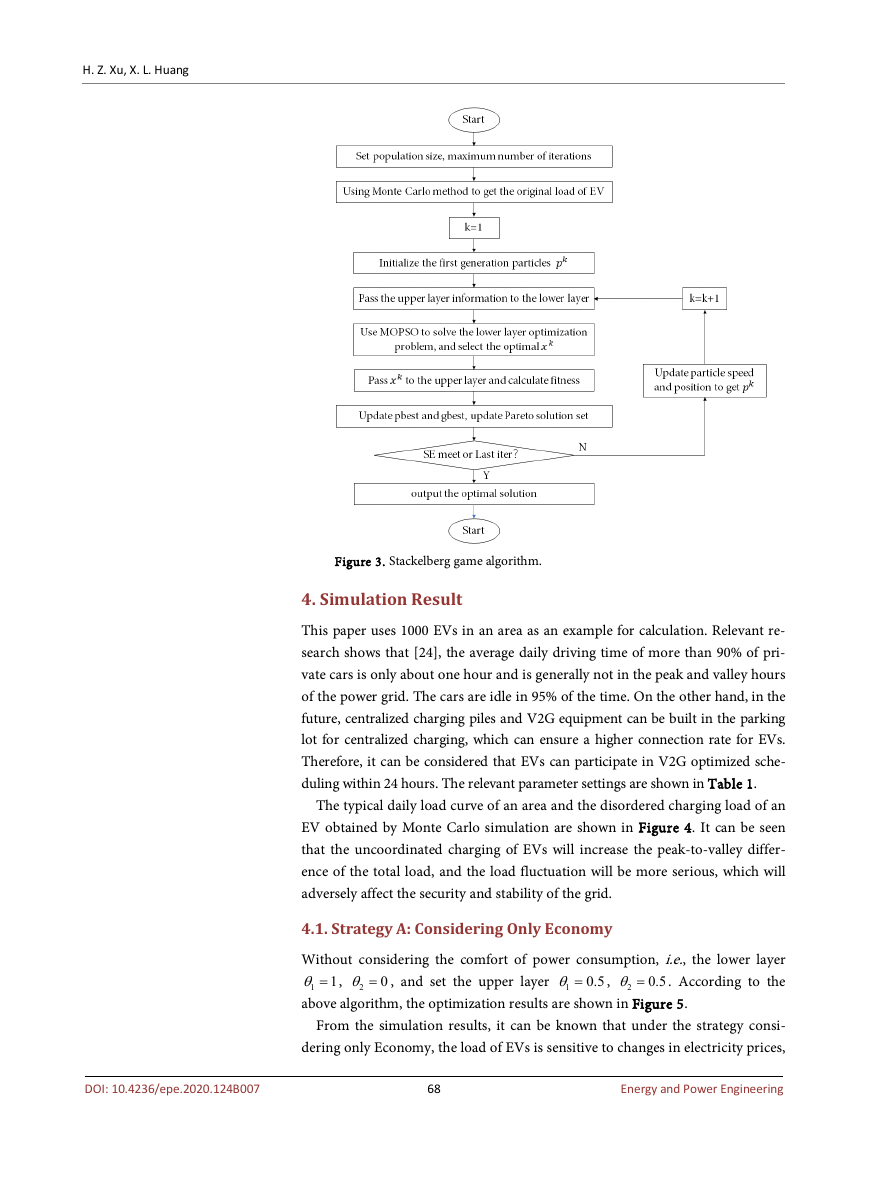
In Figure 3, MOPSO algorithm is illustrated via a flow chart.
Figure 2. The moment when EVs start charging & daily travel distance of EVs.
DOI: 10.4236/epe.2020.124B007
67
Energy and Power Engineering
�
H. Z. Xu, X. L. Huang
Figure 3. Stackelberg game algorithm.
4. Simulation Result
This paper uses 1000 EVs in an area as an example for calculation. Relevant re-
search shows that [24], the average daily driving time of more than 90% of pri-
vate cars is only about one hour and is generally not in the peak and valley hours
of the power grid. The cars are idle in 95% of the time. On the other hand, in the
future, centralized charging piles and V2G equipment can be built in the parking
lot for centralized charging, which can ensure a higher connection rate for EVs.
Therefore, it can be considered that EVs can participate in V2G optimized sche-
duling within 24 hours. The relevant parameter settings are shown in Table 1.
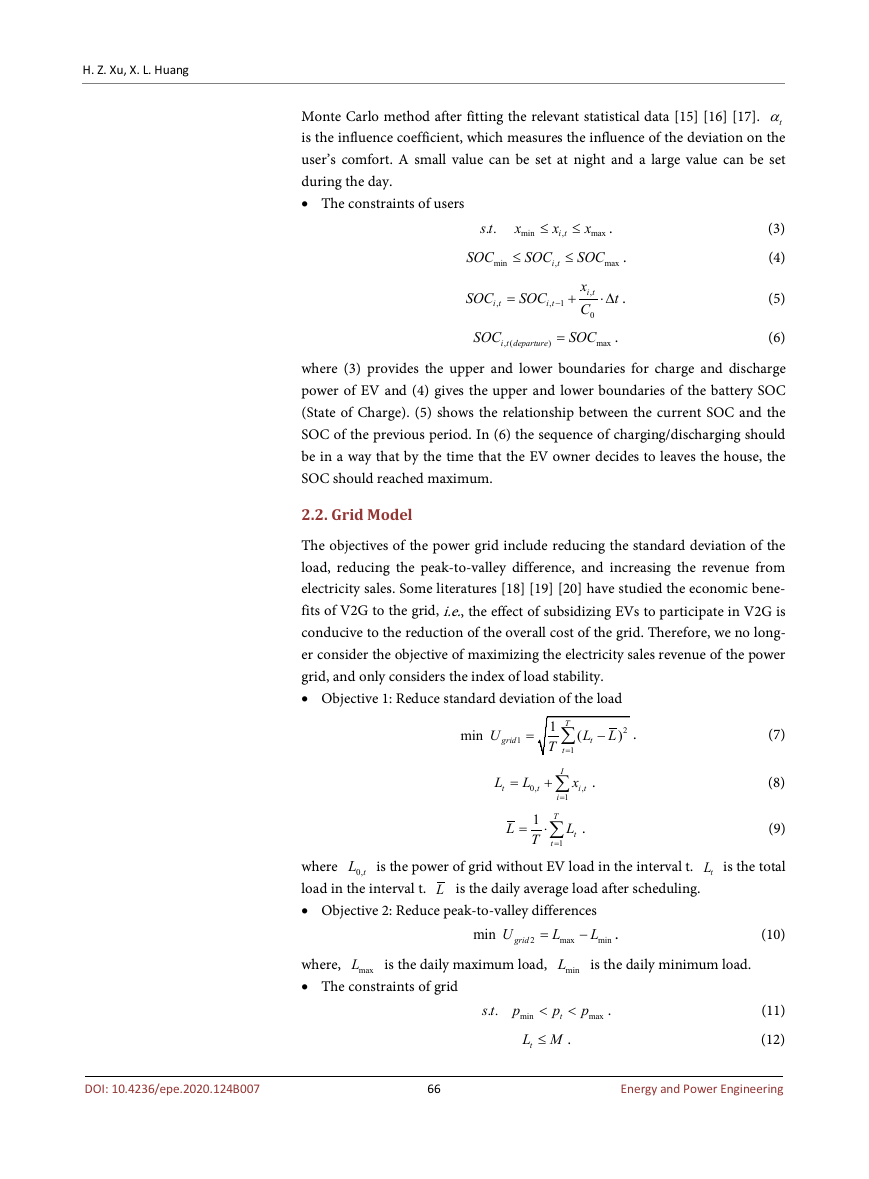
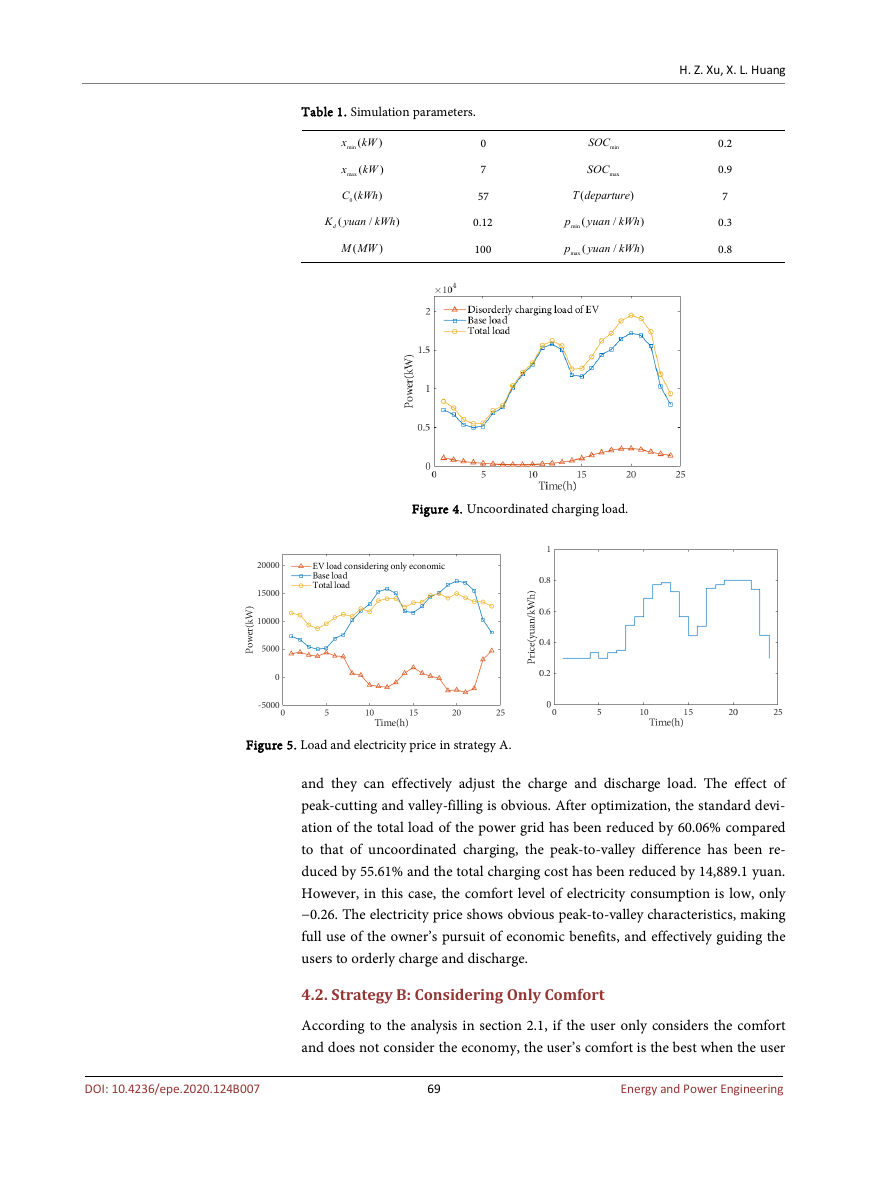
The typical daily load curve of an area and the disordered charging load of an
EV obtained by Monte Carlo simulation are shown in Figure 4. It can be seen
that the uncoordinated charging of EVs will increase the peak-to-valley differ-
ence of the total load, and the load fluctuation will be more serious, which will
adversely affect the security and stability of the grid.
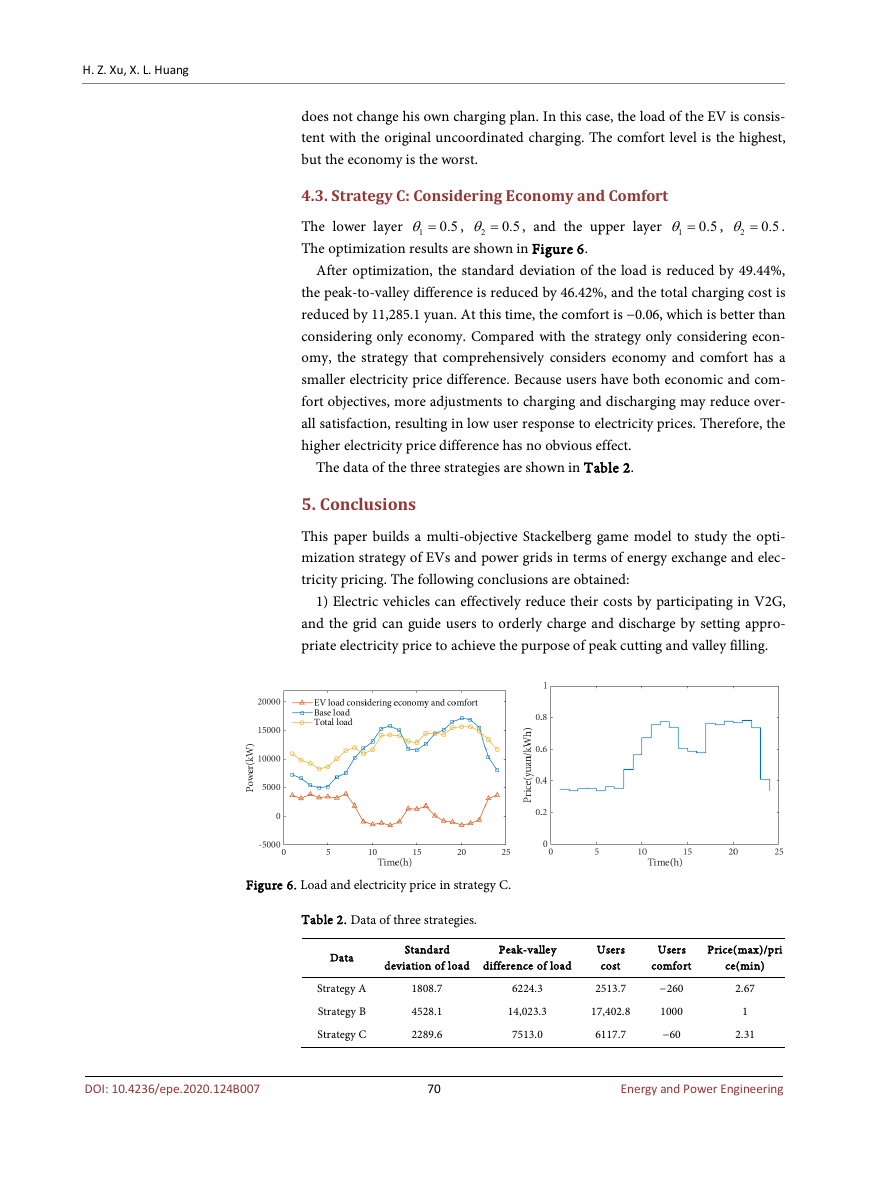
4.1. Strategy A: Considering Only Economy
Without considering the comfort of power consumption, i.e., the lower layer
1θ = ,
. According to the
1
above algorithm, the optimization results are shown in Figure 5.
0θ = , and set the upper layer
2
0.5θ =
1
0.5
,
θ =
2
DOI: 10.4236/epe.2020.124B007
From the simulation results, it can be known that under the strategy consi-
dering only Economy, the load of EVs is sensitive to changes in electricity prices,
68
Energy and Power Engineering
�
Table 1. Simulation parameters.
x
x
min (
)
kW
max (
)
kW
0(
)
C kWh
(
)
M MW
(
/
)
dK yuan kWh
0
7
57
0.12
100
H. Z. Xu, X. L. Huang
0.2
0.9
7
0.3
0.8
min
SOC
SOC
max
(
)
T departure
min (
)
yuan kWh
)
yuan kWh
max (
/
/
p
p
Figure 4. Uncoordinated charging load.
Figure 5. Load and electricity price in strategy A.
and they can effectively adjust the charge and discharge load. The effect of
peak-cutting and valley-filling is obvious. After optimization, the standard devi-
ation of the total load of the power grid has been reduced by 60.06% compared
to that of uncoordinated charging, the peak-to-valley difference has been re-
duced by 55.61% and the total charging cost has been reduced by 14,889.1 yuan.
However, in this case, the comfort level of electricity consumption is low, only
−0.26. The electricity price shows obvious peak-to-valley characteristics, making
full use of the owner’s pursuit of economic benefits, and effectively guiding the
users to orderly charge and discharge.
4.2. Strategy B: Considering Only Comfort
According to the analysis in section 2.1, if the user only considers the comfort
and does not consider the economy, the user’s comfort is the best when the user
69
Energy and Power Engineering
DOI: 10.4236/epe.2020.124B007
�
H. Z. Xu, X. L. Huang
does not change his own charging plan. In this case, the load of the EV is consis-
tent with the original uncoordinated charging. The comfort level is the highest,
but the economy is the worst.
4.3. Strategy C: Considering Economy and Comfort
The lower layer
, and the upper layer
The optimization results are shown in Figure 6.
0.5θ =
1
0.5
θ =
2
,
0.5θ =
1
,
θ =
2
0.5
.
After optimization, the standard deviation of the load is reduced by 49.44%,
the peak-to-valley difference is reduced by 46.42%, and the total charging cost is
reduced by 11,285.1 yuan. At this time, the comfort is −0.06, which is better than
considering only economy. Compared with the strategy only considering econ-
omy, the strategy that comprehensively considers economy and comfort has a
smaller electricity price difference. Because users have both economic and com-
fort objectives, more adjustments to charging and discharging may reduce over-
all satisfaction, resulting in low user response to electricity prices. Therefore, the
higher electricity price difference has no obvious effect.
The data of the three strategies are shown in Table 2.
5. Conclusions
This paper builds a multi-objective Stackelberg game model to study the opti-
mization strategy of EVs and power grids in terms of energy exchange and elec-
tricity pricing. The following conclusions are obtained:
1) Electric vehicles can effectively reduce their costs by participating in V2G,
and the grid can guide users to orderly charge and discharge by setting appro-
priate electricity price to achieve the purpose of peak cutting and valley filling.
Figure 6. Load and electricity price in strategy C.
Table 2. Data of three strategies.
Data
Strategy A
Strategy B
Strategy C
Standard
Peak-valley
deviation of load
difference of load
6224.3
14,023.3
7513.0
1808.7
4528.1
2289.6
70
Users
cost
2513.7
17,402.8
6117.7
Users
comfort
Price(max)/pri
ce(min)
−260
1000
−60
2.67
1
2.31
Energy and Power Engineering
DOI: 10.4236/epe.2020.124B007
�


 2023年江西萍乡中考道德与法治真题及答案.doc
 2012年重庆南川中考生物真题及答案.doc
 2013年江西师范大学地理学综合及文艺理论基础考研真题.doc
 2020年四川甘孜小升初语文真题及答案I卷.doc
 2020年注册岩土工程师专业基础考试真题及答案.doc
 2023-2024学年福建省厦门市九年级上学期数学月考试题及答案.doc
 2021-2022学年辽宁省沈阳市大东区九年级上学期语文期末试题及答案.doc
 2022-2023学年北京东城区初三第一学期物理期末试卷及答案.doc
 2018上半年江西教师资格初中地理学科知识与教学能力真题及答案.doc
 2012年河北国家公务员申论考试真题及答案-省级.doc
 2020-2021学年江苏省扬州市江都区邵樊片九年级上学期数学第一次质量检测试题及答案.doc
 2022下半年黑龙江教师资格证中学综合素质真题及答案.doc