Dynamic Analysis of Hydraulic Systems
Flowmaster USA, Inc.
5750 Old Orchard, Suite 420
Skokie, IL 60077
As automation and precision are becoming more critical in product design, hydraulic
engineers are being asked to do more and more within the constraints of the fluid systems
they design. Hydraulic systems are now taking advantage of new technology such as
miniaturization and computer control systems to achieve results that were unattainable just a
few years ago. These systems are no longer simple system looped systems of the past where
pressure and flow calculations could be done by hand or a simple spreadsheet. Today’s
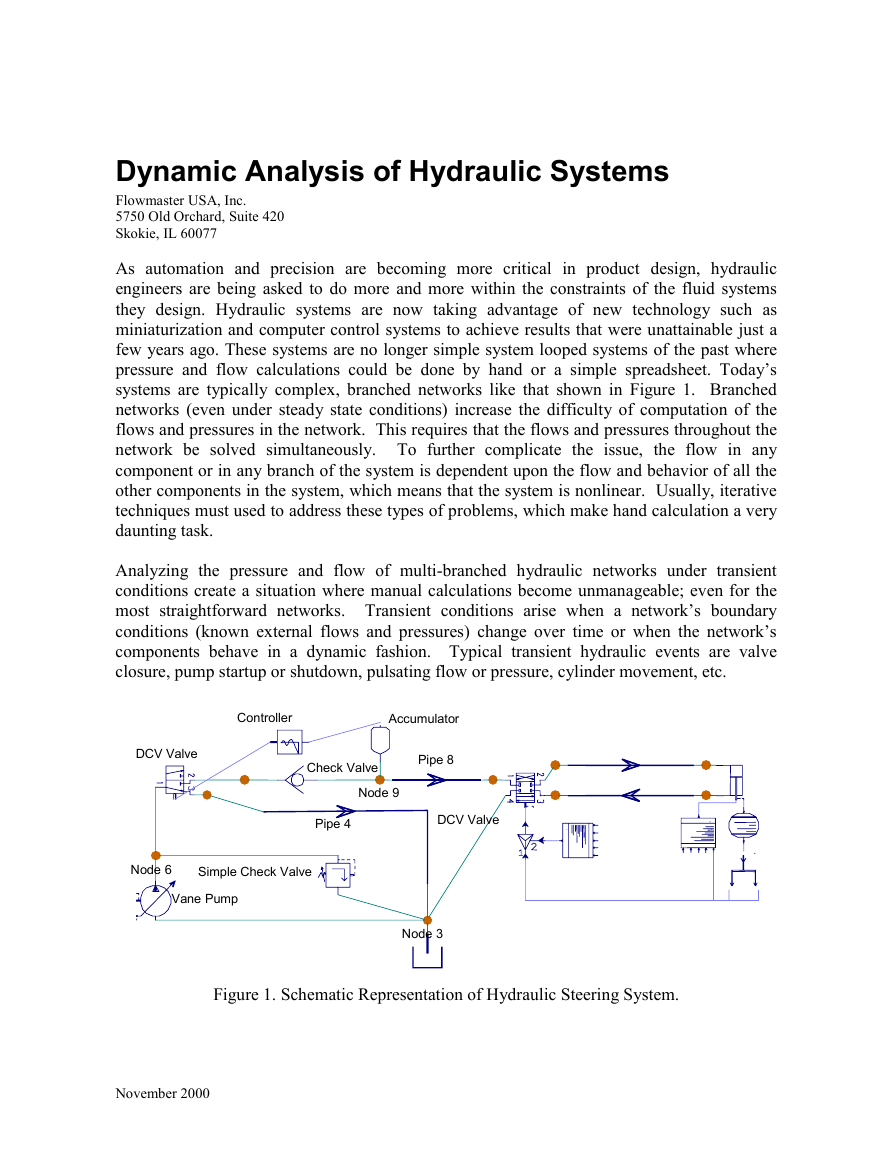
systems are typically complex, branched networks like that shown in Figure 1. Branched
networks (even under steady state conditions) increase the difficulty of computation of the
flows and pressures in the network. This requires that the flows and pressures throughout the
network be solved simultaneously. To further complicate the issue, the flow in any
component or in any branch of the system is dependent upon the flow and behavior of all the
other components in the system, which means that the system is nonlinear. Usually, iterative
techniques must used to address these types of problems, which make hand calculation a very
daunting task.
Analyzing the pressure and flow of multi-branched hydraulic networks under transient
conditions create a situation where manual calculations become unmanageable; even for the
most straightforward networks. Transient conditions arise when a network’s boundary
conditions (known external flows and pressures) change over time or when the network’s
components behave in a dynamic fashion. Typical transient hydraulic events are valve
closure, pump startup or shutdown, pulsating flow or pressure, cylinder movement, etc.
DCV Valve
Controller
Accumulator
Check Valve
Pipe 8
Node 9
Pipe 4
DCV Valve
Node 6
Simple Check Valve
Vane Pump
Node 3
Figure 1. Schematic Representation of Hydraulic Steering System.
November 2000
�
From an analysis perspective, the complex, iterative calculations for transient network
analysis must be carried out through time using short time steps and repeating the complex,
iterative calculations for each time step. Inertial forces, which arise due to changing flow
velocities, must be calculated and carried forward from one time step to the next.
Furthermore, inertial forces may attenuate due to the presence of energy absorbing or
compliant components in the network.
Transient hydraulic system behavior must be fully understood so that the design engineer has
a firm grasp of the performance envelope that each component in the system must meet.
Transient conditions are often the cases that push the limits of the design envelopes. For
example, sudden valve closure may cause pressure surges in long pipes that are an order of
magnitude higher than steady state pressures. Hydraulic systems must also be studied under a
full range of anticipated transient operating conditions. That is, the critical transient condition
for one component may not produce critical conditions in another component.
The benefit of simulation software to engineers is facilitating the performance and
assimilating the results of a huge number of calculations. Engineers can then spend
engineering time evaluating the results of the calculations, not grinding through them.
FLOWMASTER2 allows the engineer to quickly analyze many different scenarios, and
develop a greater understanding of the system.
Network Flow Analysis with FLOWMASTER2
FLOWMASTER2 is an engineering analysis software package designed for the system
analysis of internal fluid flows. FLOWMASTER2 supports the analysis of both steady and
time-dependent flows with or without heat transfer. Analysis of compressible flows is also
supported. FLOWMASTER2 also provides a specialized Fluid Power component library
tailored to the needs of the hydraulics analyst.
The engineer builds a schematic representation of the system of interest using a Graphical
User Interface. The model is constructed from components pulled from a database of
standard components. The GUI provides for quick and easy model construction and
reconfiguration and also for convenient result interrogation. The quantities typically
computed in such network flow analyses are flow rate (volumetric or mass), system pressures,
temperatures, and heat flows.
Hydraulic Systems Analysis with FLOWMASTER2
The versatility of FLOWMASTER2 to analyze a variety of real hydraulic circuits is
demonstrated by the following examples, both of which demonstrate FLOWMASTER2’s
ability to analyze hydraulic circuits under time-varying conditions.
Example 1 - Steering System
A schematic representation of a hydraulic steering system is provided in Figure 1. The
steering system uses an accumulator and a pump as sources of hydraulic power to drive the
steering cylinder.
November 2000
�
This model was prepared for purposes of demonstration, the data used in it is ‘typical’ with
certain simplifications made to better illustrate the system behavior.
This type of hydraulic circuit is very common in fluid power applications where a relatively
inexpensive accumulator acts as the primary power source and is backed up by a pump. The
pumping requirement in this type of circuit is typically smaller than the same circuit without
an accumulator. The pump is used to charge the accumulator when it is not assisting the
accumulator in doing work. Without an accumulator, a larger more expensive pump would be
required to perform all the work and may run idle much of the time.
In this simulation, a controller whose function is to sense the pressure in the accumulator and
adjust the spool position of the directional control valve (DCV) is used to control the flow
from the pump. The controller imposes a spool position, which bypasses pump flow when the
accumulator pressure is at or above200 bar. A full open spool position is invoked when the
accumulator pressure drops below 190 bar with a linear transition between these two points.
This relationship is entered into FLOWMASTER2 using a curve for spool position vs.
pressure.
For this simulation a relationship between pressure drop and flow rate was established using a
digitized curve. Each flow channel in the valve was given the same pressure drop
characteristic. The relationship between spool position and channel area is also specified as a
digitized curve that allowed for the spool to move 20% with zero available flow area. After
the initial opening, the channel area varies proportionally with spool position.
The simulation was conducted for a period of one second. The analysis start time is taken at t
= 0 and runs until t = 1 second. The specified time step is 0.05 sec., which results in 20 time
steps.
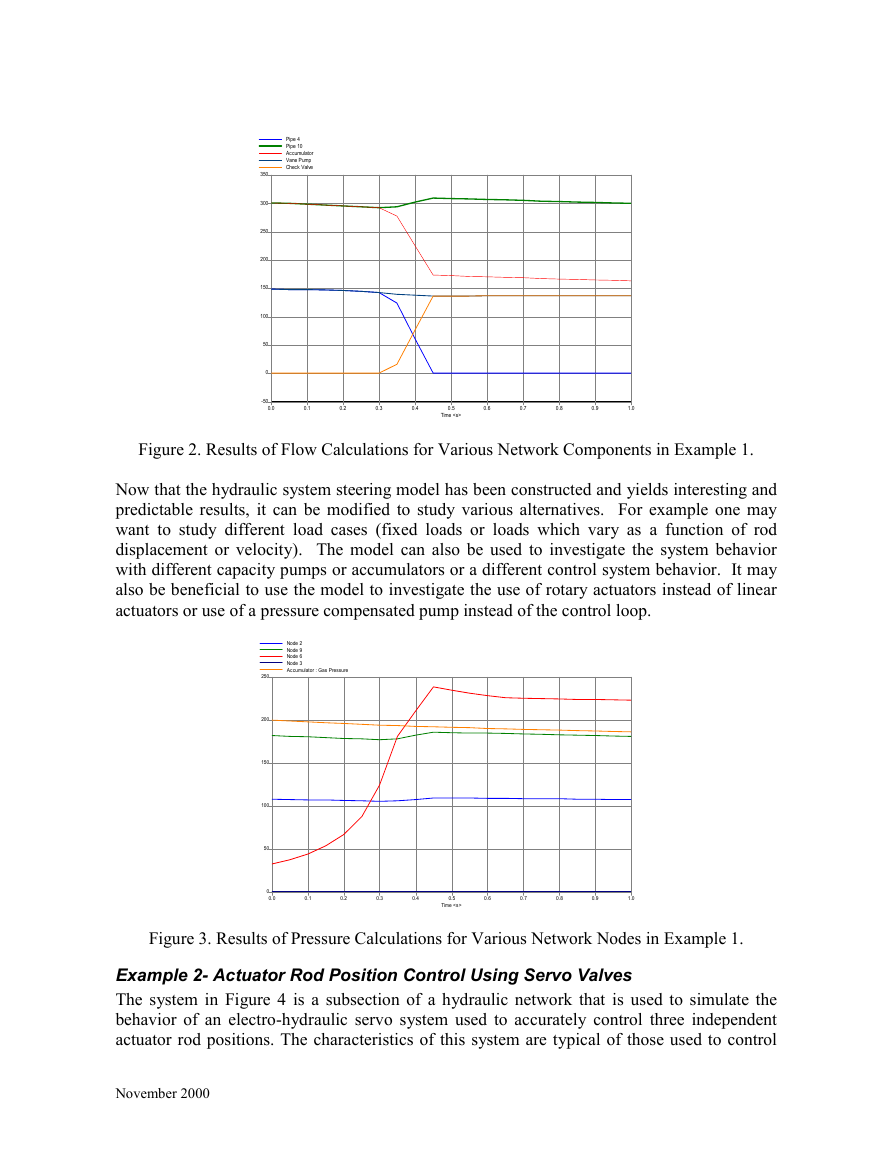
Figure 2 provides network results volumetric at interesting points in the network. The
pressure plot illustrates that until approximately 0.4 sec. into the simulation, the accumulator
pressure is greater than 200 bar. Therefore, all the pump flow is dumped back to the reservoir
because the DCV that regulates this flow is set to change positions when the accumulator
pressure falls below 200 bar. All the accumulator flow is delivered to the head end of the
cylinder. As the accumulator pressure decreases due to discharge, the DCV’s spool starts to
deliver pump flow to the cylinder. At approximately 0.6 sec into the simulation the
accumulator flow is reduced and assisted by the pump to ensure that the cylinder is extending.
It can also be seen from Figure 2 that as the pump flow is delivered to the system through the
check valve, the return flow to the reservoir is reduced to zero.
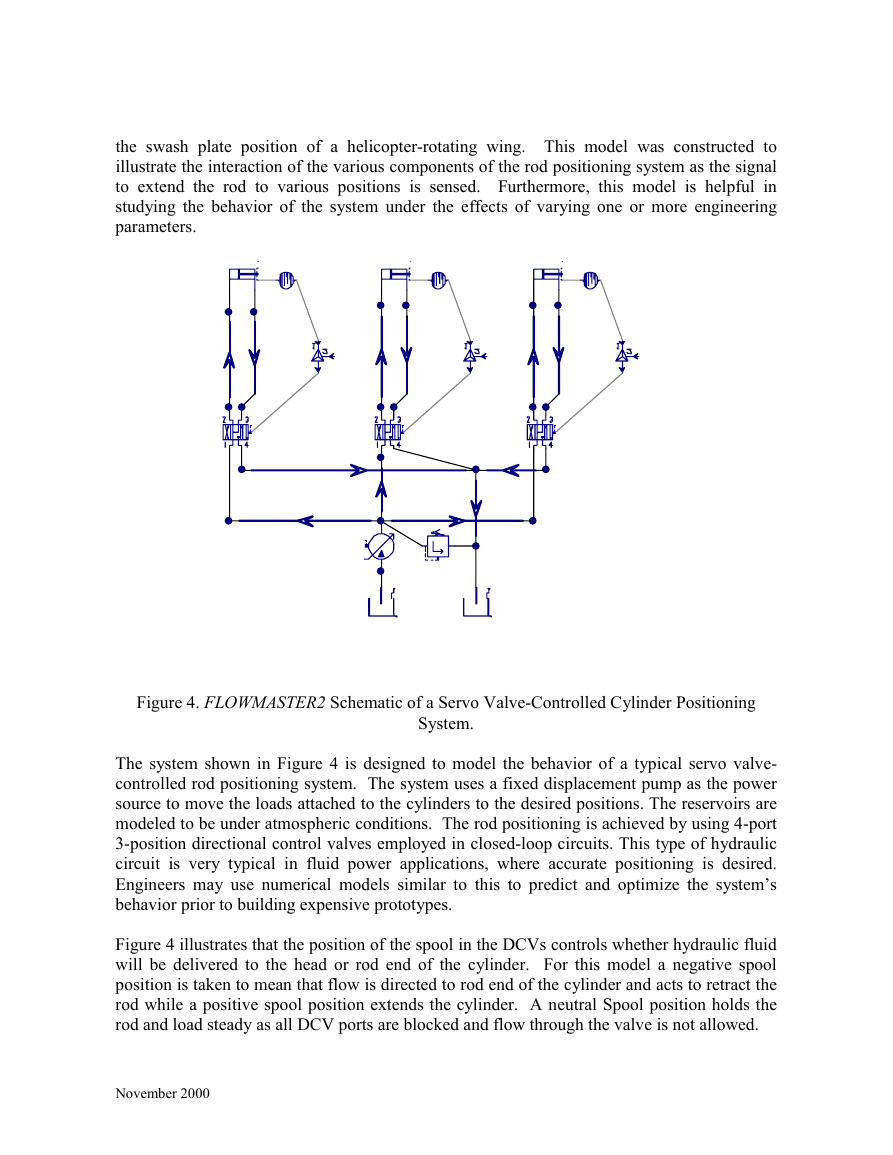
The pressures at the head end of cylinder and reservoir are nearly constant throughout the
transient as one might expect as shown in Figure 3. However, as the pump flow is directed
from the tank back into the system, the pump discharge pressure increases to ensure delivery
of the required flow as assisted by the accumulator against the head end of the cylinder.
November 2000
�
0.5
Time
0.6
0.7
0.8
0.9
1.0
Figure 2. Results of Flow Calculations for Various Network Components in Example 1.
Now that the hydraulic system steering model has been constructed and yields interesting and
predictable results, it can be modified to study various alternatives. For example one may
want to study different load cases (fixed loads or loads which vary as a function of rod
displacement or velocity). The model can also be used to investigate the system behavior
with different capacity pumps or accumulators or a different control system behavior. It may
also be beneficial to use the model to investigate the use of rotary actuators instead of linear
actuators or use of a pressure compensated pump instead of the control loop.
Pipe 4
Pipe 10
Accumulator
Vane Pump
Check Valve
350
300
250
200
150
100
50
0
-50
0.0
0.1
0.2
0.3
0.4
Node 2
Node 9
Node 6
Node 3
Accumulator : Gas Pressure
250
200
150
100
50
0
0.0
0.1
0.2
0.3
0.4
0.6
0.7
0.8
0.9
1.0
0.5
Time
Figure 3. Results of Pressure Calculations for Various Network Nodes in Example 1.
Example 2- Actuator Rod Position Control Using Servo Valves
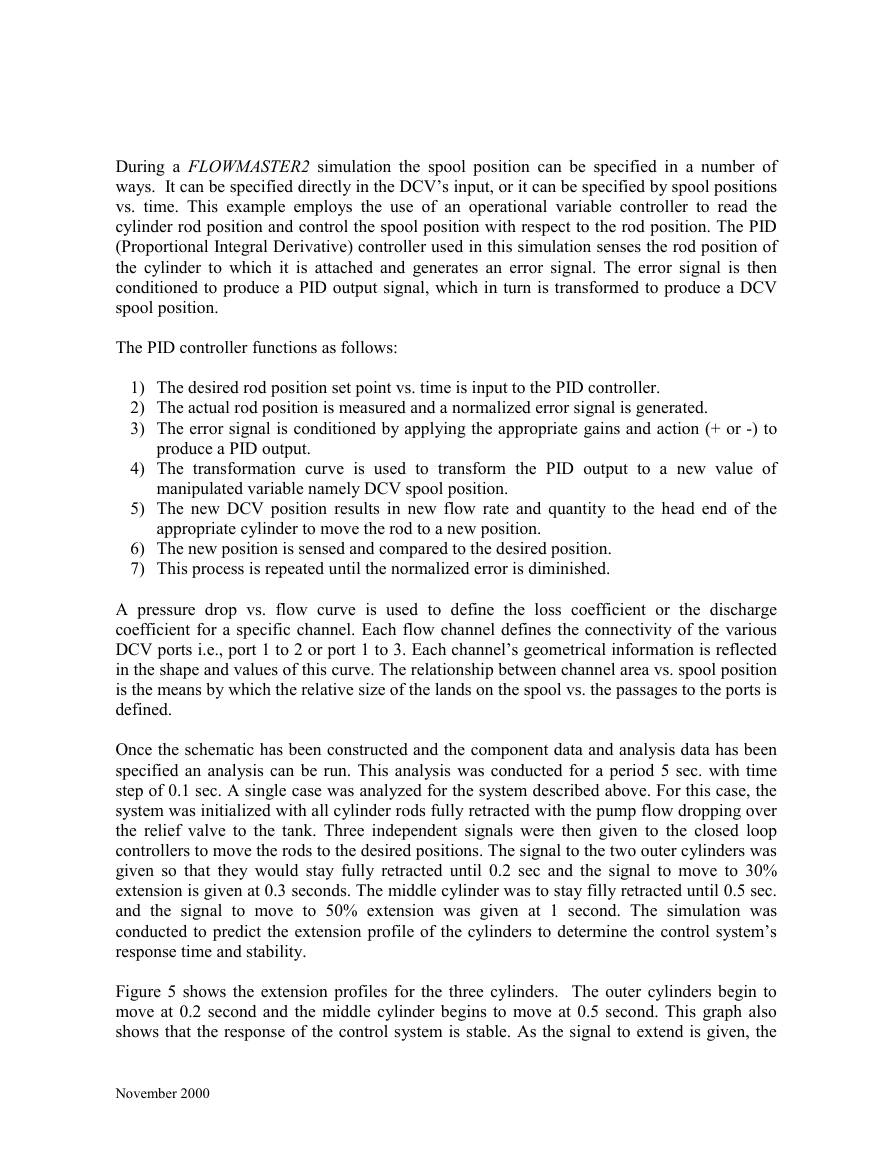
The system in Figure 4 is a subsection of a hydraulic network that is used to simulate the
behavior of an electro-hydraulic servo system used to accurately control three independent
actuator rod positions. The characteristics of this system are typical of those used to control
November 2000
�
Figure 4. FLOWMASTER2 Schematic of a Servo Valve-Controlled Cylinder Positioning
System.
the swash plate position of a helicopter-rotating wing. This model was constructed to
illustrate the interaction of the various components of the rod positioning system as the signal
to extend the rod to various positions is sensed. Furthermore, this model is helpful in
studying the behavior of the system under the effects of varying one or more engineering
parameters.
The system shown in Figure 4 is designed to model the behavior of a typical servo valve-
controlled rod positioning system. The system uses a fixed displacement pump as the power
source to move the loads attached to the cylinders to the desired positions. The reservoirs are
modeled to be under atmospheric conditions. The rod positioning is achieved by using 4-port
3-position directional control valves employed in closed-loop circuits. This type of hydraulic
circuit is very typical in fluid power applications, where accurate positioning is desired.
Engineers may use numerical models similar to this to predict and optimize the system’s
behavior prior to building expensive prototypes.
Figure 4 illustrates that the position of the spool in the DCVs controls whether hydraulic fluid
will be delivered to the head or rod end of the cylinder. For this model a negative spool
position is taken to mean that flow is directed to rod end of the cylinder and acts to retract the
rod while a positive spool position extends the cylinder. A neutral Spool position holds the
rod and load steady as all DCV ports are blocked and flow through the valve is not allowed.
November 2000
�
During a FLOWMASTER2 simulation the spool position can be specified in a number of
ways. It can be specified directly in the DCV’s input, or it can be specified by spool positions
vs. time. This example employs the use of an operational variable controller to read the
cylinder rod position and control the spool position with respect to the rod position. The PID
(Proportional Integral Derivative) controller used in this simulation senses the rod position of
the cylinder to which it is attached and generates an error signal. The error signal is then
conditioned to produce a PID output signal, which in turn is transformed to produce a DCV
spool position.
The PID controller functions as follows:
1) The desired rod position set point vs. time is input to the PID controller.
2) The actual rod position is measured and a normalized error signal is generated.
3) The error signal is conditioned by applying the appropriate gains and action (+ or -) to
produce a PID output.
4) The transformation curve is used to transform the PID output to a new value of
manipulated variable namely DCV spool position.
5) The new DCV position results in new flow rate and quantity to the head end of the
appropriate cylinder to move the rod to a new position.
6) The new position is sensed and compared to the desired position.
7) This process is repeated until the normalized error is diminished.
A pressure drop vs. flow curve is used to define the loss coefficient or the discharge
coefficient for a specific channel. Each flow channel defines the connectivity of the various
DCV ports i.e., port 1 to 2 or port 1 to 3. Each channel’s geometrical information is reflected
in the shape and values of this curve. The relationship between channel area vs. spool position
is the means by which the relative size of the lands on the spool vs. the passages to the ports is
defined.
Once the schematic has been constructed and the component data and analysis data has been
specified an analysis can be run. This analysis was conducted for a period 5 sec. with time
step of 0.1 sec. A single case was analyzed for the system described above. For this case, the
system was initialized with all cylinder rods fully retracted with the pump flow dropping over
the relief valve to the tank. Three independent signals were then given to the closed loop
controllers to move the rods to the desired positions. The signal to the two outer cylinders was
given so that they would stay fully retracted until 0.2 sec and the signal to move to 30%
extension is given at 0.3 seconds. The middle cylinder was to stay filly retracted until 0.5 sec.
and the signal to move to 50% extension was given at 1 second. The simulation was
conducted to predict the extension profile of the cylinders to determine the control system’s
response time and stability.
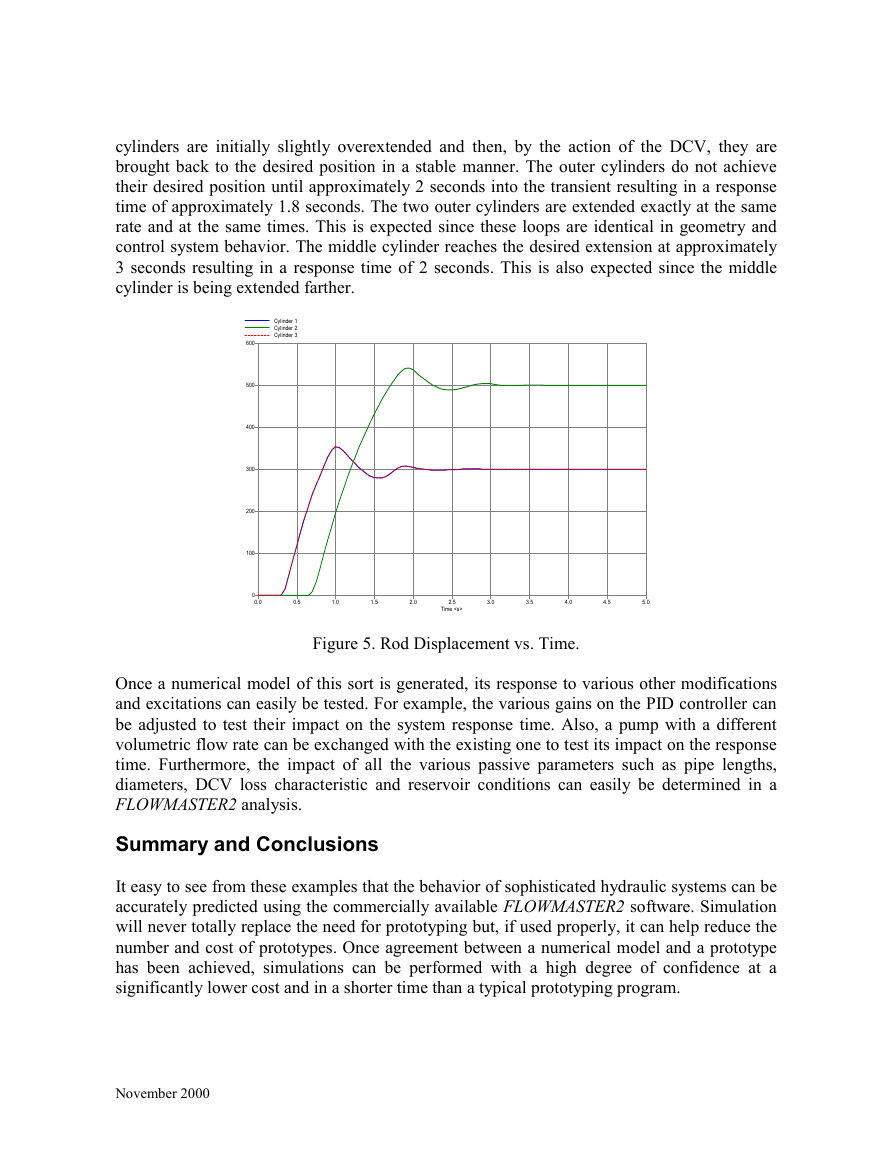
Figure 5 shows the extension profiles for the three cylinders. The outer cylinders begin to
move at 0.2 second and the middle cylinder begins to move at 0.5 second. This graph also
shows that the response of the control system is stable. As the signal to extend is given, the
November 2000
�
cylinders are initially slightly overextended and then, by the action of the DCV, they are
brought back to the desired position in a stable manner. The outer cylinders do not achieve
their desired position until approximately 2 seconds into the transient resulting in a response
time of approximately 1.8 seconds. The two outer cylinders are extended exactly at the same
rate and at the same times. This is expected since these loops are identical in geometry and
control system behavior. The middle cylinder reaches the desired extension at approximately
3 seconds resulting in a response time of 2 seconds. This is also expected since the middle
cylinder is being extended farther.
Cylinder 1
Cylinder 2
Cylinder 3
600
500
400
300
200
100
0
0.0
0.5
1.0
1.5
2.0
2.5
Time
3.0
3.5
4.0
4.5
5.0
Figure 5. Rod Displacement vs. Time.
Once a numerical model of this sort is generated, its response to various other modifications
and excitations can easily be tested. For example, the various gains on the PID controller can
be adjusted to test their impact on the system response time. Also, a pump with a different
volumetric flow rate can be exchanged with the existing one to test its impact on the response
time. Furthermore, the impact of all the various passive parameters such as pipe lengths,
diameters, DCV loss characteristic and reservoir conditions can easily be determined in a
FLOWMASTER2 analysis.
Summary and Conclusions
It easy to see from these examples that the behavior of sophisticated hydraulic systems can be
accurately predicted using the commercially available FLOWMASTER2 software. Simulation
will never totally replace the need for prototyping but, if used properly, it can help reduce the
number and cost of prototypes. Once agreement between a numerical model and a prototype
has been achieved, simulations can be performed with a high degree of confidence at a
significantly lower cost and in a shorter time than a typical prototyping program.
November 2000
�
REFERENCES
1. FLOWMASTER V6.02, Fluid Power Technical Guide. 2000.
2. Anthony Esposito; Fluid Power With Applications, Second Edition. Copyright 1988 Prentice-
Hall.
November 2000
�




 2023年江西萍乡中考道德与法治真题及答案.doc
 2012年重庆南川中考生物真题及答案.doc
 2013年江西师范大学地理学综合及文艺理论基础考研真题.doc
 2020年四川甘孜小升初语文真题及答案I卷.doc
 2020年注册岩土工程师专业基础考试真题及答案.doc
 2023-2024学年福建省厦门市九年级上学期数学月考试题及答案.doc
 2021-2022学年辽宁省沈阳市大东区九年级上学期语文期末试题及答案.doc
 2022-2023学年北京东城区初三第一学期物理期末试卷及答案.doc
 2018上半年江西教师资格初中地理学科知识与教学能力真题及答案.doc
 2012年河北国家公务员申论考试真题及答案-省级.doc
 2020-2021学年江苏省扬州市江都区邵樊片九年级上学期数学第一次质量检测试题及答案.doc
 2022下半年黑龙江教师资格证中学综合素质真题及答案.doc