Quantitative Analysis of High-Frequency Oscillations (80
500 Hz) Recorded in Human Epileptic Hippocampus and
Entorhinal Cortex
Richard J. Staba, Charles L. Wilson, Anatol Bragin, Itzhak Fried and Jerome Engel, Jr
J Neurophysiol
88:1743-1752, 2002. ;
You might find this additional info useful...
This article cites
41 articles, 14 of which you can access for free at:
http://jn.physiology.org/content/88/4/1743.full#ref-list-1
This article has been cited by
37 other HighWire-hosted articles:
http://jn.physiology.org/content/88/4/1743#cited-by
Updated information and services
including high resolution figures, can be found at:
http://jn.physiology.org/content/88/4/1743.full
Additional material and information
about
http://www.the-aps.org/publications/jn
Journal of Neurophysiology
can be found at:
This information is current as of January 3, 2013.
l
D
o
w
n
o
a
d
e
d
f
r
o
m
h
t
t
p
:
/
/
j
.
n
p
h
y
s
o
o
g
y
.
i
l
o
r
g
/
b
y
g
u
e
s
t
o
n
J
a
n
u
a
r
y
3
,
2
0
1
3
Journal of Neurophysiology
publishes original articles on the function of the nervous system. It is published 12
times a year (monthly) by the American Physiological Society, 9650 Rockville Pike, Bethesda MD 20814-3991.
Copyright © 2002 The American Physiological Society. ISSN: 0022-3077, ESSN: 1522-1598. Visit our website at
http://www.the-aps.org/.
-
�
J Neurophysiol
88: 1743–1752, 2002; 10.1152/jn.00322.2002.
Quantitative Analysis of High-Frequency Oscillations (80 –500 Hz)
Recorded in Human Epileptic Hippocampus and Entorhinal Cortex
RICHARD J. STABA,1 CHARLES L. WILSON,2,4 ANATOL BRAGIN,2,4 ITZHAK FRIED,3,4 AND
JEROME ENGEL, JR
Departments of 1Neurobiology, 2Neurology, and 3Neurosurgery and 4The Brain Research Institute, David Geffen School of
Medicine at UCLA, Los Angeles, California 90095
1,2,4
Received 1 May 2002; accepted in final form 25 June 2002
Staba, Richard J., Charles L. Wilson, Anatol Bragin, Itzhak
Fried, and Jerome Engel, Jr. Quantitative analysis of high-fre-
quency oscillations (80 –500 Hz) recorded in human epileptic hip-
pocampus and entorhinal cortex. J Neurophysiol 88: 1743–1752,
2002; 10.1152/jn.00322.2002. High-frequency oscillations (100 –200
Hz), termed ripples, have been identified in hippocampal (Hip) and
entorhinal cortical (EC) areas of rodents and humans. In contrast,
higher-frequency oscillations (250 –500 Hz), termed fast ripples (FR),
have been described in seizure-generating limbic areas of rodents
made epileptic by intrahippocampal
injection of kainic acid and
observed in humans ipsilateral to areas of seizure initiation. However,
quantitative studies supporting the existence of two spectrally distinct
oscillatory events have not been carried out in humans nor has the
preferential appearance of FR within seizure generating areas received
statistical evaluation based on analysis of a large sample of oscillatory
events. Interictal oscillations within the bandwidth of 80 –500 Hz were
detected in Hip and EC areas of patients with mesial temporal lobe
epilepsy using wideband EEG recorded during non-rapid eye-move-
ment sleep from chronically implanted depth electrodes. Power spec-
tral analysis showed that oscillations detected from Hip and EC areas
were composed of two spectrally distinct groups. The lower-fre-
quency ripple group was defined by a frequency of 96 ⫾ 14 Hz
(median ⫾ width), while the higher-frequency FR group had a fre-
quency of 262 ⫾ 59 Hz. FR oscillations were significantly shorter in
duration compared with ripple oscillations (P ⬍ 0.0001). In regard to
the occurrence of FR and ripples in epileptic Hip and EC, the mean
ratio of the number of FR to ripples generated in areas ipsilateral to
seizure onset was significantly higher compared with the mean ratio of
FR to ripple generation from contralateral areas (P ⫽ 0.008). Further-
more, sites ipsilateral to seizure onset with hippocampal atrophy had
significantly higher ratios compared with sites contralateral to both
seizure onset and hippocampal atrophy (P ⫽ 0.001). These data
provide compelling quantitative and statistical evidence for the exis-
tence of two spectrally distinct groups of limbic oscillations that have
frequency and duration characteristics similar to those previously
described in epileptic rat and human Hip and EC. The strong associ-
ation between FR and regions of seizure initiation supports the view
that FR reflects pathological hypersynchronous events crucially asso-
ciated with seizure genesis.
I N T R O D U C T I O N
Increasing interest surrounds the investigation of fast oscil-
lations (⬎80 Hz) and their putative functional role in neural
processes. Studies have shown that oscillations within the
range of 100 to 200 Hz, termed “ripples,” are present in
non-primate hippocampus (Hip) and entorhinal cortex (EC)
(Buzsaki et al. 1992; Suzuki and Smith 1988). Ripple oscilla-
tions have also been recorded in neocortical areas of rodents
(Kandel and Buzsaki 1997) and cats (Grenier et al. 2001). The
discrete nature of these events, possessing durations between
25 and 75 ms (Chrobak and Buzsaki 1996), and the variation of
their occurrence across sleep/waking states have led some to
suggest that ripples may be involved in hippocampal and
neocortical wide-area networks associated with memory pro-
cessing (Buzsaki 1998; Chrobak and Buzsaki 1996; Grenier et
al. 2001; Siapas and Wilson 1998). In addition, somatosensory-
evoked oscillations (⬎200 Hz) have been recorded in both
rodent and human somatosensory cortex and presumably re-
flect the coordinated discharge of neurons involved with the
processing of incoming sensory information (Curio et al. 1994;
Jones and Barth 1999; Jones et al. 2000).
In contrast to the physiologically normal fast oscillatory
activity described in the preceding text, high-frequency activity
has been recorded preceding the onset of seizures in epileptic
patients (Fisher et al. 1992) and the oscillatory characteristics
of such activity described (Traub et al. 2001). Two recent
papers have identified the presence of high-frequency oscilla-
tions in Hip and EC areas of patients with temporal lobe
epilepsy (Bragin et al. 1999a,b). Results from these studies
showed that ripple oscillations were present bilaterally and
possessed many characteristics similar to those found in non-
primates, although they were of a lower frequency (80 –160
Hz) than non-primate ripples. In addition to ripples, Bragin and
colleagues reported the occurrence of local field oscillations
that displayed higher spectral frequencies compared with rip-
ples and termed these oscillations “fast ripples” (FR; 250 –500
Hz). This higher-frequency FR was limited to Hip and EC
areas ipsilateral to the area of seizure onset in humans; this was
consistent with the distribution of FR found only within sites
adjacent to the kindled or excitotoxic lesion in epileptic rodents
(Bragin et al. 1999a,b). These findings led to the proposal that
FR were pathological and reflected the hypersynchronous dis-
charge of locally interconnected principle neurons within epi-
Address for reprint requests: C. L. Wilson, 2155 Reed Neurological Re-
search Center, 710 Westwood Plaza, UCLA School of Medicine, Los Angeles,
CA 90095 (E-mail: clwilson@ucla.edu).
The costs of publication of this article were defrayed in part by the payment
of page charges. The article must therefore be hereby marked ‘‘advertisement’’
in accordance with 18 U.S.C. Section 1734 solely to indicate this fact.
www.jn.org
0022-3077/02 $5.00 Copyright © 2002 The American Physiological Society
1743
l
D
o
w
n
o
a
d
e
d
f
r
o
m
h
t
t
p
:
/
/
j
.
n
p
h
y
s
o
o
g
y
.
i
l
o
r
g
/
b
y
g
u
e
s
t
o
n
J
a
n
u
a
r
y
3
,
2
0
1
3
�
1744
STABA, WILSON, BRAGIN, FRIED, AND ENGEL
leptogenic areas capable of generating spontaneous seizures
(Bragin et al. 1999b, 2000).
To further study human high-frequency oscillations (HFOs),
we used a quantitative approach to address the following
questions: first, is there statistical evidence supporting distinct
modal oscillation frequencies within the frequency band of
80 –500 Hz? Second, are there differences other than spectral
frequency, e.g., duration,
that distinguish these oscillatory
events? Third, are some oscillations limited to seizure gener-
ating areas? To answer these questions, we studied HFOs in
patients that were surgically implanted with depth electrodes
required for localization of the epileptogenic region. Interictal
wideband EEG was recorded from Hip and EC areas during
overnight polysomnographic sleep studies. HFOs were de-
tected from the sleep EEG recordings using automated tech-
niques and each oscillation was characterized by its peak
spectral frequency, duration, and proximity to seizure-generat-
ing areas.
M E T H O D S
Subjects
Patients with medically intractable complex partial seizures were
implanted with intracerebral clinical depth electrodes for localization
of seizure onset area because noninvasive testing suggested focal
seizure onsets but results were inconclusive. Prior to depth electrode
implantation, patients gave their informed consent for participation in
these research studies under the approval of the Internal Review
Board of the UCLA Office for Protection of Research Subjects. Each
patient was surgically implanted with 8 –14 flexible polyurethane
clinical depth electrodes stereotactically targeted to clinically relevant
brain areas. EEG from these electrodes was continuously monitored
on the telemetry unit for an average of 2 wk to find those brain areas
in which spontaneous seizure activity began first (Fried et al. 1999).
Patients in whom a seizure onset area could be localized became
candidates for surgical removal of epileptogenic sites if resection of
the area would not produce unacceptable neurological deficit.
Classification of recording site pathology
Identification of the epileptogenic region was based primarily on
criteria from electrographic seizure recordings and neuroimaging (En-
gel 1996). Electrographic seizure onsets were recorded during the
patient’s depth electrode telemetry monitoring, and attending neurol-
ogists in the UCLA Seizure Disorders Center identified locations of
seizure onset based on the recording of multiple seizure occurrences
during the average 2 wk the patients spent in the hospital. In addition,
attending neurologists evaluated each patient’s fluorodeoxyglucose
positron emission tomography scans (FDG-PET) for the presence or
absence of areas of hypometabolism and its predominant location. A
single neuroradiologist at UCLA evaluated every patient’s magnetic
resonance imaging (MRI) scans for the presence or absence of hip-
pocampal atrophy and its location as part of the clinical evaluation.
Recording sites were defined as “ipsilateral” if located in the same
hemisphere as areas where seizure onsets occurred. All Hip and EC
recording sites in patients (n ⫽ 5) with bilateral ictal onsets were
considered ipsilateral to seizure onset. Recording sites were defined as
“contralateral” if located in the hemisphere opposite to that of seizure
initiation.
Electrodes and localization
Wideband EEG was recorded from bundles of nine platinum-
iridium microwires, which were inserted through the lumen of the
seven-contact clinical depth electrodes (1.25-mm diam), so that they
extended 3–5 mm beyond the tip of the clinical electrode (Fried et al.
1999). Microwires were 40 m in diameter with impedances ranging
from 200 to 500 k⍀. Electrode tips were localized using the combined
information from postimplant computed tomography (CT) scans co-
registered with preimplant 1.5T MRI scans (Staba et al. 2002). The
imaging software used (Brain Navigator, Grass-Telefactor, Philadel-
phia, PA) allowed for visualization and highlighting of electrode tip
locations on CT that were automatically registered to the MRI scans.
Anatomical boundaries were based on references of mesial temporal
lobe anatomy by Duvernoy (1998) and Amaral and Insausti (1990).
Only microwires verified as located in Hip and EC were used in
analyses.
Sleep studies
Sleep studies were conducted on the hospital ward between the
hours of 10 PM and 7 AM. A sleep record was acquired for each patient
to correlate behavioral state with the concurrently recorded wideband
EEG. The sleep record consisted of two electro-ocular channels to
monitor eye movements, two electromyogram channels recording
from the patient’s chin to monitor muscle tone, and two EEG channels
recording from International 10 –20 System positions C3 and C4 (5–10
cm left and right, respectively, of midline at the skull vertex, depend-
ing on cranial size), each referenced to a contralateral auricle site, to
monitor neocortical activity (Jasper 1958). The recording was staged
according to the criteria of Rechtschaffen and Kales (1968) with
stages labeled as waking (Aw), nonrapid eye-movement (NREM)
sleep stages 1– 4, and rapid eye-movement (REM) sleep. Episodes of
Aw consisted of patients lying in bed and either sitting quietly with
their eyes opened or engaged in quiet conversation with one of the
investigators. Because the objective of our study was to characterize
HFO activity in relation to areas of epileptogenicity, and the highest
probability of HFO occurrence coincides with NREM episodes (Bra-
gin et al. 1999a; Buzsaki et al. 1992; Suzuki and Smith 1988), the
current paper is limited to the analysis of HFOs that occurred during
episodes of NREM sleep i.e., stages 1– 4.
High-frequency recordings and signal analysis
For each patient (n ⫽ 25), 16 channels of wideband (0.1 Hz to 5
kHz) interictal EEG were sampled from intracerebral microwires at 10
kHz with 12-bit precision using an R. C. Electronics EGAA acquisi-
tion system (Santa Barbara, CA). A 10-min NREM sleep-staged
epoch of wideband EEG was visually inspected for the presence of
HFO activity previously described within the non-primate and human
entorhinal-hippocampus axis (Bragin et al. 1999b; Buzsaki et al.
1992; O’Keefe and Nadel 1978). Channels demonstrating oscillations
with large amplitude sinusoid-like waves with frequencies between 80
and 500 Hz that were discernable above background EEG were
selected for analysis.
Between three and five channels of EEG per patient were selected
for detection and quantification of HFO events. The data analyzed for
each patient included only episodes that were recorded during poly-
somnographically defined NREM sleep. Figure 1 illustrates the tech-
nique used to detect HFOs. Each channel of wideband EEG was
digitally band-passed between 100 and 500 Hz (finite impulse re-
sponse filter, rolloff, ⫺33 dB/octave), and the root mean square
(RMS; 3-ms sliding window) amplitude of the filtered signal was
calculated (DataPac 2K2, Run Technologies, Mission Viejo, CA).
Multiple filter cutoff frequencies and roll-off value combinations were
tested to determine filter settings that would optimally pass the fre-
quencies between 80 and 500 Hz. Successive RMS values with
amplitudes ⬎5 SDs above the mean amplitude of the RMS signal (i.e.,
mean amplitude calculated over the entire length of data file) longer
than 6 ms in duration were detected and delimited by onset and offset
boundary time markers as putative HFOs. Consecutive events sepa-
J Neurophysiol VOL 88 OCTOBER 2002 www.jn.org
l
D
o
w
n
o
a
d
e
d
f
r
o
m
h
t
t
p
:
/
/
j
.
n
p
h
y
s
o
o
g
y
.
i
l
o
r
g
/
b
y
g
u
e
s
t
o
n
J
a
n
u
a
r
y
3
,
2
0
1
3
�
OSCILLATORY ACTIVITY IN THE HUMAN EPILEPTIC BRAIN
1745
values equal to 0 would indicate sites that had equivalent rates of FR
and ripple discharge. Statistical analyses of HFO peak spectral fre-
quency and duration distributions were made with Mann-Whitney U
test and Kruskal-Wallis tests. A factorial ANOVA model was used to
compare FR and ripple rates of occurrence and ratio of FR to ripples
in relation to side of seizure onset (ipsilateral vs. contralateral),
anatomical recording site (Hip vs. EC), and MRI finding of Hip
atrophy (presence vs. absence of atrophy). Post hoc comparisons were
made using Bonferroni corrected t-tests. All data sets were tested for
normality prior to evaluation with parametric tests using Kolmogorov-
Smirnov test. Square-root transformations were employed for evalu-
ation of non-normal distributions. Statistical significance was set at
P ⱕ .05 for all analyses.
R E S U L T S
FIG. 1. Detection of spontaneous high-frequency oscillation (HFO) events
from continuous wideband EEG recordings. Top: wideband EEG was band-
pass filtered 100 –500 Hz to identify high-frequency EEG events. The root
mean square (RMS; 3-ms window) of the band-pass signal was calculated and
used to detect HFO events. Successive RMS values greater than 5 SD above
the overall mean RMS value (- - -, 5 SD threshold) and a minimum of 6 ms in
duration were delimited by onset and offset boundaries (1) and selected as
putative HFO events. HFO events were subjected to the additional criterion of
containing a minimum of 6 peaks that were greater than 3 SD above the mean
value of the rectified band-pass signal (bottom). Calibration bars 0.5 mV and
5 ms.
rated by less than 10 ms were combined as one event. Events not
having a minimum of 6 peaks (band-passed signal rectified above 0
V) greater than 3 SD from the mean baseline signal were rejected.
Each event was visually inspected to remove events that were con-
taminated by artifact,
including movement, electronic, and other
sources of signal noise. During development of this technique, it was
found that it was effective in detecting greater than 84% of putative
oscillatory events observable with visual EEG analysis.
Data analysis
For each HFO, duration was measured between onset and offset
boundaries (Fig. 1, u) and peak spectral frequency was determined
from fast Fourier transform (FFT)-based power spectral analysis.
Power spectral histograms were calculated using 1,024-point FFT
with zero padding to attain a frequency resolution of 9.7 Hz. To
improve the spectral estimate for each HFO, the signal was band-
passed filtered 80 –500 Hz to attenuate power below 80 Hz associated
with slow waves and power above 500 Hz associated with neuronal
action potentials and a Hamming window was applied to the band-
pass signal. Evaluations of the HFO spectral frequency distribution
and groupings of HFO into ripple and FR frequency ranges were
based on the results of nonlinear curve-fitting analysis (GraphPad
Software, San Diego, CA). “Best-fit” of nonlinear models to the data,
in our case the Lorentzian, was determined from the results of the F
test between pairs of models. The Lorentzian distribution can be
described by the formula Y ⫽ (X)/{1 ⫹ [(X ⫺ m)/w]2}, where m
equals the median of the distribution and w equals the width of the
distribution at half its maximal height. Confidence limits were derived
from the equation P(X) ⫽ (1/) ⫻ {(w/2)/[(X ⫺ m)2 ⫹ (w/2)2]}.
In addition to calculating the rate of FR and ripple discharge per
recording site, we calculated the ratio of FR to ripple rates as a
measure of the predominant type of oscillatory event associated with
each recording site. Ratio values were transformed to a logarithmic
scale such that ratio values greater than 0 would reflect sites with
higher rates of FR discharge compared with rates of ripple discharge.
Conversely, ratio values less than 0 would reflect sites with lower
rates of FR discharge compared with rates of ripple discharge. Ratio
Sixty-four recording sites in 25 epileptic patients were ana-
lyzed for the presence of HFO activity during polysomno-
graphically staged episodes of NREM sleep. Table 1 shows the
breakdown of the recording sites separated by anatomical
location and in relation to areas of seizure onset. The mean
length of time analyzed per site was 177 ⫾ 7 (SE) min. There
was no difference in the amount of EEG data analyzed between
sites ipsilateral to seizure onset and contralateral sites on a
minutes per site basis (176 ⫾ 10 vs. 177 ⫾ 9 min; t ⫽ 0.27,
df. ⫽ 62, P ⫽ 0.7) nor was there a significant difference on a
minutes per patient basis (226 ⫾ 22 vs. 177 ⫾ 27 min; t ⫽
1.54, df. ⫽ 24, P ⫽ 0.1)
Of the 64 recording sites analyzed, 38 sites were ipsilateral
to areas of seizure initiation, while 26 were located contralat-
eral to areas of seizure onset. Of the 38 sties ipsilateral to
seizure onset, evaluation of MRI scans revealed atrophy in 18
sites, while the remaining 20 sites had no detectable atrophy.
Of the 26 sites contralateral to seizure onset, 14 sites were
contralateral to atrophy, and in the remaining 12 sites, no
atrophy was detected.
Overall, high-frequency oscillations were detected in 47 of
the 64 sites representing 23 patients (Table 1). In two patients,
HFO activity was not detected. A greater percentage of Hip
sites ipsilateral to seizure onset were identified with HFO
activity compared with Hip sites contralateral to seizure onset
(18 of 20 ipsilateral vs. 9 of 16 contralateral, Fisher’s exact
test, P ⫽ 0.04). No difference was found between the percent-
TABLE 1. Mesial temporal lobe recording sites
Total
Ipsilateral
Contralateral
Sites
Sites w/ HFOs
Rec. time/site
Hip
Sites
Sites w/ HFOs
EC
Sites
Sites w/ HFOs
64 (25)
47 (23)
177 ⫾ 7
36 (22)
27 (19)
28 (21)
20 (18)
38 (22)
32 (19)
176 ⫾ 10
20 (19)
18 (18)*
18 (15)
14 (14)
26 (17)
15 (13)
177 ⫾ 9
16 (14)
9 (9)
10 (8)
6 (6)
Total number of recording site analyzed, number of sites that detected
high-frequency oscillation (HFO) activity, and mean ⫾ SE length of recording
per site in minutes (“Rec. time/site”). Totals shown in relation to side of
seizure onset (ipsilateral vs. contralateral) and anatomical location [hippocam-
pal vs. entorhinal cortex (Hip vs. EC)]. Number of patients represented in each
category indicated in parentheses. Number of Hip sites ipsilateral to seizure
onset that detected HFOs was greater compared to number of contralateral Hip
sites (* P ⫽ 0.04).
J Neurophysiol VOL 88 OCTOBER 2002 www.jn.org
l
D
o
w
n
o
a
d
e
d
f
r
o
m
h
t
t
p
:
/
/
j
.
n
p
h
y
s
o
o
g
y
.
i
l
o
r
g
/
b
y
g
u
e
s
t
o
n
J
a
n
u
a
r
y
3
,
2
0
1
3
�
1746
STABA, WILSON, BRAGIN, FRIED, AND ENGEL
age of EC sites ipsilateral to seizure onset where HFOs were
recorded compared with the number of contralateral EC sites
(P ⫽ 0.4). Comparisons between Hip and EC sites revealed no
difference between the percentage of ipsilateral Hip sites with
HFOs compared with percentage of ipsilateral EC sites with
HFOs (P ⫽ 0.4). Similarly, no difference was found between
the percentage of contralateral Hip sites with HFOs and the
percentage of contralateral EC sites with HFOs (P ⫽ 1).
Characteristics of HFO
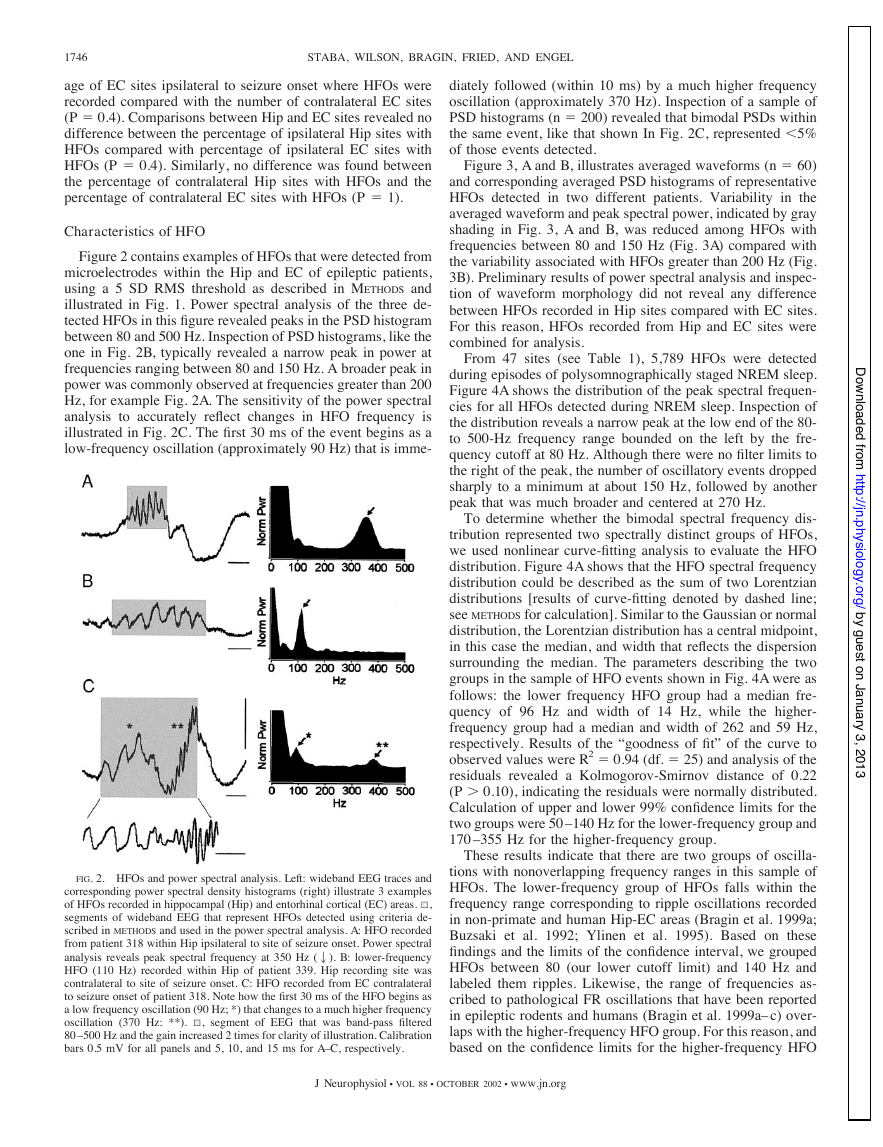
Figure 2 contains examples of HFOs that were detected from
microelectrodes within the Hip and EC of epileptic patients,
usin g a 5 SD RMSthreshold as described in METHODS and
illustrated in Fig. 1. Power spectral analysis of the three de-
tected HFOs in this figure revealed peaks in the PSD histogram
between 80 and 500 Hz. Inspection of PSD histograms, like the
one in Fig. 2B, typically revealed a narrow peak in power at
frequencies ranging between 80 and 150 Hz. A broader peak in
power was commonly observed at frequencies greater than 200
Hz, for example Fig. 2A. The sensitivity of the power spectral
analysis to accurately reflect changes in HFO frequency is
illustrated in Fig. 2C. The first 30 ms of the event begins as a
low-frequency oscillation (approximately 90 Hz) that is imme-
FIG. 2. HFOs and power spectral analysis. Left: wideband EEG traces and
corresponding power spectral density histograms (right) illustrate 3 examples
of HFOs recorded in hippocampal (Hip) and entorhinal cortical (EC) areas. 1,
segments of wideband EEG that represent HFOs detected using criteria de-
scribed in METHODS and used in the power spectral analysis. A: HFO recorded
from patient 318 within Hip ipsilateral to site of seizure onset. Power spectral
analysis reveals peak spectral frequency at 350 Hz (2). B: lower-frequency
HFO (110 Hz) recorded within Hip of patient 339. Hip recording site was
contralateral to site of seizure onset. C: HFO recorded from EC contralateral
to seizure onset of patient 318. Note how the first 30 ms of the HFO begins as
a low frequency oscillation (90 Hz; *) that changes to a much higher frequency
oscillation (370 Hz: **). 1, segment of EEG that was band-pass filtered
80 –500 Hz and the gain increased 2 times for clarity of illustration. Calibration
bars 0.5 mV for all panels and 5, 10, and 15 ms for A–C, respectively.
diately followed (within 10 ms) by a much higher frequency
oscillation (approximately 370 Hz). Inspection of a sample of
PSD histograms (n ⫽ 200) revealed that bimodal PSDs within
the same event, like that shown In Fig. 2C, represented ⬍5%
of those events detected.
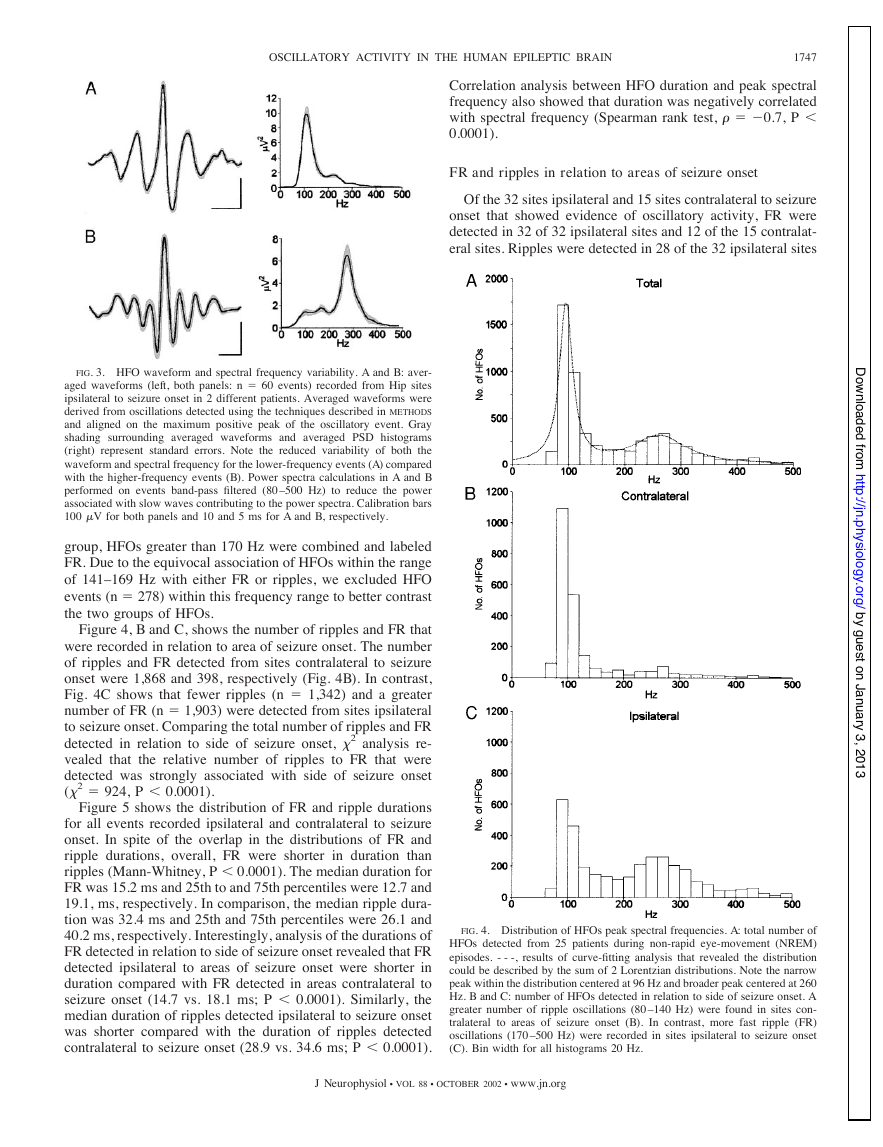
Figure 3, A and B, illustrates averaged waveforms (n ⫽ 60)
and corresponding averaged PSD histograms of representative
HFOs detected in two different patients. Variability in the
averaged waveform and peak spectral power, indicated by gray
shading in Fig. 3, A and B, was reduced among HFOs with
frequencies between 80 and 150 Hz (Fig. 3A) compared with
the variability associated with HFOs greater than 200 Hz (Fig.
3B). Preliminary results of power spectral analysis and inspec-
tion of waveform morphology did not reveal any difference
between HFOs recorded in Hip sites compared with EC sites.
For this reason, HFOs recorded from Hip and EC sites were
combined for analysis.
From 47 sites (see Table 1), 5,789 HFOs were detected
during episodes of polysomnographically staged NREM sleep.
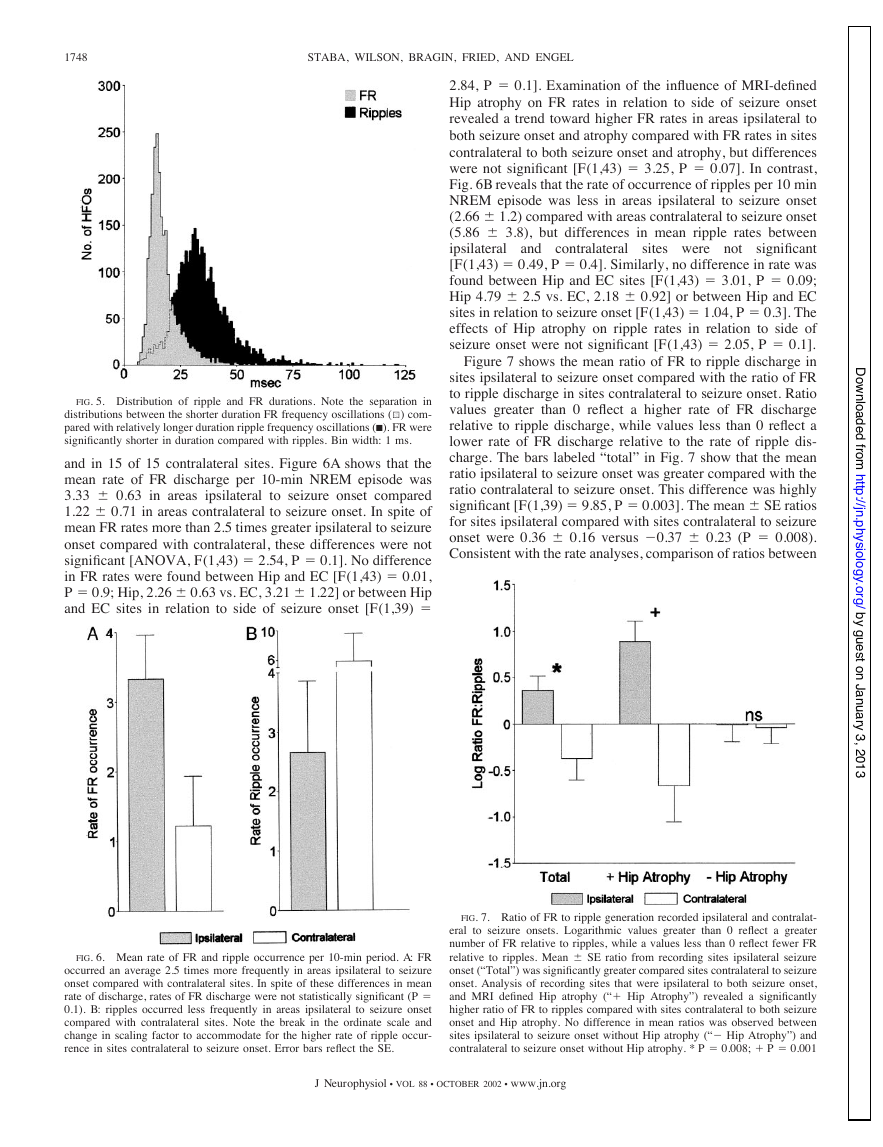
Figure 4A shows the distribution of the peak spectral frequen-
cies for all HFOs detected during NREM sleep. Inspection of
the distribution reveals a narrow peak at the low end of the 80-
to 500-Hz frequency range bounded on the left by the fre-
quency cutoff at 80 Hz. Although there were no filter limits to
the right of the peak, the number of oscillatory events dropped
sharply to a minimum at about 150 Hz, followed by another
peak that was much broader and centered at 270 Hz.
To determine whether the bimodal spectral frequency dis-
tribution represented two spectrally distinct groups of HFOs,
we used nonlinear curve-fitting analysis to evaluate the HFO
distribution. Figure 4A shows that the HFO spectral frequency
distribution could be described as the sum of two Lorentzian
distributions [results of curve-fitting denoted by dashed line;
see METHODS for calculation]. Similar to the Gaussian or normal
distribution, the Lorentzian distribution has a central midpoint,
in this case the median, and width that reflects the dispersion
surrounding the median. The parameters describing the two
groups in the sample of HFO events shown in Fig. 4A were as
follows: the lower frequency HFO group had a median fre-
quency of 96 Hz and width of 14 Hz, while the higher-
frequency group had a median and width of 262 and 59 Hz,
respectively. Results of the “goodness of fit” of the curve to
observed values were R2 ⫽ 0.94 (df. ⫽ 25) and analysis of the
residuals revealed a Kolmogorov-Smirnov distance of 0.22
(P ⬎ 0.10), indicating the residuals were normally distributed.
Calculation of upper and lower 99% confidence limits for the
two groups were 50 –140 Hz for the lower-frequency group and
170 –355 Hz for the higher-frequency group.
These results indicate that there are two groups of oscilla-
tions with nonoverlapping frequency ranges in this sample of
HFOs. The lower-frequency group of HFOs falls within the
frequency range corresponding to ripple oscillations recorded
in non-primate and human Hip-EC areas (Bragin et al. 1999a;
Buzsaki et al. 1992; Ylinen et al. 1995). Based on these
findings and the limits of the confidence interval, we grouped
HFOs between 80 (our lower cutoff limit) and 140 Hz and
labeled them ripples. Likewise, the range of frequencies as-
cribed to pathological FR oscillations that have been reported
in epileptic rodents and humans (Bragin et al. 1999a– c) over-
laps with the higher-frequency HFO group. For this reason, and
based on the confidence limits for the higher-frequency HFO
J Neurophysiol VOL 88 OCTOBER 2002 www.jn.org
l
D
o
w
n
o
a
d
e
d
f
r
o
m
h
t
t
p
:
/
/
j
.
n
p
h
y
s
o
o
g
y
.
i
l
o
r
g
/
b
y
g
u
e
s
t
o
n
J
a
n
u
a
r
y
3
,
2
0
1
3
�
OSCILLATORY ACTIVITY IN THE HUMAN EPILEPTIC BRAIN
1747
Correlation analysis between HFO duration and peak spectral
frequency also showed that duration was negatively correlated
with spectral frequency (Spearman rank test, ⫽ ⫺0.7, P ⬍
0.0001).
FR and ripples in relation to areas of seizure onset
Of the 32 sites ipsilateral and 15 sites contralateral to seizure
onset that showed evidence of oscillatory activity, FR were
detected in 32 of 32 ipsilateral sites and 12 of the 15 contralat-
eral sites. Ripples were detected in 28 of the 32 ipsilateral sites
FIG. 3. HFO waveform and spectral frequency variability. A and B: aver-
aged waveforms (left, both panels: n ⫽ 60 events) recorded from Hip sites
ipsilateral to seizure onset in 2 different patients. Averaged waveforms were
derived from oscillations detected using the techniques described in METHODS
and aligned on the maximum positive peak of the oscillatory event. Gray
shading surrounding averaged waveforms and averaged PSD histograms
(right) represent standard errors. Note the reduced variability of both the
waveform and spectral frequency for the lower-frequency events (A) compared
with the higher-frequency events (B). Power spectra calculations in A and B
performed on events band-pass filtered (80 –500 Hz) to reduce the power
associated with slow waves contributing to the power spectra. Calibration bars
100 V for both panels and 10 and 5 ms for A and B, respectively.
group, HFOs greater than 170 Hz were combined and labeled
FR. Due to the equivocal association of HFOs within the range
of 141–169 Hz with either FR or ripples, we excluded HFO
events (n ⫽ 278) within this frequency range to better contrast
the two groups of HFOs.
Figure 4, B and C, shows the number of ripples and FR that
were recorded in relation to area of seizure onset. The number
of ripples and FR detected from sites contralateral to seizure
onset were 1,868 and 398, respectively (Fig. 4B). In contrast,
Fig. 4C shows that fewer ripples (n ⫽ 1,342) and a greater
number of FR (n ⫽ 1,903) were detected from sites ipsilateral
to seizure onset. Comparing the total number of ripples and FR
detected in relation to side of seizure onset, 2 analysis re-
vealed that the relative number of ripples to FR that were
detected was strongly associated with side of seizure onset
(2 ⫽ 924, P ⬍ 0.0001).
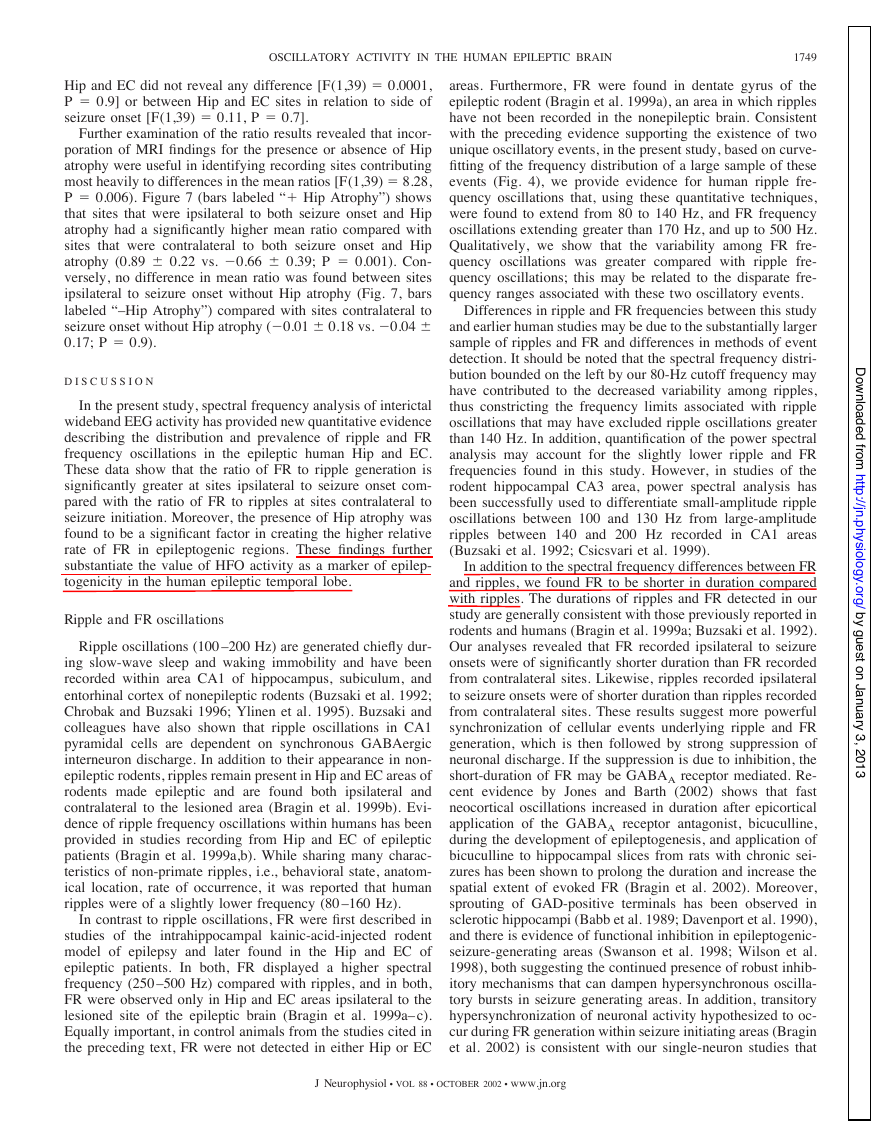
Figure 5 shows the distribution of FR and ripple durations
for all events recorded ipsilateral and contralateral to seizure
onset. In spite of the overlap in the distributions of FR and
ripple durations, overall, FR were shorter in duration than
ripples (Mann-Whitney, P ⬍ 0.0001). The median duration for
FR was 15.2 ms and 25th to and 75th percentiles were 12.7 and
19.1, ms, respectively. In comparison, the median ripple dura-
tion was 32.4 ms and 25th and 75th percentiles were 26.1 and
40.2 ms, respectively. Interestingly, analysis of the durations of
FR detected in relation to side of seizure onset revealed that FR
detected ipsilateral to areas of seizure onset were shorter in
duration compared with FR detected in areas contralateral to
seizure onset (14.7 vs. 18.1 ms; P ⬍ 0.0001). Similarly, the
median duration of ripples detected ipsilateral to seizure onset
was shorter compared with the duration of ripples detected
contralateral to seizure onset (28.9 vs. 34.6 ms; P ⬍ 0.0001).
l
D
o
w
n
o
a
d
e
d
f
r
o
m
h
t
t
p
:
/
/
j
.
n
p
h
y
s
o
o
g
y
.
i
l
o
r
g
/
b
y
g
u
e
s
t
o
n
J
a
n
u
a
r
y
3
,
2
0
1
3
FIG. 4. Distribution of HFOs peak spectral frequencies. A: total number of
HFOs detected from 25 patients during non-rapid eye-movement (NREM)
episodes. - - -, results of curve-fitting analysis that revealed the distribution
could be described by the sum of 2 Lorentzian distributions. Note the narrow
peak within the distribution centered at 96 Hz and broader peak centered at 260
Hz. B and C: number of HFOs detected in relation to side of seizure onset. A
greater number of ripple oscillations (80 –140 Hz) were found in sites con-
tralateral to areas of seizure onset (B). In contrast, more fast ripple (FR)
oscillations (170 –500 Hz) were recorded in sites ipsilateral to seizure onset
(C). Bin width for all histograms 20 Hz.
J Neurophysiol VOL 88 OCTOBER 2002 www.jn.org
�
1748
STABA, WILSON, BRAGIN, FRIED, AND ENGEL
sites were not
and contralateral
2.84, P ⫽ 0.1]. Examination of the influence of MRI-defined
Hip atrophy on FR rates in relation to side of seizure onset
revealed a trend toward higher FR rates in areas ipsilateral to
both seizure onset and atrophy compared with FR rates in sites
contralateral to both seizure onset and atrophy, but differences
were not significant [F(1,43) ⫽ 3.25, P ⫽ 0.07]. In contrast,
Fig. 6B reveals that the rate of occurrence of ripples per 10 min
NREM episode was less in areas ipsilateral to seizure onset
(2.66 ⫾ 1.2) compared with areas contralateral to seizure onset
(5.86 ⫾ 3.8), but differences in mean ripple rates between
ipsilateral
significant
[F(1,43) ⫽ 0.49, P ⫽ 0.4]. Similarly, no difference in rate was
found between Hip and EC sites [F(1,43) ⫽ 3.01, P ⫽ 0.09;
Hip 4.79 ⫾ 2.5 vs. EC, 2.18 ⫾ 0.92] or between Hip and EC
sites in relation to seizure onset [F(1,43) ⫽ 1.04, P ⫽ 0.3]. The
effects of Hip atrophy on ripple rates in relation to side of
seizure onset were not significant [F(1,43) ⫽ 2.05, P ⫽ 0.1].
Figure 7 shows the mean ratio of FR to ripple discharge in
sites ipsilateral to seizure onset compared with the ratio of FR
to ripple discharge in sites contralateral to seizure onset. Ratio
values greater than 0 reflect a higher rate of FR discharge
relative to ripple discharge, while values less than 0 reflect a
lower rate of FR discharge relative to the rate of ripple dis-
charge. The bars labeled “total” in Fig. 7 show that the mean
ratio ipsilateral to seizure onset was greater compared with the
ratio contralateral to seizure onset. This difference was highly
significant [F(1,39) ⫽ 9.85, P ⫽ 0.003]. The mean ⫾ SE ratios
for sites ipsilateral compared with sites contralateral to seizure
onset were 0.36 ⫾ 0.16 versus ⫺0.37 ⫾ 0.23 (P ⫽ 0.008).
Consistent with the rate analyses, comparison of ratios between
FIG. 5. Distribution of ripple and FR durations. Note the separation in
distributions between the shorter duration FR frequency oscillations (1) com-
pared with relatively longer duration ripple frequency oscillations (I). FR were
significantly shorter in duration compared with ripples. Bin width: 1 ms.
and in 15 of 15 contralateral sites. Figure 6A shows that the
mean rate of FR discharge per 10-min NREM episode was
3.33 ⫾ 0.63 in areas ipsilateral to seizure onset compared
1.22 ⫾ 0.71 in areas contralateral to seizure onset. In spite of
mean FR rates more than 2.5 times greater ipsilateral to seizure
onset compared with contralateral, these differences were not
significant [ANOVA, F(1,43) ⫽ 2.54, P ⫽ 0.1]. No difference
in FR rates were found between Hip and EC [F(1,43) ⫽ 0.01,
P ⫽ 0.9; Hip, 2.26 ⫾ 0.63 vs. EC, 3.21 ⫾ 1.22] or between Hip
and EC sites in relation to side of seizure onset [F(1,39) ⫽
FIG. 6. Mean rate of FR and ripple occurrence per 10-min period. A: FR
occurred an average 2.5 times more frequently in areas ipsilateral to seizure
onset compared with contralateral sites. In spite of these differences in mean
rate of discharge, rates of FR discharge were not statistically significant (P ⫽
0.1). B: ripples occurred less frequently in areas ipsilateral to seizure onset
compared with contralateral sites. Note the break in the ordinate scale and
change in scaling factor to accommodate for the higher rate of ripple occur-
rence in sites contralateral to seizure onset. Error bars reflect the SE.
FIG. 7. Ratio of FR to ripple generation recorded ipsilateral and contralat-
eral to seizure onsets. Logarithmic values greater than 0 reflect a greater
number of FR relative to ripples, while a values less than 0 reflect fewer FR
relative to ripples. Mean ⫾ SE ratio from recording sites ipsilateral seizure
onset (“Total”) was significantly greater compared sites contralateral to seizure
onset. Analysis of recording sites that were ipsilateral to both seizure onset,
and MRI defined Hip atrophy (“⫹ Hip Atrophy”) revealed a significantly
higher ratio of FR to ripples compared with sites contralateral to both seizure
onset and Hip atrophy. No difference in mean ratios was observed between
sites ipsilateral to seizure onset without Hip atrophy (“⫺ Hip Atrophy”) and
contralateral to seizure onset without Hip atrophy. * P ⫽ 0.008; ⫹ P ⫽ 0.001
J Neurophysiol VOL 88 OCTOBER 2002 www.jn.org
l
D
o
w
n
o
a
d
e
d
f
r
o
m
h
t
t
p
:
/
/
j
.
n
p
h
y
s
o
o
g
y
.
i
l
o
r
g
/
b
y
g
u
e
s
t
o
n
J
a
n
u
a
r
y
3
,
2
0
1
3
�
OSCILLATORY ACTIVITY IN THE HUMAN EPILEPTIC BRAIN
1749
Hip and EC did not reveal any difference [F(1,39) ⫽ 0.0001,
P ⫽ 0.9] or between Hip and EC sites in relation to side of
seizure onset [F(1,39) ⫽ 0.11, P ⫽ 0.7].
Further examination of the ratio results revealed that incor-
poration of MRI findings for the presence or absence of Hip
atrophy were useful in identifying recording sites contributing
most heavily to differences in the mean ratios [F(1,39) ⫽ 8.28,
P ⫽ 0.006). Figure 7 (bars labeled “⫹ Hip Atrophy”) shows
that sites that were ipsilateral to both seizure onset and Hip
atrophy had a significantly higher mean ratio compared with
sites that were contralateral to both seizure onset and Hip
atrophy (0.89 ⫾ 0.22 vs. ⫺0.66 ⫾ 0.39; P ⫽ 0.001). Con-
versely, no difference in mean ratio was found between sites
ipsilateral to seizure onset without Hip atrophy (Fig. 7, bars
labeled “–Hip Atrophy”) compared with sites contralateral to
seizure onset without Hip atrophy (⫺0.01 ⫾ 0.18 vs. ⫺0.04 ⫾
0.17; P ⫽ 0.9).
D I S C U S S I O N
In the present study, spectral frequency analysis of interictal
wideband EEG activity has provided new quantitative evidence
describing the distribution and prevalence of ripple and FR
frequency oscillations in the epileptic human Hip and EC.
These data show that the ratio of FR to ripple generation is
significantly greater at sites ipsilateral to seizure onset com-
pared with the ratio of FR to ripples at sites contralateral to
seizure initiation. Moreover, the presence of Hip atrophy was
found to be a significant factor in creating the higher relative
rate of FR in epileptogenic regions. These findings further
substantiate the value of HFO activity as a marker of epilep-
togenicity in the human epileptic temporal lobe.
Ripple and FR oscillations
Ripple oscillations (100 –200 Hz) are generated chiefly dur-
ing slow-wave sleep and waking immobility and have been
recorded within area CA1 of hippocampus, subiculum, and
entorhinal cortex of nonepileptic rodents (Buzsaki et al. 1992;
Chrobak and Buzsaki 1996; Ylinen et al. 1995). Buzsaki and
colleagues have also shown that ripple oscillations in CA1
pyramidal cells are dependent on synchronous GABAergic
interneuron discharge. In addition to their appearance in non-
epileptic rodents, ripples remain present in Hip and EC areas of
rodents made epileptic and are found both ipsilateral and
contralateral to the lesioned area (Bragin et al. 1999b). Evi-
dence of ripple frequency oscillations within humans has been
provided in studies recording from Hip and EC of epileptic
patients (Bragin et al. 1999a,b). While sharing many charac-
teristics of non-primate ripples, i.e., behavioral state, anatom-
ical location, rate of occurrence, it was reported that human
ripples were of a slightly lower frequency (80 –160 Hz).
In contrast to ripple oscillations, FR were first described in
studies of the intrahippocampal kainic-acid-injected rodent
model of epilepsy and later found in the Hip and EC of
epileptic patients. In both, FR displayed a higher spectral
frequency (250 –500 Hz) compared with ripples, and in both,
FR were observed only in Hip and EC areas ipsilateral to the
lesioned site of the epileptic brain (Bragin et al. 1999a– c).
Equally important, in control animals from the studies cited in
the preceding text, FR were not detected in either Hip or EC
areas. Furthermore, FR were found in dentate gyrus of the
epileptic rodent (Bragin et al. 1999a), an area in which ripples
have not been recorded in the nonepileptic brain. Consistent
with the preceding evidence supporting the existence of two
unique oscillatory events, in the present study, based on curve-
fitting of the frequency distribution of a large sample of these
events (Fig. 4), we provide evidence for human ripple fre-
quency oscillations that, using these quantitative techniques,
were found to extend from 80 to 140 Hz, and FR frequency
oscillations extending greater than 170 Hz, and up to 500 Hz.
Qualitatively, we show that the variability among FR fre-
quency oscillations was greater compared with ripple fre-
quency oscillations; this may be related to the disparate fre-
quency ranges associated with these two oscillatory events.
Differences in ripple and FR frequencies between this study
and earlier human studies may be due to the substantially larger
sample of ripples and FR and differences in methods of event
detection. It should be noted that the spectral frequency distri-
bution bounded on the left by our 80-Hz cutoff frequency may
have contributed to the decreased variability among ripples,
thus constricting the frequency limits associated with ripple
oscillations that may have excluded ripple oscillations greater
than 140 Hz. In addition, quantification of the power spectral
analysis may account for the slightly lower ripple and FR
frequencies found in this study. However, in studies of the
rodent hippocampal CA3 area, power spectral analysis has
been successfully used to differentiate small-amplitude ripple
oscillations between 100 and 130 Hz from large-amplitude
ripples between 140 and 200 Hz recorded in CA1 areas
(Buzsaki et al. 1992; Csicsvari et al. 1999).
In addition to the spectral frequency differences between FR
and ripples, we found FR to be shorter in duration compared
with ripples. The durations of ripples and FR detected in our
study are generally consistent with those previously reported in
rodents and humans (Bragin et al. 1999a; Buzsaki et al. 1992).
Our analyses revealed that FR recorded ipsilateral to seizure
onsets were of significantly shorter duration than FR recorded
from contralateral sites. Likewise, ripples recorded ipsilateral
to seizure onsets were of shorter duration than ripples recorded
from contralateral sites. These results suggest more powerful
synchronization of cellular events underlying ripple and FR
generation, which is then followed by strong suppression of
neuronal discharge. If the suppression is due to inhibition, the
short-duration of FR may be GABAA receptor mediated. Re-
cent evidence by Jones and Barth (2002) shows that fast
neocortical oscillations increased in duration after epicortical
application of the GABAA receptor antagonist, bicuculline,
during the development of epileptogenesis, and application of
bicuculline to hippocampal slices from rats with chronic sei-
zures has been shown to prolong the duration and increase the
spatial extent of evoked FR (Bragin et al. 2002). Moreover,
sprouting of GAD-positive terminals has been observed in
sclerotic hippocampi (Babb et al. 1989; Davenport et al. 1990),
and there is evidence of functional inhibition in epileptogenic-
seizure-generating areas (Swanson et al. 1998; Wilson et al.
1998), both suggesting the continued presence of robust inhib-
itory mechanisms that can dampen hypersynchronous oscilla-
tory bursts in seizure generating areas. In addition, transitory
hypersynchronization of neuronal activity hypothesized to oc-
cur during FR generation within seizure initiating areas (Bragin
et al. 2002) is consistent with our single-neuron studies that
J Neurophysiol VOL 88 OCTOBER 2002 www.jn.org
l
D
o
w
n
o
a
d
e
d
f
r
o
m
h
t
t
p
:
/
/
j
.
n
p
h
y
s
o
o
g
y
.
i
l
o
r
g
/
b
y
g
u
e
s
t
o
n
J
a
n
u
a
r
y
3
,
2
0
1
3
�


 2023年江西萍乡中考道德与法治真题及答案.doc
 2012年重庆南川中考生物真题及答案.doc
 2013年江西师范大学地理学综合及文艺理论基础考研真题.doc
 2020年四川甘孜小升初语文真题及答案I卷.doc
 2020年注册岩土工程师专业基础考试真题及答案.doc
 2023-2024学年福建省厦门市九年级上学期数学月考试题及答案.doc
 2021-2022学年辽宁省沈阳市大东区九年级上学期语文期末试题及答案.doc
 2022-2023学年北京东城区初三第一学期物理期末试卷及答案.doc
 2018上半年江西教师资格初中地理学科知识与教学能力真题及答案.doc
 2012年河北国家公务员申论考试真题及答案-省级.doc
 2020-2021学年江苏省扬州市江都区邵樊片九年级上学期数学第一次质量检测试题及答案.doc
 2022下半年黑龙江教师资格证中学综合素质真题及答案.doc