Math 158, Spring 2013
Jo Hardin
Multiple Regression IV – R code
Model Building
Consider the multiple regression model:
E[Y ] = β0 + β1X1 + β2X2 + β3X3 + β4X4 + β5X5 + β6X6
Y = state ave SAT score
X1 = % of eligible seniors who took the exam, takers
X2 = median income of families of test takers, income
X3 = ave number of years of formal eduction, years
X4 = % of test takers who attend public school, public
X5 = total state expenditure on public secondary schools ($100 /student), expend
X6 = median percentile rank of test takers within their secondary school class, rank
> sat.data <- read.table("sat.csv", header=T, sep=",")
> attach(sat.data)
> sat.n <- nrow(sat.data)
> ltakers <- log(takers)
# be careful with missing values!!
# variable is quite right skewed
AIC and BIC in R
1. > sat.lm0 <- lm(sat ~ 1)
> summary(sat.lm0)
Coefficients:
Estimate Std. Error t value Pr(>|t|)
(Intercept)
---
Signif. codes:
948.45
10.21
92.86
<2e-16 ***
0 *** 0.001 ** 0.01 * 0.05 . 0.1
1
Residual standard error: 71.5 on 48 degrees of freedom
> sat.sse0 <- sum(resid(sat.lm0) ^2)
> sat.n + sat.n*log(2*pi) + sat.n * log(sat.sse0 / sat.n) + 2 * (1+1)
[1] 560.4736
> AIC(sat.lm0, k=2)
[1] 560.4736
> sat.n + sat.n * log(2*pi) + sat.n*log(sat.sse0/sat.n) + log(sat.n)*(1+1)
[1] 564.2573
> AIC(sat.lm0, k=log(sat.n))
[1] 564.2573
�
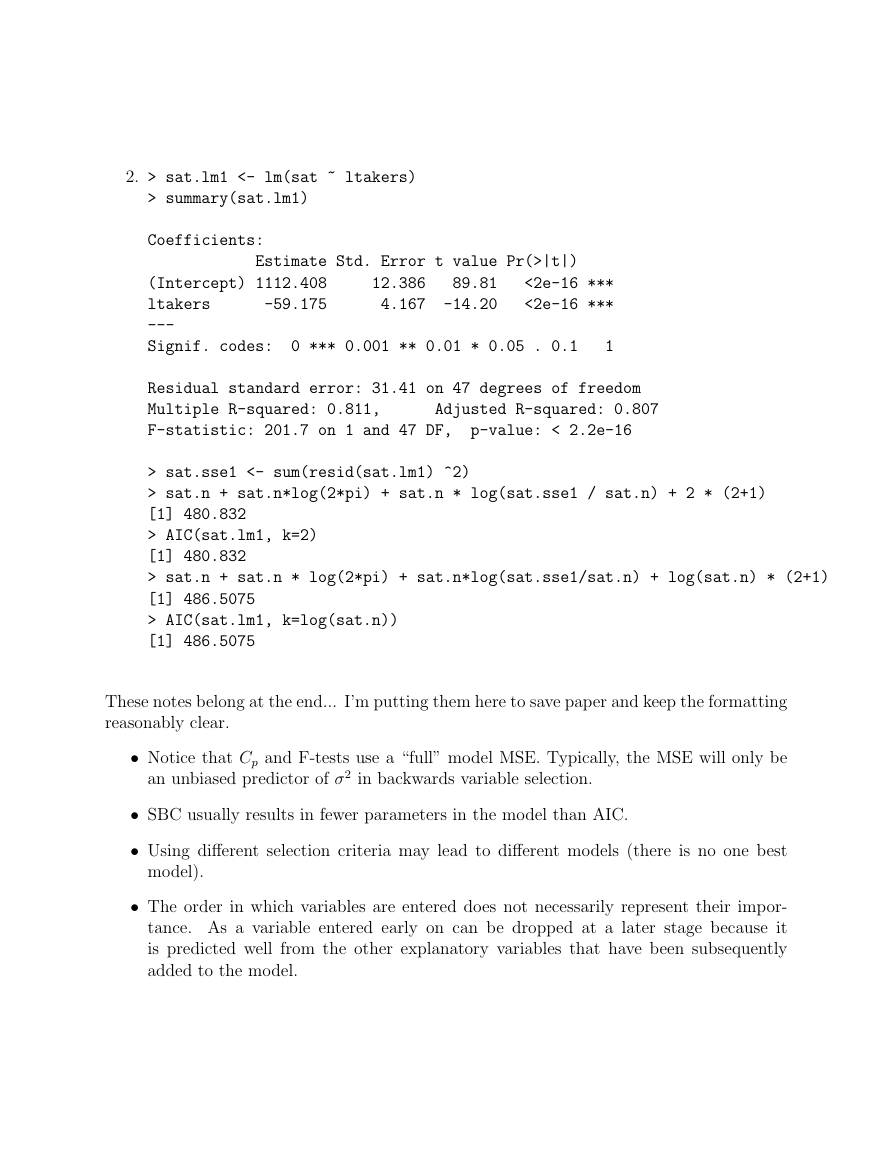
2. > sat.lm1 <- lm(sat ~ ltakers)
> summary(sat.lm1)
Coefficients:
Estimate Std. Error t value Pr(>|t|)
(Intercept) 1112.408
ltakers
-59.175
---
Signif. codes:
12.386
89.81
4.167 -14.20
<2e-16 ***
<2e-16 ***
0 *** 0.001 ** 0.01 * 0.05 . 0.1
1
Residual standard error: 31.41 on 47 degrees of freedom
Multiple R-squared: 0.811,
F-statistic: 201.7 on 1 and 47 DF, p-value: < 2.2e-16
Adjusted R-squared: 0.807
> sat.sse1 <- sum(resid(sat.lm1) ^2)
> sat.n + sat.n*log(2*pi) + sat.n * log(sat.sse1 / sat.n) + 2 * (2+1)
[1] 480.832
> AIC(sat.lm1, k=2)
[1] 480.832
> sat.n + sat.n * log(2*pi) + sat.n*log(sat.sse1/sat.n) + log(sat.n) * (2+1)
[1] 486.5075
> AIC(sat.lm1, k=log(sat.n))
[1] 486.5075
These notes belong at the end... I’m putting them here to save paper and keep the formatting
reasonably clear.
• Notice that Cp and F-tests use a “full” model MSE. Typically, the MSE will only be
an unbiased predictor of σ2 in backwards variable selection.
• SBC usually results in fewer parameters in the model than AIC.
• Using different selection criteria may lead to different models (there is no one best
model).
• The order in which variables are entered does not necessarily represent their impor-
tance. As a variable entered early on can be dropped at a later stage because it
is predicted well from the other explanatory variables that have been subsequently
added to the model.
�
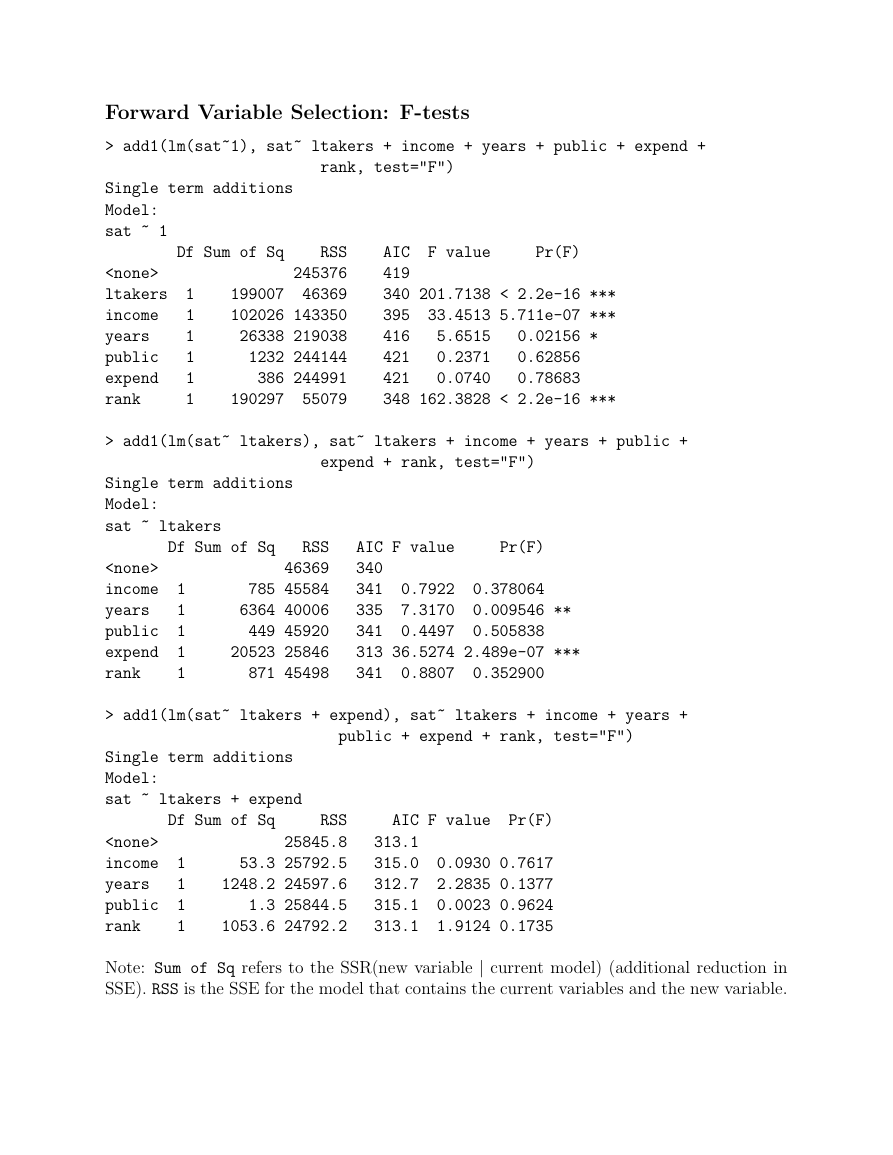
Forward Variable Selection: F-tests
> add1(lm(sat~1), sat~ ltakers + income + years + public + expend +
rank, test="F")
Single term additions
Model:
sat ~ 1
ltakers 1
1
income
years
1
1
public
1
expend
rank
1
Df Sum of Sq
RSS
245376
199007 46369
102026 143350
26338 219038
1232 244144
386 244991
190297 55079
Pr(F)
AIC F value
419
340 201.7138 < 2.2e-16 ***
395 33.4513 5.711e-07 ***
416
421
421
348 162.3828 < 2.2e-16 ***
0.02156 *
0.62856
0.78683
5.6515
0.2371
0.0740
> add1(lm(sat~ ltakers), sat~ ltakers + income + years + public +
expend + rank, test="F")
Single term additions
Model:
sat ~ ltakers
Df Sum of Sq
RSS
46369
785 45584
6364 40006
449 45920
20523 25846
871 45498
Pr(F)
AIC F value
340
341 0.7922
335 7.3170
341 0.4497
313 36.5274 2.489e-07 ***
341
0.378064
0.009546 **
0.505838
0.8807 0.352900
income 1
years
1
public 1
expend 1
rank
1
> add1(lm(sat~ ltakers + expend), sat~ ltakers + income + years +
public + expend + rank, test="F")
Single term additions
Model:
sat ~ ltakers + expend
Df Sum of Sq
AIC F value
Pr(F)
RSS
25845.8
53.3 25792.5
1248.2 24597.6
1.3 25844.5
1053.6 24792.2
income 1
years
1
public 1
rank
1
Note: Sum of Sq refers to the SSR(new variable | current model) (additional reduction in
SSE). RSS is the SSE for the model that contains the current variables and the new variable.
313.1
315.0 0.0930 0.7617
312.7 2.2835 0.1377
315.1 0.0023 0.9624
313.1 1.9124 0.1735
�
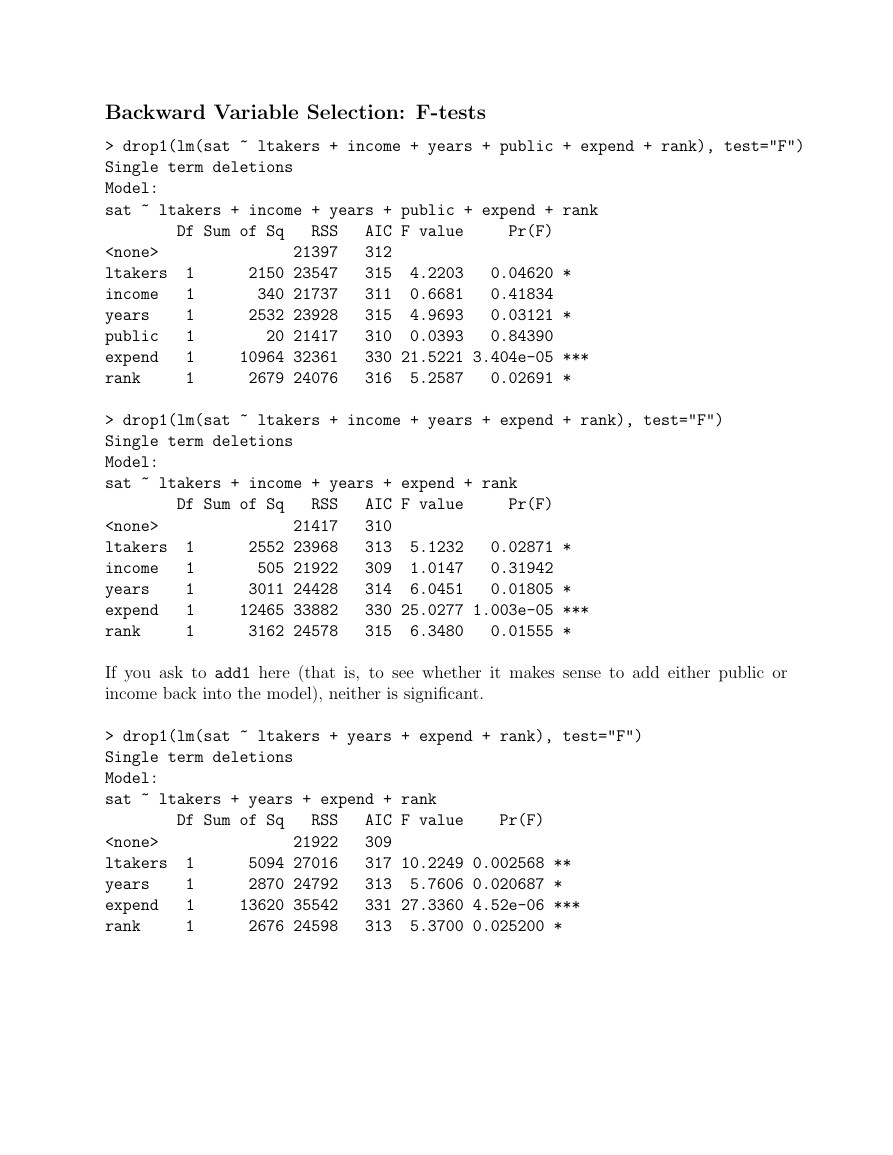
Backward Variable Selection: F-tests
> drop1(lm(sat ~ ltakers + income + years + public + expend + rank), test="F")
Single term deletions
Model:
sat ~ ltakers + income + years + public + expend + rank
ltakers 1
1
income
1
years
public
1
1
expend
rank
1
Df Sum of Sq
RSS
21397
2150 23547
340 21737
2532 23928
20 21417
10964 32361
2679 24076
Pr(F)
AIC F value
312
315 4.2203
311 0.6681
315 4.9693
310
0.0393
330 21.5221 3.404e-05 ***
316
0.04620 *
0.41834
0.03121 *
0.84390
0.02691 *
5.2587
> drop1(lm(sat ~ ltakers + income + years + expend + rank), test="F")
Single term deletions
Model:
sat ~ ltakers + income + years + expend + rank
ltakers 1
1
income
1
years
1
expend
rank
1
Df Sum of Sq
RSS
21417
2552 23968
505 21922
3011 24428
12465 33882
3162 24578
Pr(F)
AIC F value
310
313 5.1232
309 1.0147
314 6.0451
330 25.0277 1.003e-05 ***
315
0.02871 *
0.31942
0.01805 *
0.01555 *
6.3480
If you ask to add1 here (that is, to see whether it makes sense to add either public or
income back into the model), neither is significant.
> drop1(lm(sat ~ ltakers + years + expend + rank), test="F")
Single term deletions
Model:
sat ~ ltakers + years + expend + rank
ltakers 1
1
years
1
expend
rank
1
Df Sum of Sq
RSS
21922
5094 27016
2870 24792
13620 35542
2676 24598
Pr(F)
AIC F value
309
317 10.2249 0.002568 **
313 5.7606 0.020687 *
331 27.3360 4.52e-06 ***
313
5.3700 0.025200 *
�
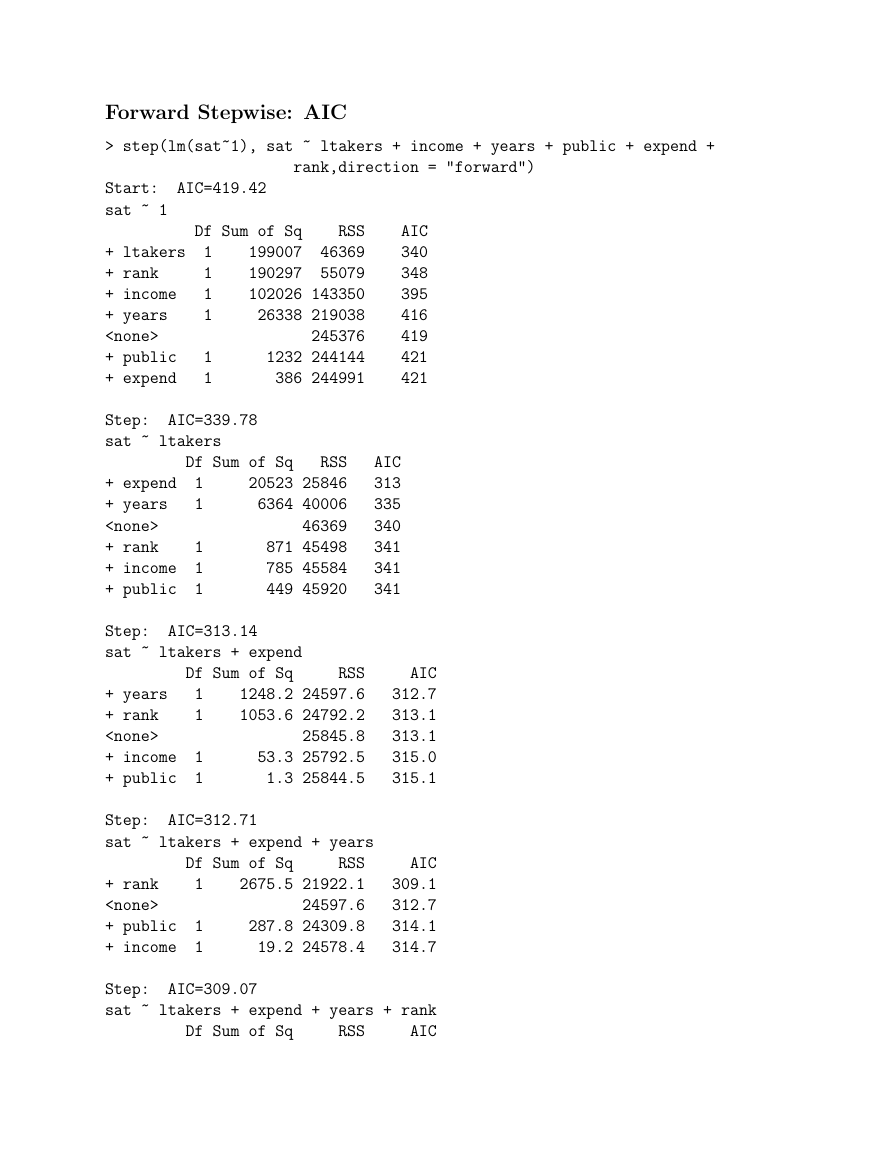
Forward Stepwise: AIC
> step(lm(sat~1), sat ~ ltakers + income + years + public + expend +
rank,direction = "forward")
Start: AIC=419.42
sat ~ 1
+ ltakers
+ rank
+ income
+ years
+ public
+ expend
1
1
1
1
1
1
Df Sum of Sq
RSS
199007 46369
190297 55079
102026 143350
26338 219038
245376
1232 244144
386 244991
Step: AIC=339.78
sat ~ ltakers
Df Sum of Sq
+ expend
+ years
+ rank
+ income
+ public
1
1
1
1
1
RSS
20523 25846
6364 40006
46369
871 45498
785 45584
449 45920
Step: AIC=313.14
sat ~ ltakers + expend
Df Sum of Sq
+ years
+ rank
+ income
+ public
1
1
1
1
RSS
1248.2 24597.6
1053.6 24792.2
25845.8
53.3 25792.5
1.3 25844.5
Step: AIC=312.71
sat ~ ltakers + expend + years
+ rank
+ public
+ income
1
1
1
Df Sum of Sq
RSS
2675.5 21922.1
24597.6
287.8 24309.8
19.2 24578.4
AIC
340
348
395
416
419
421
421
AIC
313
335
340
341
341
341
AIC
312.7
313.1
313.1
315.0
315.1
AIC
309.1
312.7
314.1
314.7
Step: AIC=309.07
sat ~ ltakers + expend + years + rank
AIC
Df Sum of Sq
RSS
�
+ income
+ public
1
1
21922.1
505.4 21416.7
185.0 21737.1
309.1
309.9
310.7
lm(formula = sat ~ ltakers + expend + years + rank)
(Intercept)
399.115
ltakers
-38.100
expend
3.996
years
13.147
rank
4.400
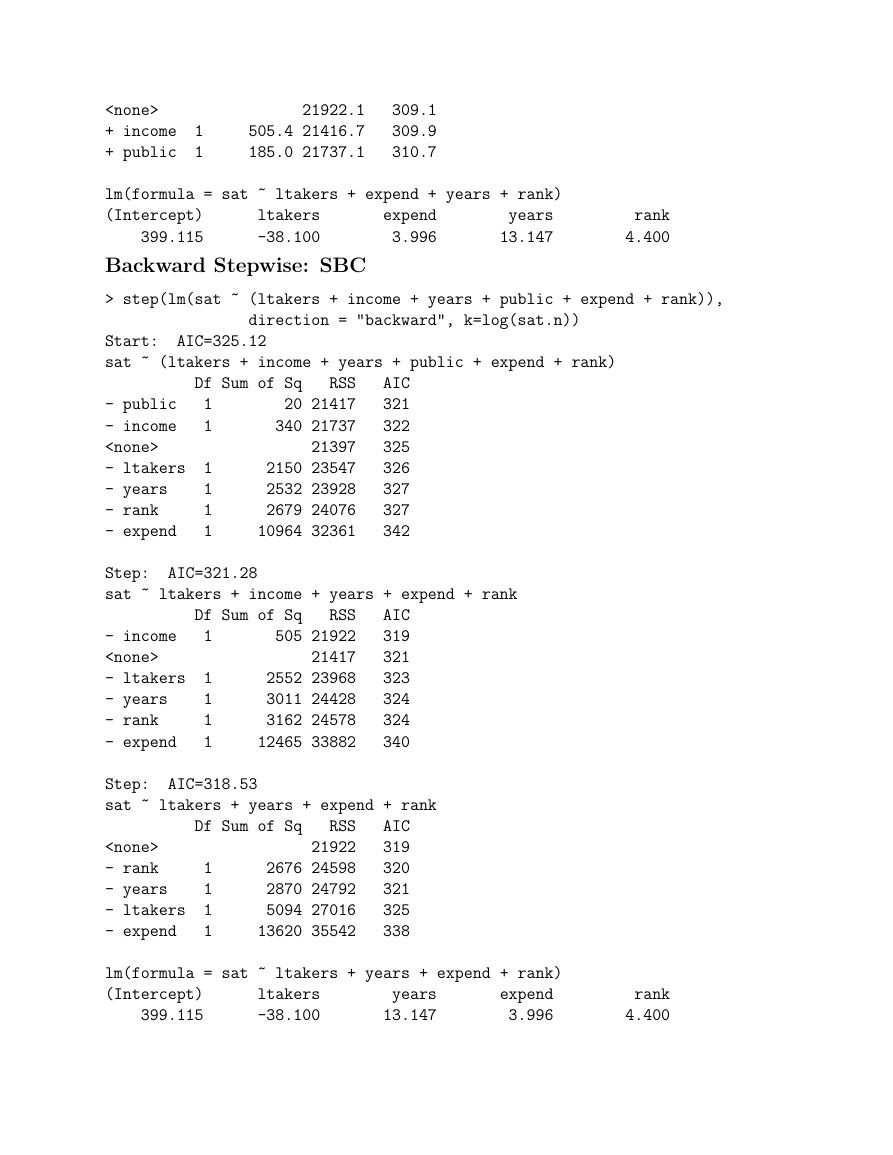
Backward Stepwise: SBC
> step(lm(sat ~ (ltakers + income + years + public + expend + rank)),
direction = "backward", k=log(sat.n))
Start: AIC=325.12
sat ~ (ltakers + income + years + public + expend + rank)
Df Sum of Sq
- public
- income
- ltakers
- years
- rank
- expend
1
1
1
1
1
1
- income
- ltakers
- years
- rank
- expend
1
1
1
1
1
RSS
20 21417
340 21737
21397
2150 23547
2532 23928
2679 24076
10964 32361
RSS
505 21922
21417
2552 23968
3011 24428
3162 24578
12465 33882
AIC
321
322
325
326
327
327
342
AIC
319
321
323
324
324
340
Step: AIC=321.28
sat ~ ltakers + income + years + expend + rank
Df Sum of Sq
Step: AIC=318.53
sat ~ ltakers + years + expend + rank
Df Sum of Sq
- rank
- years
- ltakers
- expend
1
1
1
1
RSS
21922
2676 24598
2870 24792
5094 27016
13620 35542
AIC
319
320
321
325
338
lm(formula = sat ~ ltakers + years + expend + rank)
(Intercept)
399.115
ltakers
-38.100
years
13.147
expend
3.996
rank
4.400
�
To get an idea of how complicated your models can get, try this:
> step(lm(sat ~ (ltakers + income + years + public + expend + rank)^2),
direction = "backward")
�




 2023年江西萍乡中考道德与法治真题及答案.doc
 2012年重庆南川中考生物真题及答案.doc
 2013年江西师范大学地理学综合及文艺理论基础考研真题.doc
 2020年四川甘孜小升初语文真题及答案I卷.doc
 2020年注册岩土工程师专业基础考试真题及答案.doc
 2023-2024学年福建省厦门市九年级上学期数学月考试题及答案.doc
 2021-2022学年辽宁省沈阳市大东区九年级上学期语文期末试题及答案.doc
 2022-2023学年北京东城区初三第一学期物理期末试卷及答案.doc
 2018上半年江西教师资格初中地理学科知识与教学能力真题及答案.doc
 2012年河北国家公务员申论考试真题及答案-省级.doc
 2020-2021学年江苏省扬州市江都区邵樊片九年级上学期数学第一次质量检测试题及答案.doc
 2022下半年黑龙江教师资格证中学综合素质真题及答案.doc