The GPlates User Manual
Rhi McKeon, James Boyden, James Clark
February 2010
�
GPlates User Manual
Table of Contents
1. Introduction to GPlates
1.1. The Aim of this Manual
1.2. Introducing GPlates
1.3. GPlates Development
1.4. Further Information
2. Introducing The Main Window
2.1. The Main Window
2.2. Reconstruction View
2.3. The Menu Bar
2.4. Tool Palette
2.5. List of Menu Operations
3. Data File Types
3.1. Introduction
3.2. Rasters in GPlates
3.3. Time-Dependent Global Raster Sets
4. Loading And Saving
4.1. Introducing Feature Collections
4.2. How to Load a File
4.3. The Manage Feature Collections Dialog
4.4. File Errors
5. Controlling The View
5.1. View Menu
5.2. Reconstruction View
5.3. Tool Palette
5.4. Colouring Features
6. Reconstructions
6.1. Introduction
6.2. Main Window Interface Components
6.3. Reconstruction Menu
6.4. Animations
7. Interacting With Features
7.1. Tools for Interacting with Features
7.2. Choose Feature Tool
8. More on Reconstructions
8.1. Theory
8.2. Specify Anchored Plate ID
8.3. Reconstruction Pole Dialog
9. Editing Geometries
9.1. Geometries in GPlates
9.2. Geometry-Editing Tools
9.3. In the Feature Properties Dialog
10. Creating New Features
10.1. Digitisation
11. Total Reconstruction Pole Manipulation
11.1. Modify Reconstruction Poles Tool
12. Working with Shapefiles
12.1. Introduction
12.2. Shapefile attributes
12.3. More about the Shapefile format
13. Topology Tools
13.1. Introduction
13.2. Topology Controls and Displays
13.3. Topology Sections Table
13.4. Topology Drawing Conventions
13.5. Build Topology Tool
13.6. Edit Topology Tool
�
1. Introduction to GPlates
1.1. The Aim of this Manual
The GPlates user manual aims to provide the reader with an almost complete understanding of the operations,
applications and manipulations within GPlates software. The manual is divided into chapters based on function and
tasks.
For example, a step-by-step guide to loading data into GPlates can be found in Loading and Saving; an overview of
editing the geometries of features can be found in Editing Geometries.
1.2. Introducing GPlates
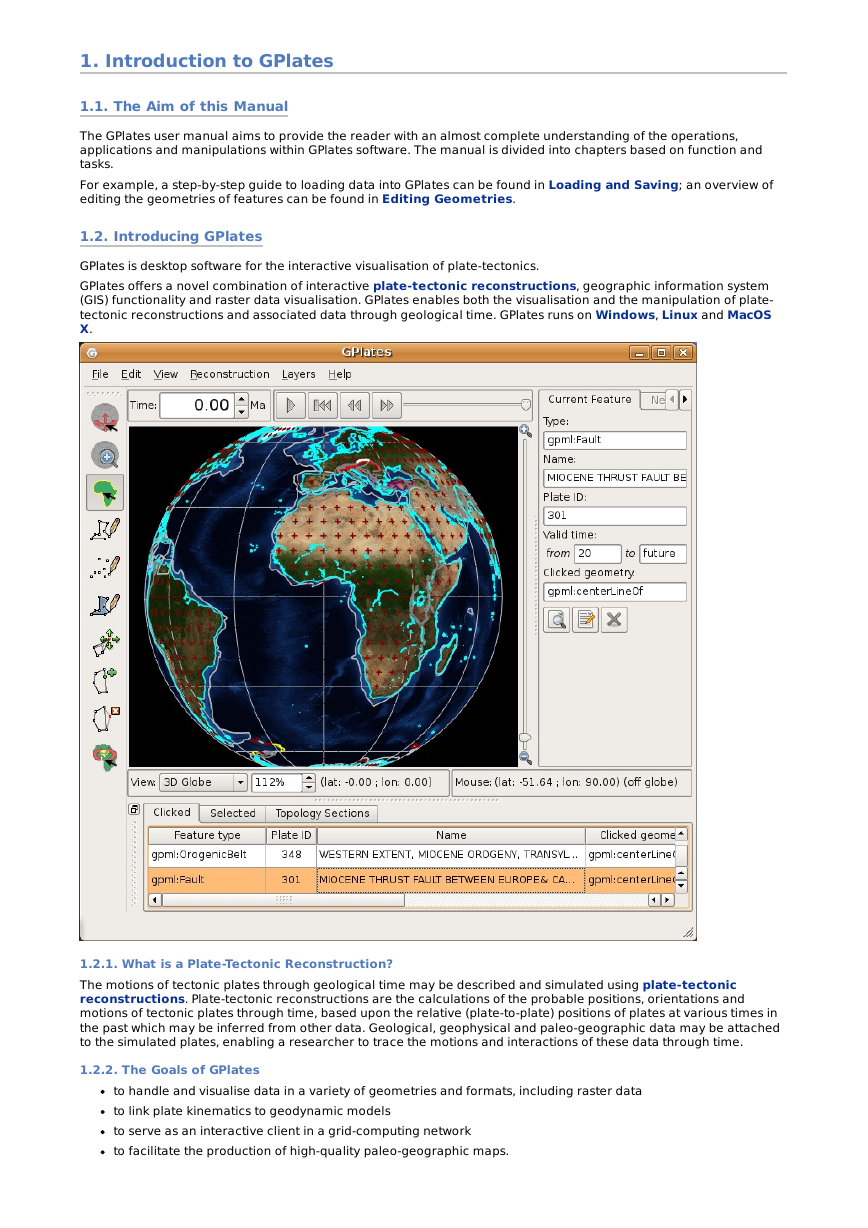
GPlates is desktop software for the interactive visualisation of plate-tectonics.
GPlates offers a novel combination of interactive plate-tectonic reconstructions, geographic information system
(GIS) functionality and raster data visualisation. GPlates enables both the visualisation and the manipulation of plate-
tectonic reconstructions and associated data through geological time. GPlates runs on Windows, Linux and MacOS
X.
1.2.1. What is a Plate-Tectonic Reconstruction?
The motions of tectonic plates through geological time may be described and simulated using plate-tectonic
reconstructions. Plate-tectonic reconstructions are the calculations of the probable positions, orientations and
motions of tectonic plates through time, based upon the relative (plate-to-plate) positions of plates at various times in
the past which may be inferred from other data. Geological, geophysical and paleo-geographic data may be attached
to the simulated plates, enabling a researcher to trace the motions and interactions of these data through time.
1.2.2. The Goals of GPlates
to handle and visualise data in a variety of geometries and formats, including raster data
to link plate kinematics to geodynamic models
to serve as an interactive client in a grid-computing network
to facilitate the production of high-quality paleo-geographic maps.
�
1.3. GPlates Development
GPlates is developed by an international team of scientists, professional software developers and post graduate
students at:
the EarthByte Project (part of the AuScope National Collaborative Research Infrastructure Strategy (NCRIS)
Program) in the School of Geosciences at the University of Sydney (under the direction of Prof. Dietmar Müller)
the Division of Geological and Planetary Sciences at CalTech (under the direction of Prof. Michael Gurnis)
the Centre for Geodynamics at the Norwegian Geological Survey (NGU) (under the direction of Prof. Trond
Torsvik).
Collaborating scientists at the University of Sydney, the Norwegian Geological Survey and CalTech have also been
compiling sets of global data for plate boundaries, continental-oceanic crust boundaries, plate rotations, absolute
reference frames and dynamic topography.
GPlates is free software (also known as open-source software), licensed for distribution under the GNU General Public
License (GPL), version 2.
1.4. Further Information
For more information about GPlates, contact us: http://www.gplates.org/contact.html
�
2. Introducing The Main Window
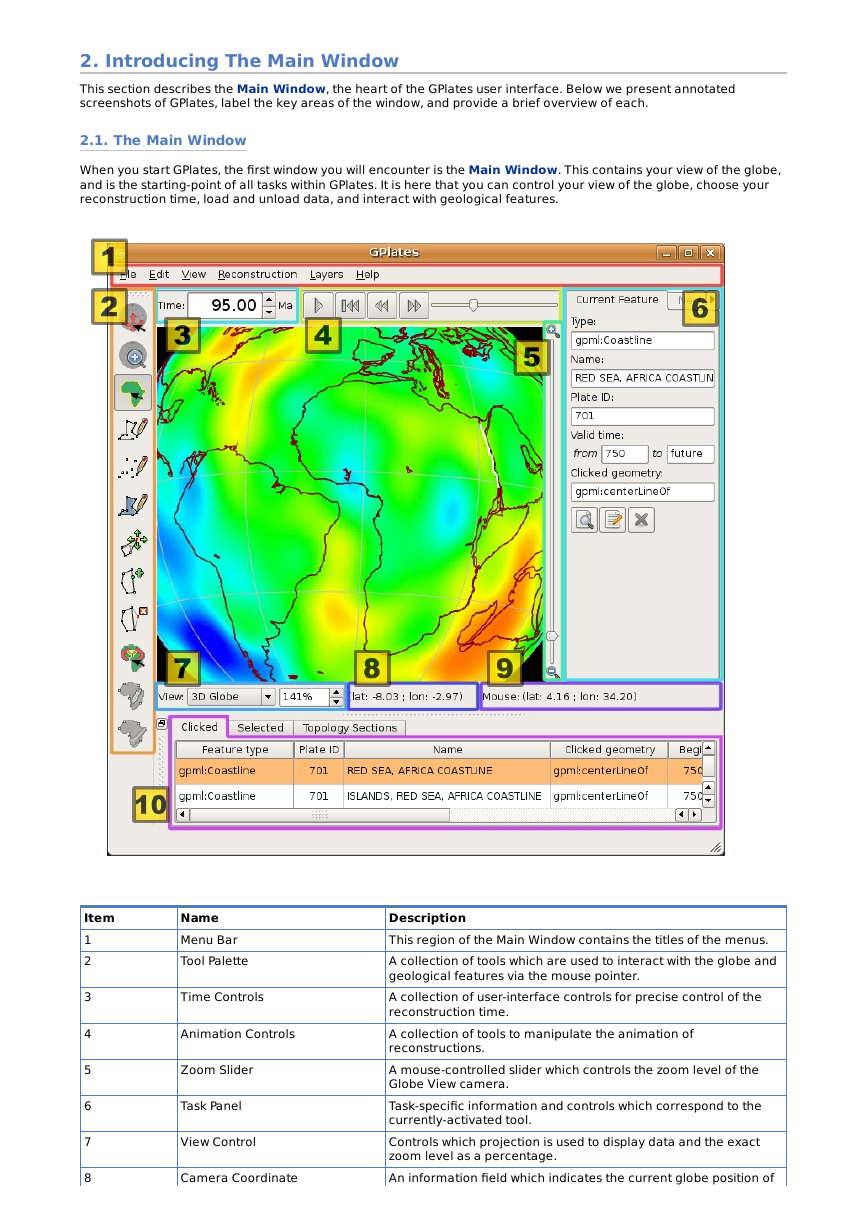
This section describes the Main Window, the heart of the GPlates user interface. Below we present annotated
screenshots of GPlates, label the key areas of the window, and provide a brief overview of each.
2.1. The Main Window
When you start GPlates, the first window you will encounter is the Main Window. This contains your view of the globe,
and is the starting-point of all tasks within GPlates. It is here that you can control your view of the globe, choose your
reconstruction time, load and unload data, and interact with geological features.
Item
1
2
3
4
5
6
7
8
Name
Menu Bar
Tool Palette
Time Controls
Animation Controls
Zoom Slider
Task Panel
View Control
Camera Coordinate
Description
This region of the Main Window contains the titles of the menus.
A collection of tools which are used to interact with the globe and
geological features via the mouse pointer.
A collection of user-interface controls for precise control of the
reconstruction time.
A collection of tools to manipulate the animation of
reconstructions.
A mouse-controlled slider which controls the zoom level of the
Globe View camera.
Task-specific information and controls which correspond to the
currently-activated tool.
Controls which projection is used to display data and the exact
zoom level as a percentage.
An information field which indicates the current globe position of
�
8
9
10
Camera Coordinate
Mouse Coordinate
Clicked Geometry Table
An information field which indicates the current globe position of
the Globe View camera.
An information field which indicates the current globe position of
the mouse pointer.
Displays a summary of each geometry or feature touched by the
last mouse click.
The appearance of the Main Window - particularly the layout of the different window components - will
change as GPlates continues to evolve.
2.2. Reconstruction View
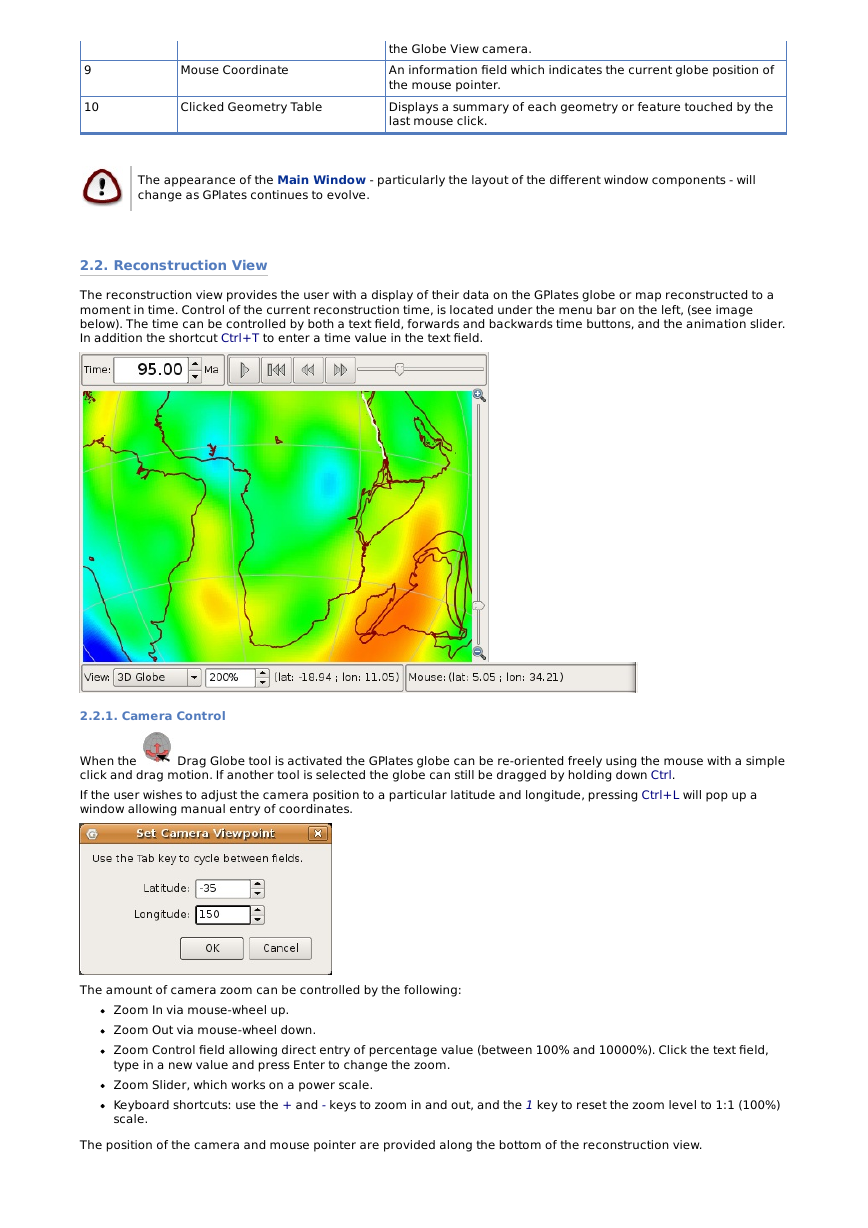
The reconstruction view provides the user with a display of their data on the GPlates globe or map reconstructed to a
moment in time. Control of the current reconstruction time, is located under the menu bar on the left, (see image
below). The time can be controlled by both a text field, forwards and backwards time buttons, and the animation slider.
In addition the shortcut Ctrl+T to enter a time value in the text field.
2.2.1. Camera Control
Drag Globe tool is activated the GPlates globe can be re-oriented freely using the mouse with a simple
When the
click and drag motion. If another tool is selected the globe can still be dragged by holding down Ctrl.
If the user wishes to adjust the camera position to a particular latitude and longitude, pressing Ctrl+L will pop up a
window allowing manual entry of coordinates.
The amount of camera zoom can be controlled by the following:
Zoom In via mouse-wheel up.
Zoom Out via mouse-wheel down.
Zoom Control field allowing direct entry of percentage value (between 100% and 10000%). Click the text field,
type in a new value and press Enter to change the zoom.
Zoom Slider, which works on a power scale.
Keyboard shortcuts: use the + and - keys to zoom in and out, and the 1 key to reset the zoom level to 1:1 (100%)
scale.
The position of the camera and mouse pointer are provided along the bottom of the reconstruction view.
�
2.3. The Menu Bar
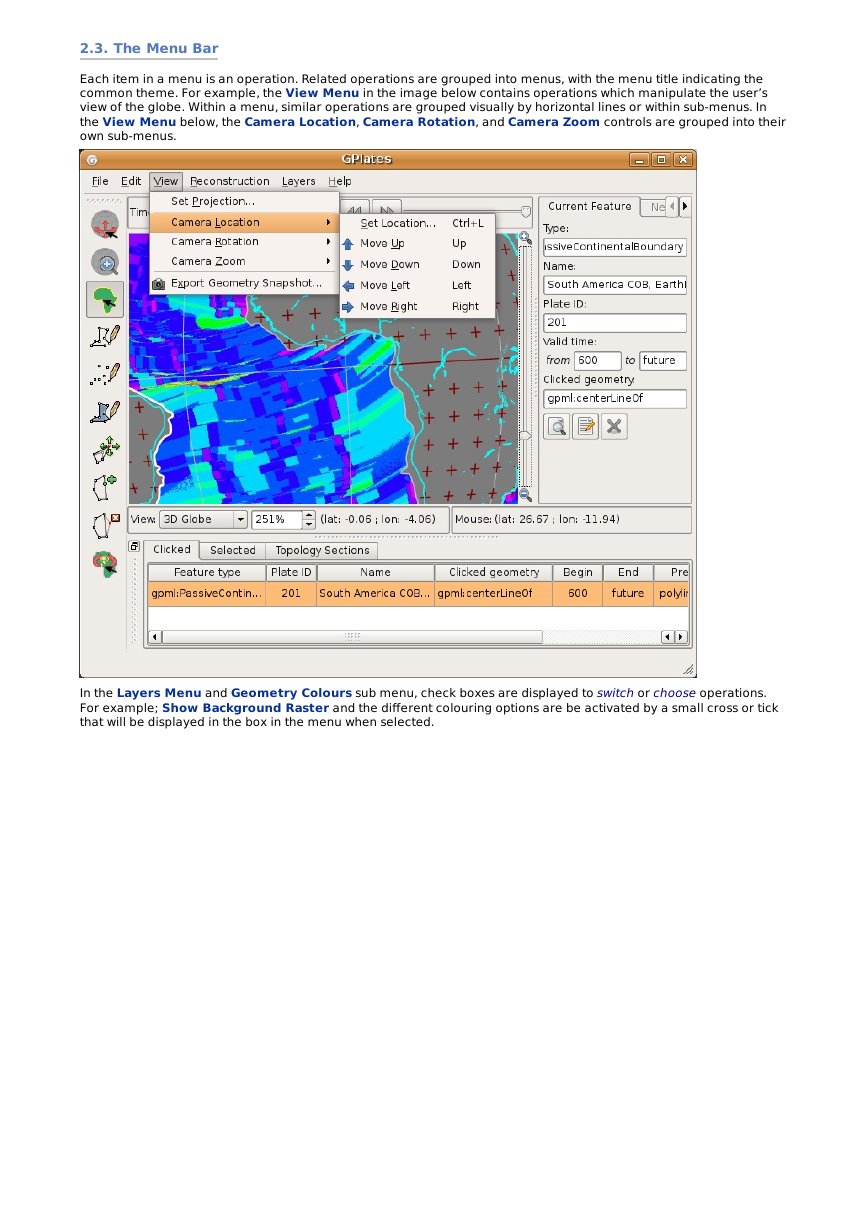
Each item in a menu is an operation. Related operations are grouped into menus, with the menu title indicating the
common theme. For example, the View Menu in the image below contains operations which manipulate the user’s
view of the globe. Within a menu, similar operations are grouped visually by horizontal lines or within sub-menus. In
the View Menu below, the Camera Location, Camera Rotation, and Camera Zoom controls are grouped into their
own sub-menus.
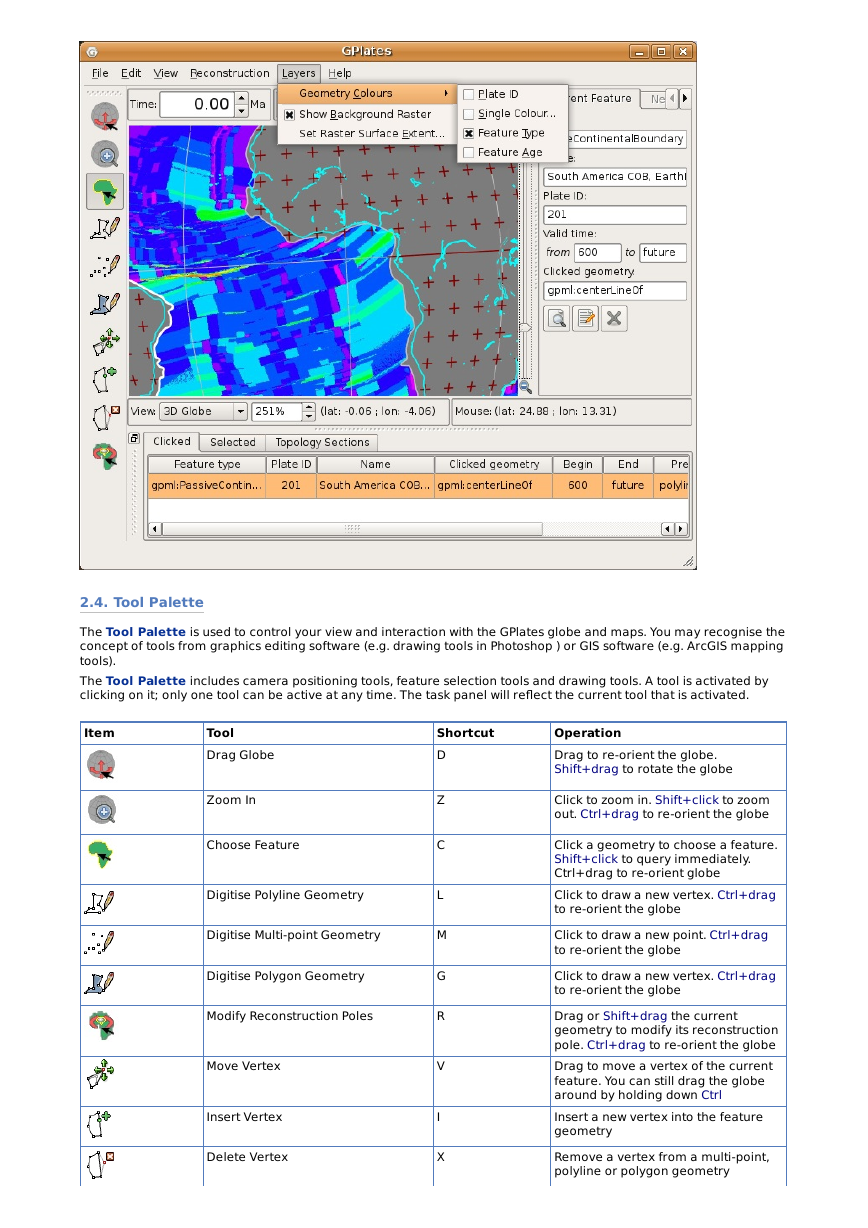
In the Layers Menu and Geometry Colours sub menu, check boxes are displayed to switch or choose operations.
For example; Show Background Raster and the different colouring options are be activated by a small cross or tick
that will be displayed in the box in the menu when selected.
�
2.4. Tool Palette
The Tool Palette is used to control your view and interaction with the GPlates globe and maps. You may recognise the
concept of tools from graphics editing software (e.g. drawing tools in Photoshop ) or GIS software (e.g. ArcGIS mapping
tools).
The Tool Palette includes camera positioning tools, feature selection tools and drawing tools. A tool is activated by
clicking on it; only one tool can be active at any time. The task panel will reflect the current tool that is activated.
Item
Tool
Drag Globe
Zoom In
Choose Feature
Digitise Polyline Geometry
Digitise Multi-point Geometry
Digitise Polygon Geometry
Modify Reconstruction Poles
Move Vertex
Insert Vertex
Delete Vertex
Shortcut
D
Operation
Drag to re-orient the globe.
Shift+drag to rotate the globe
Z
C
L
M
G
R
V
I
X
Click to zoom in. Shift+click to zoom
out. Ctrl+drag to re-orient the globe
Click a geometry to choose a feature.
Shift+click to query immediately.
Ctrl+drag to re-orient globe
Click to draw a new vertex. Ctrl+drag
to re-orient the globe
Click to draw a new point. Ctrl+drag
to re-orient the globe
Click to draw a new vertex. Ctrl+drag
to re-orient the globe
Drag or Shift+drag the current
geometry to modify its reconstruction
pole. Ctrl+drag to re-orient the globe
Drag to move a vertex of the current
feature. You can still drag the globe
around by holding down Ctrl
Insert a new vertex into the feature
geometry
Remove a vertex from a multi-point,
polyline or polygon geometry
�


 2023年江西萍乡中考道德与法治真题及答案.doc
 2012年重庆南川中考生物真题及答案.doc
 2013年江西师范大学地理学综合及文艺理论基础考研真题.doc
 2020年四川甘孜小升初语文真题及答案I卷.doc
 2020年注册岩土工程师专业基础考试真题及答案.doc
 2023-2024学年福建省厦门市九年级上学期数学月考试题及答案.doc
 2021-2022学年辽宁省沈阳市大东区九年级上学期语文期末试题及答案.doc
 2022-2023学年北京东城区初三第一学期物理期末试卷及答案.doc
 2018上半年江西教师资格初中地理学科知识与教学能力真题及答案.doc
 2012年河北国家公务员申论考试真题及答案-省级.doc
 2020-2021学年江苏省扬州市江都区邵樊片九年级上学期数学第一次质量检测试题及答案.doc
 2022下半年黑龙江教师资格证中学综合素质真题及答案.doc