Tam´as Rudas
Lectures on
Categorical Data Analysis
123
�
Tam´as Rudas
Center for Social Sciences
Hungarian Academy of Sciences
Budapest, Hungary
E¨otv¨os Lor´and University
Budapest, Hungary
ISSN 1431-875X
Springer Texts in Statistics
ISBN 978-1-4939-7691-1
https://doi.org/10.1007/978-1-4939-7693-5
ISSN 2197-4136 (electronic)
ISBN 978-1-4939-7693-5 (eBook)
Library of Congress Control Number: 2018930750
© Springer Science+Business Media, LLC, part of Springer Nature 2018
�
Preface
This book offers a fairly self-contained account of the fundamental results in cat-
egorical data analysis. The somewhat old fashioned title (Lectures . . . ) refers to
the fact that the selection of the material does have a subjective component, and
presentation, although rigorous, aims at explaining concepts and proofs rather than
presenting them in the most parsimonious way. Every attempt has been made to
combine mathematical precision and intuition, and to link theory with the everyday
practice of data collection and analysis. Even the notation was modified occasion-
ally to better emphasize the relevant aspects.
The book assumes minimal background in calculus, linear algebra, probability
theory, and statistics, much less than what is usually covered in the respective first
courses. While the technical background required is minimal, there is, as often said,
some maturity of thinking required. The text is fairly easy if read as mathematics, but
occasionally quite involved, if read as statistics. The latter means understanding the
motivation behind constructs and the relevance of the theorems for real inferential
problems.
A great advantage of studying categorical data analysis is that many concepts in
statistics are very transparent when discussed in a categorical data context, and at
many places, the book takes this opportunity to comment on general principles and
methods in statistics. In other words, the book does not only deal with “how?”, but
also with “why?”.
Hopefully, the book will be used as a reference and for self-study, and it can be
used as a textbook in an upper division undergraduate or perhaps a first year graduate
class, too. To facilitate the latter use, the material is divided into 12 chapters, to
suggest a straightforward pacing in a quarter-length course. The book also contains
over 200 problems, which are mostly positioned a bit higher than simple exercises.
Some of these problems could also be used as starting points for undergraduate
research projects. In a less theory-oriented course, when providing the students with
computational experience is a direct goal, and it uses some of the instructional time,
the material in Chaps. 3 and 7 and perhaps in Chaps. 8 and 9 may be skipped.
The topics emphasized include the possibility of the existence of higher order
interactions among categorical variables, as opposed to the assumption of multi-
�
variate normality, which implies that only pairwise associations exist; the use of the
δ-method to correctly determine asymptotic standard errors for complex quantities
reported in surveys; the fundamentals of the main theories of causal analysis based
on observational data presented critically; a discussion of the Simpson paradox and
a description of the usefulness of the odds ratio as a measure of association, and its
limitations as a measure of effect; and a detailed discussion of log-linear models,
including graphical models. Chapter 13 gives an informal overview of many current
topics in categorical data analysis, including undirected and directed graphical mod-
els, path models, marginal models, relational models, Markov chain Monte Carlo,
and the mixture index of fit. To include a detailed account of all these in the book
would have doubled not only its length but, unfortunately, also the time needed to
complete it.
The material in this book will be useful for students studying to achieve different
goals. It can be seen as sufficient theoretical background in categorical data analysis
for those who want to do applied statistical research—these students will need to fa-
miliarize themselves with some of the existing software implementations elsewhere.
For those who want to go in the direction of machine learning and data science, the
book describes, in addition to many of the fundamental principles of statistics, also
a big part of the mathematical background of graphical modeling—obviously, these
students will have to continue their studies in the direction of the various algorith-
mic approaches. Finally, for those who want to be engaged in research in the theory
of categorical data analysis, the book offers a solid background to study the current
research literature, some of which is mentioned in Chap. 13.
I would greatly appreciate if readers notified me of any typos or inconsistencies
found in the book.
Budapest, Hungary
September 2017
Tam´as Rudas
�
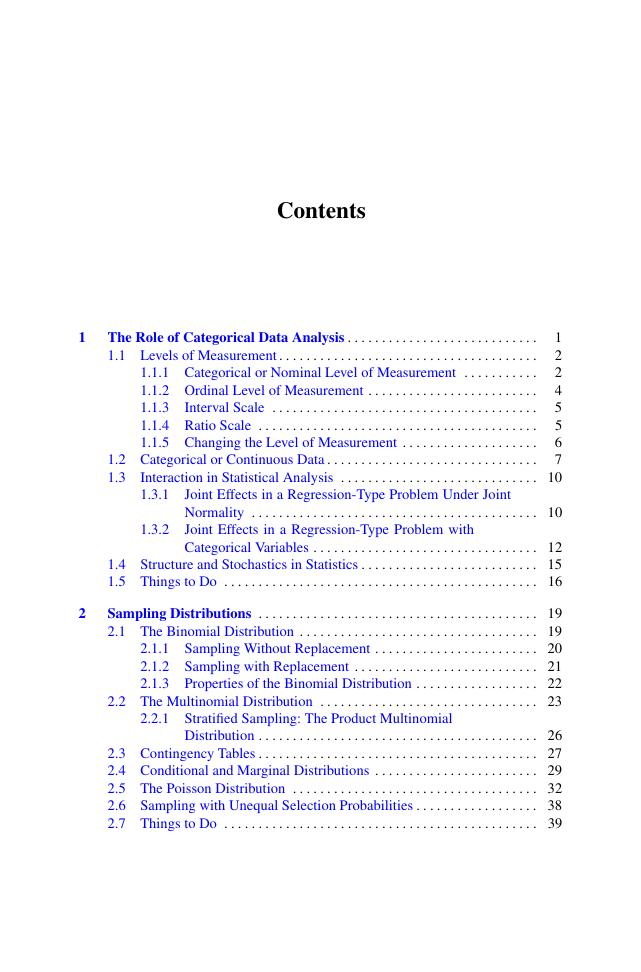
Contents
1
2
The Role of Categorical Data Analysis . . . . . . . . . . . . . . . . . . . . . . . . . . . .
1.1 Levels of Measurement . . . . . . . . . . . . . . . . . . . . . . . . . . . . . . . . . . . . . .
1.1.1 Categorical or Nominal Level of Measurement
. . . . . . . . . . .
1.1.2 Ordinal Level of Measurement . . . . . . . . . . . . . . . . . . . . . . . . .
1.1.3
Interval Scale . . . . . . . . . . . . . . . . . . . . . . . . . . . . . . . . . . . . . . .
1.1.4 Ratio Scale . . . . . . . . . . . . . . . . . . . . . . . . . . . . . . . . . . . . . . . . .
1.1.5 Changing the Level of Measurement . . . . . . . . . . . . . . . . . . . .
1.2 Categorical or Continuous Data . . . . . . . . . . . . . . . . . . . . . . . . . . . . . . .
1.3
1
2
2
4
5
5
6
7
Interaction in Statistical Analysis . . . . . . . . . . . . . . . . . . . . . . . . . . . . . 10
1.3.1
1.3.2
Joint Effects in a Regression-Type Problem Under Joint
Normality . . . . . . . . . . . . . . . . . . . . . . . . . . . . . . . . . . . . . . . . . . 10
Joint Effects in a Regression-Type Problem with
Categorical Variables . . . . . . . . . . . . . . . . . . . . . . . . . . . . . . . . . 12
1.4 Structure and Stochastics in Statistics . . . . . . . . . . . . . . . . . . . . . . . . . . 15
1.5 Things to Do . . . . . . . . . . . . . . . . . . . . . . . . . . . . . . . . . . . . . . . . . . . . . . 16
Sampling Distributions . . . . . . . . . . . . . . . . . . . . . . . . . . . . . . . . . . . . . . . . . 19
2.1 The Binomial Distribution . . . . . . . . . . . . . . . . . . . . . . . . . . . . . . . . . . . 19
2.1.1 Sampling Without Replacement . . . . . . . . . . . . . . . . . . . . . . . . 20
2.1.2 Sampling with Replacement . . . . . . . . . . . . . . . . . . . . . . . . . . . 21
2.1.3 Properties of the Binomial Distribution . . . . . . . . . . . . . . . . . . 22
2.2 The Multinomial Distribution . . . . . . . . . . . . . . . . . . . . . . . . . . . . . . . . 23
2.2.1 Stratified Sampling: The Product Multinomial
Distribution . . . . . . . . . . . . . . . . . . . . . . . . . . . . . . . . . . . . . . . . . 26
2.3 Contingency Tables . . . . . . . . . . . . . . . . . . . . . . . . . . . . . . . . . . . . . . . . . 27
2.4 Conditional and Marginal Distributions . . . . . . . . . . . . . . . . . . . . . . . . 29
2.5 The Poisson Distribution . . . . . . . . . . . . . . . . . . . . . . . . . . . . . . . . . . . . 32
2.6 Sampling with Unequal Selection Probabilities . . . . . . . . . . . . . . . . . . 38
2.7 Things to Do . . . . . . . . . . . . . . . . . . . . . . . . . . . . . . . . . . . . . . . . . . . . . . 39
�
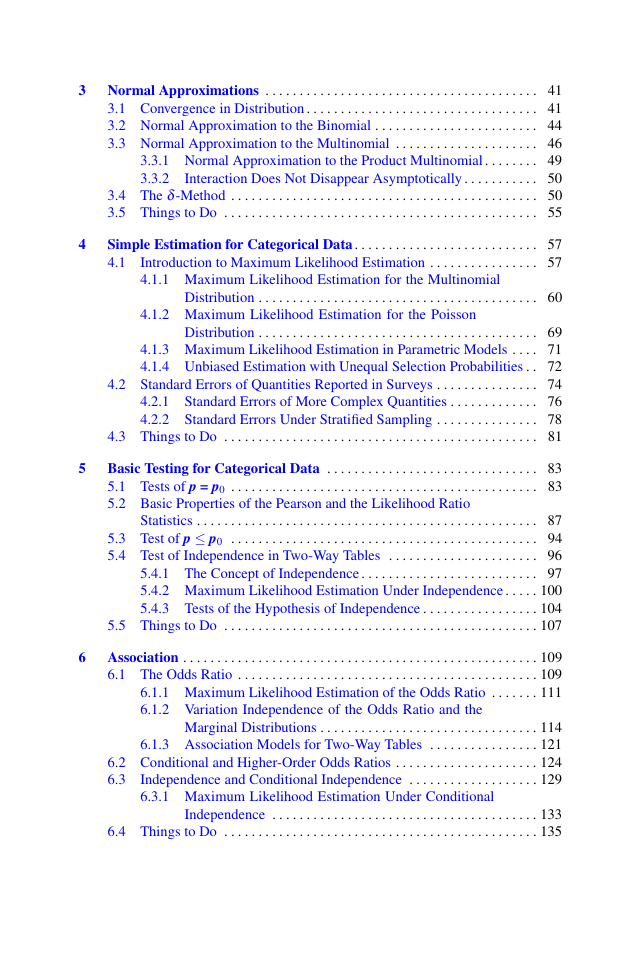
3
4
5
6
Normal Approximations . . . . . . . . . . . . . . . . . . . . . . . . . . . . . . . . . . . . . . . . 41
3.1 Convergence in Distribution . . . . . . . . . . . . . . . . . . . . . . . . . . . . . . . . . . 41
3.2 Normal Approximation to the Binomial . . . . . . . . . . . . . . . . . . . . . . . . 44
3.3 Normal Approximation to the Multinomial . . . . . . . . . . . . . . . . . . . . . 46
3.3.1 Normal Approximation to the Product Multinomial . . . . . . . . 49
Interaction Does Not Disappear Asymptotically . . . . . . . . . . . 50
3.3.2
3.4 The δ-Method . . . . . . . . . . . . . . . . . . . . . . . . . . . . . . . . . . . . . . . . . . . . . 50
3.5 Things to Do . . . . . . . . . . . . . . . . . . . . . . . . . . . . . . . . . . . . . . . . . . . . . . 55
Simple Estimation for Categorical Data . . . . . . . . . . . . . . . . . . . . . . . . . . . 57
Introduction to Maximum Likelihood Estimation . . . . . . . . . . . . . . . . 57
4.1
4.1.1 Maximum Likelihood Estimation for the Multinomial
Distribution . . . . . . . . . . . . . . . . . . . . . . . . . . . . . . . . . . . . . . . . . 60
4.1.2 Maximum Likelihood Estimation for the Poisson
Distribution . . . . . . . . . . . . . . . . . . . . . . . . . . . . . . . . . . . . . . . . . 69
4.1.3 Maximum Likelihood Estimation in Parametric Models . . . . 71
4.1.4 Unbiased Estimation with Unequal Selection Probabilities . . 72
4.2 Standard Errors of Quantities Reported in Surveys . . . . . . . . . . . . . . . 74
4.2.1 Standard Errors of More Complex Quantities . . . . . . . . . . . . . 76
4.2.2 Standard Errors Under Stratified Sampling . . . . . . . . . . . . . . . 78
4.3 Things to Do . . . . . . . . . . . . . . . . . . . . . . . . . . . . . . . . . . . . . . . . . . . . . . 81
Basic Testing for Categorical Data . . . . . . . . . . . . . . . . . . . . . . . . . . . . . . . 83
5.1 Tests of p = p0 . . . . . . . . . . . . . . . . . . . . . . . . . . . . . . . . . . . . . . . . . . . . . 83
5.2 Basic Properties of the Pearson and the Likelihood Ratio
Statistics . . . . . . . . . . . . . . . . . . . . . . . . . . . . . . . . . . . . . . . . . . . . . . . . . . 87
5.3 Test of p ≤ p0 . . . . . . . . . . . . . . . . . . . . . . . . . . . . . . . . . . . . . . . . . . . . . 94
5.4 Test of Independence in Two-Way Tables . . . . . . . . . . . . . . . . . . . . . . 96
5.4.1 The Concept of Independence . . . . . . . . . . . . . . . . . . . . . . . . . . 97
5.4.2 Maximum Likelihood Estimation Under Independence . . . . . 100
5.4.3 Tests of the Hypothesis of Independence . . . . . . . . . . . . . . . . . 104
5.5 Things to Do . . . . . . . . . . . . . . . . . . . . . . . . . . . . . . . . . . . . . . . . . . . . . . 107
Association . . . . . . . . . . . . . . . . . . . . . . . . . . . . . . . . . . . . . . . . . . . . . . . . . . . . 109
6.1 The Odds Ratio . . . . . . . . . . . . . . . . . . . . . . . . . . . . . . . . . . . . . . . . . . . . 109
6.1.1 Maximum Likelihood Estimation of the Odds Ratio . . . . . . . 111
6.1.2 Variation Independence of the Odds Ratio and the
Marginal Distributions . . . . . . . . . . . . . . . . . . . . . . . . . . . . . . . . 114
6.1.3 Association Models for Two-Way Tables . . . . . . . . . . . . . . . . 121
6.2 Conditional and Higher-Order Odds Ratios . . . . . . . . . . . . . . . . . . . . . 124
Independence and Conditional Independence . . . . . . . . . . . . . . . . . . . 129
6.3
6.3.1 Maximum Likelihood Estimation Under Conditional
Independence . . . . . . . . . . . . . . . . . . . . . . . . . . . . . . . . . . . . . . . 133
6.4 Things to Do . . . . . . . . . . . . . . . . . . . . . . . . . . . . . . . . . . . . . . . . . . . . . . 135
�
7
8
9
Latent Classes and Exponential Families . . . . . . . . . . . . . . . . . . . . . . . . . . 137
7.1 The Latent Class Approach . . . . . . . . . . . . . . . . . . . . . . . . . . . . . . . . . . 137
7.1.1 Convergence of the EM Algorithm . . . . . . . . . . . . . . . . . . . . . . 141
7.2 Exponential Families of Probability Distributions . . . . . . . . . . . . . . . . 144
7.3 Things to Do . . . . . . . . . . . . . . . . . . . . . . . . . . . . . . . . . . . . . . . . . . . . . . 155
Effects and Associations . . . . . . . . . . . . . . . . . . . . . . . . . . . . . . . . . . . . . . . . 157
8.1 Association and Causation . . . . . . . . . . . . . . . . . . . . . . . . . . . . . . . . . . . 158
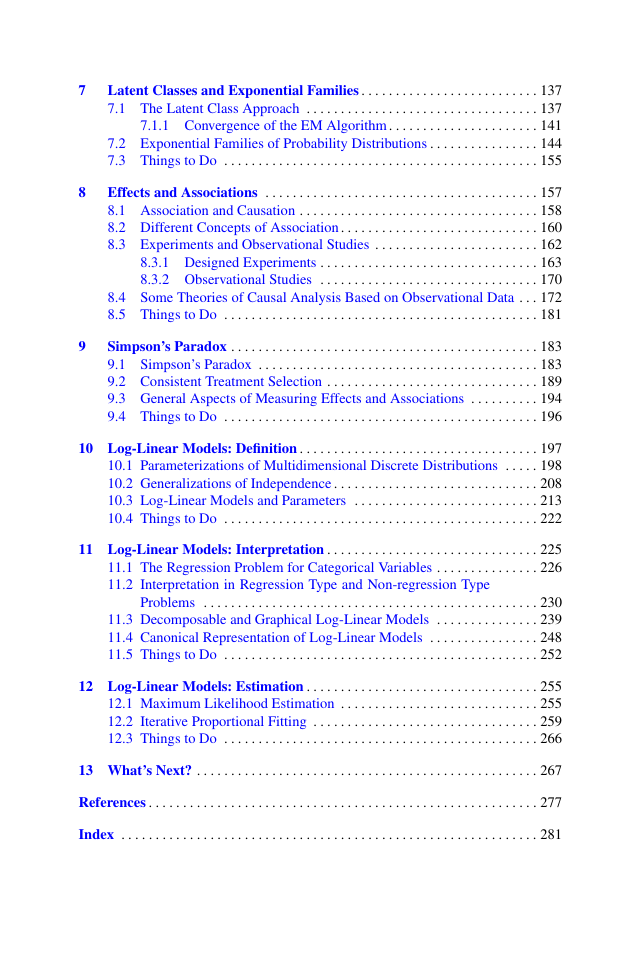
8.2 Different Concepts of Association . . . . . . . . . . . . . . . . . . . . . . . . . . . . . 160
8.3 Experiments and Observational Studies . . . . . . . . . . . . . . . . . . . . . . . . 162
8.3.1 Designed Experiments . . . . . . . . . . . . . . . . . . . . . . . . . . . . . . . . 163
8.3.2 Observational Studies . . . . . . . . . . . . . . . . . . . . . . . . . . . . . . . . 170
8.4 Some Theories of Causal Analysis Based on Observational Data . . . 172
8.5 Things to Do . . . . . . . . . . . . . . . . . . . . . . . . . . . . . . . . . . . . . . . . . . . . . . 181
Simpson’s Paradox . . . . . . . . . . . . . . . . . . . . . . . . . . . . . . . . . . . . . . . . . . . . . 183
9.1 Simpson’s Paradox . . . . . . . . . . . . . . . . . . . . . . . . . . . . . . . . . . . . . . . . . 183
9.2 Consistent Treatment Selection . . . . . . . . . . . . . . . . . . . . . . . . . . . . . . . 189
9.3 General Aspects of Measuring Effects and Associations . . . . . . . . . . 194
9.4 Things to Do . . . . . . . . . . . . . . . . . . . . . . . . . . . . . . . . . . . . . . . . . . . . . . 196
10 Log-Linear Models: Definition . . . . . . . . . . . . . . . . . . . . . . . . . . . . . . . . . . . 197
10.1 Parameterizations of Multidimensional Discrete Distributions . . . . . 198
10.2 Generalizations of Independence . . . . . . . . . . . . . . . . . . . . . . . . . . . . . . 208
10.3 Log-Linear Models and Parameters . . . . . . . . . . . . . . . . . . . . . . . . . . . 213
10.4 Things to Do . . . . . . . . . . . . . . . . . . . . . . . . . . . . . . . . . . . . . . . . . . . . . . 222
11 Log-Linear Models: Interpretation . . . . . . . . . . . . . . . . . . . . . . . . . . . . . . . 225
11.1 The Regression Problem for Categorical Variables . . . . . . . . . . . . . . . 226
11.2 Interpretation in Regression Type and Non-regression Type
Problems . . . . . . . . . . . . . . . . . . . . . . . . . . . . . . . . . . . . . . . . . . . . . . . . . 230
11.3 Decomposable and Graphical Log-Linear Models . . . . . . . . . . . . . . . 239
11.4 Canonical Representation of Log-Linear Models . . . . . . . . . . . . . . . . 248
11.5 Things to Do . . . . . . . . . . . . . . . . . . . . . . . . . . . . . . . . . . . . . . . . . . . . . . 252
12 Log-Linear Models: Estimation . . . . . . . . . . . . . . . . . . . . . . . . . . . . . . . . . . 255
12.1 Maximum Likelihood Estimation . . . . . . . . . . . . . . . . . . . . . . . . . . . . . 255
12.2 Iterative Proportional Fitting . . . . . . . . . . . . . . . . . . . . . . . . . . . . . . . . . 259
12.3 Things to Do . . . . . . . . . . . . . . . . . . . . . . . . . . . . . . . . . . . . . . . . . . . . . . 266
13 What’s Next? . . . . . . . . . . . . . . . . . . . . . . . . . . . . . . . . . . . . . . . . . . . . . . . . . . 267
References . . . . . . . . . . . . . . . . . . . . . . . . . . . . . . . . . . . . . . . . . . . . . . . . . . . . . . . . . 277
Index . . . . . . . . . . . . . . . . . . . . . . . . . . . . . . . . . . . . . . . . . . . . . . . . . . . . . . . . . . . . . 281
�
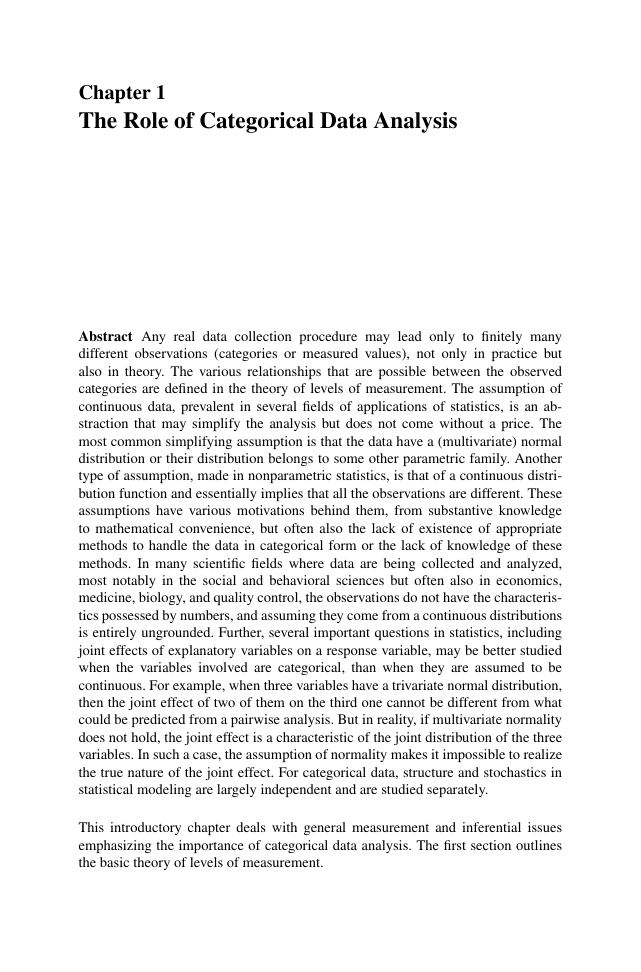
Chapter 1
The Role of Categorical Data Analysis
Abstract Any real data collection procedure may lead only to finitely many
different observations (categories or measured values), not only in practice but
also in theory. The various relationships that are possible between the observed
categories are defined in the theory of levels of measurement. The assumption of
continuous data, prevalent in several fields of applications of statistics, is an ab-
straction that may simplify the analysis but does not come without a price. The
most common simplifying assumption is that the data have a (multivariate) normal
distribution or their distribution belongs to some other parametric family. Another
type of assumption, made in nonparametric statistics, is that of a continuous distri-
bution function and essentially implies that all the observations are different. These
assumptions have various motivations behind them, from substantive knowledge
to mathematical convenience, but often also the lack of existence of appropriate
methods to handle the data in categorical form or the lack of knowledge of these
methods. In many scientific fields where data are being collected and analyzed,
most notably in the social and behavioral sciences but often also in economics,
medicine, biology, and quality control, the observations do not have the characteris-
tics possessed by numbers, and assuming they come from a continuous distributions
is entirely ungrounded. Further, several important questions in statistics, including
joint effects of explanatory variables on a response variable, may be better studied
when the variables involved are categorical, than when they are assumed to be
continuous. For example, when three variables have a trivariate normal distribution,
then the joint effect of two of them on the third one cannot be different from what
could be predicted from a pairwise analysis. But in reality, if multivariate normality
does not hold, the joint effect is a characteristic of the joint distribution of the three
variables. In such a case, the assumption of normality makes it impossible to realize
the true nature of the joint effect. For categorical data, structure and stochastics in
statistical modeling are largely independent and are studied separately.
This introductory chapter deals with general measurement and inferential issues
emphasizing the importance of categorical data analysis. The first section outlines
the basic theory of levels of measurement.
�




 2023年江西萍乡中考道德与法治真题及答案.doc
 2012年重庆南川中考生物真题及答案.doc
 2013年江西师范大学地理学综合及文艺理论基础考研真题.doc
 2020年四川甘孜小升初语文真题及答案I卷.doc
 2020年注册岩土工程师专业基础考试真题及答案.doc
 2023-2024学年福建省厦门市九年级上学期数学月考试题及答案.doc
 2021-2022学年辽宁省沈阳市大东区九年级上学期语文期末试题及答案.doc
 2022-2023学年北京东城区初三第一学期物理期末试卷及答案.doc
 2018上半年江西教师资格初中地理学科知识与教学能力真题及答案.doc
 2012年河北国家公务员申论考试真题及答案-省级.doc
 2020-2021学年江苏省扬州市江都区邵樊片九年级上学期数学第一次质量检测试题及答案.doc
 2022下半年黑龙江教师资格证中学综合素质真题及答案.doc