5
This chapter shows various ways of creating matching networks
by sweeping values and using optimization.
Lab 5: Matching & Optimization
�
Lab 5: Matching and Optimization
OBJECTIVES
• Create an input match to the RF and an output match to the IF
• Tune and Optimize to achieve matching goals
Mixer Design Note: From the Smith Chart S-11 results in the last
lab, it appears that a series inductor can be added to the input as a
first step in moving toward the center of the Smith chart for the RF
match at 900 MHz. However, this does not take into consideration
the other L and C components. But as a first step, it is reasonable to
add the series inductor and see the effects of tuning as ideal
components are replaced with real values.
PROCEDURE
1. Create a new schematic design for the input match.
a. Use the s_params design (last lab) and save it as: s_match.
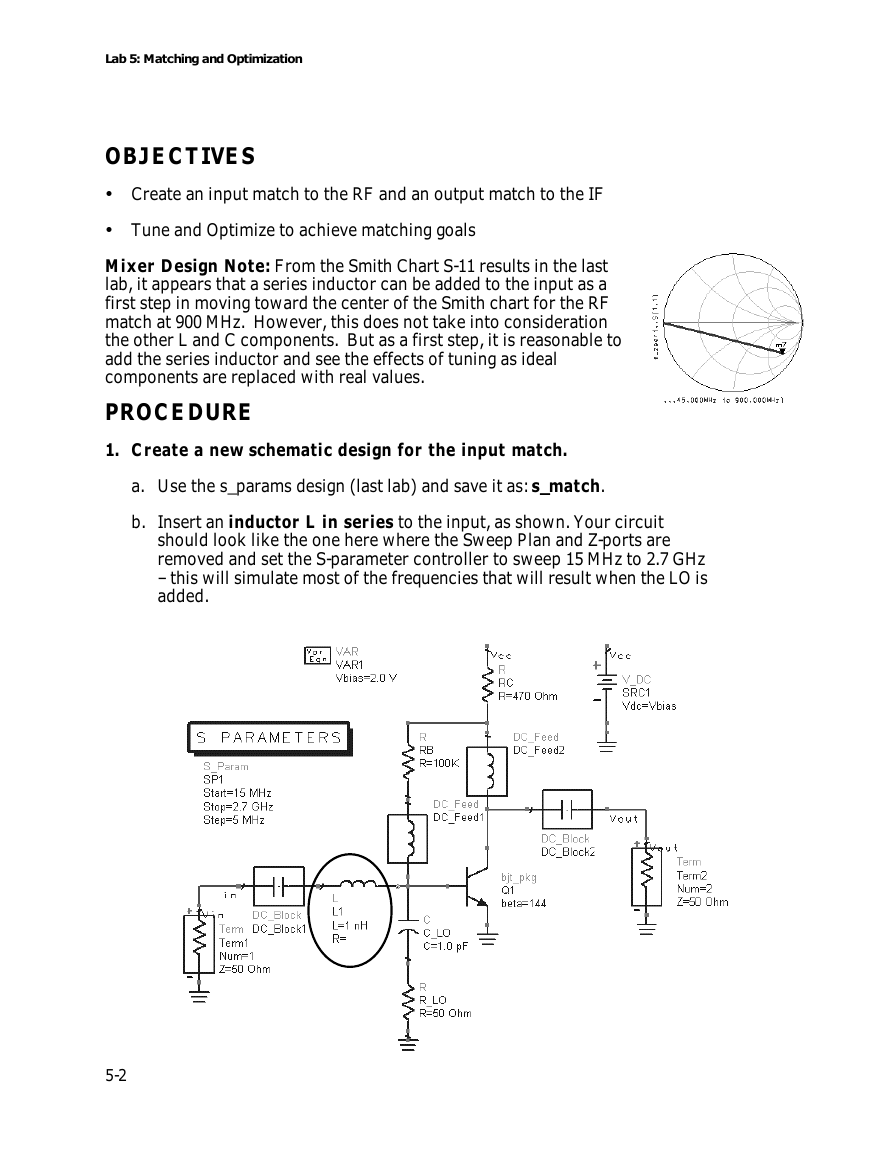
b. Insert an inductor L in series to the input, as shown. Your circuit
should look like the one here where the Sweep Plan and Z-ports are
removed and set the S-parameter controller to sweep 15 MHz to 2.7 GHz
– this will simulate most of the frequencies that will result when the LO is
added.
5-2
�
Lab 5: Matching and Optimization
c. Check the sub-circuit to be sure there is no capacitor across the base-
collector (from the last lab).
d. Simulate and display S-11 in a new data display window. Position the
dds window next to the schematic so you can see both at the same time.
The default dataset should be the same name as the schematic:
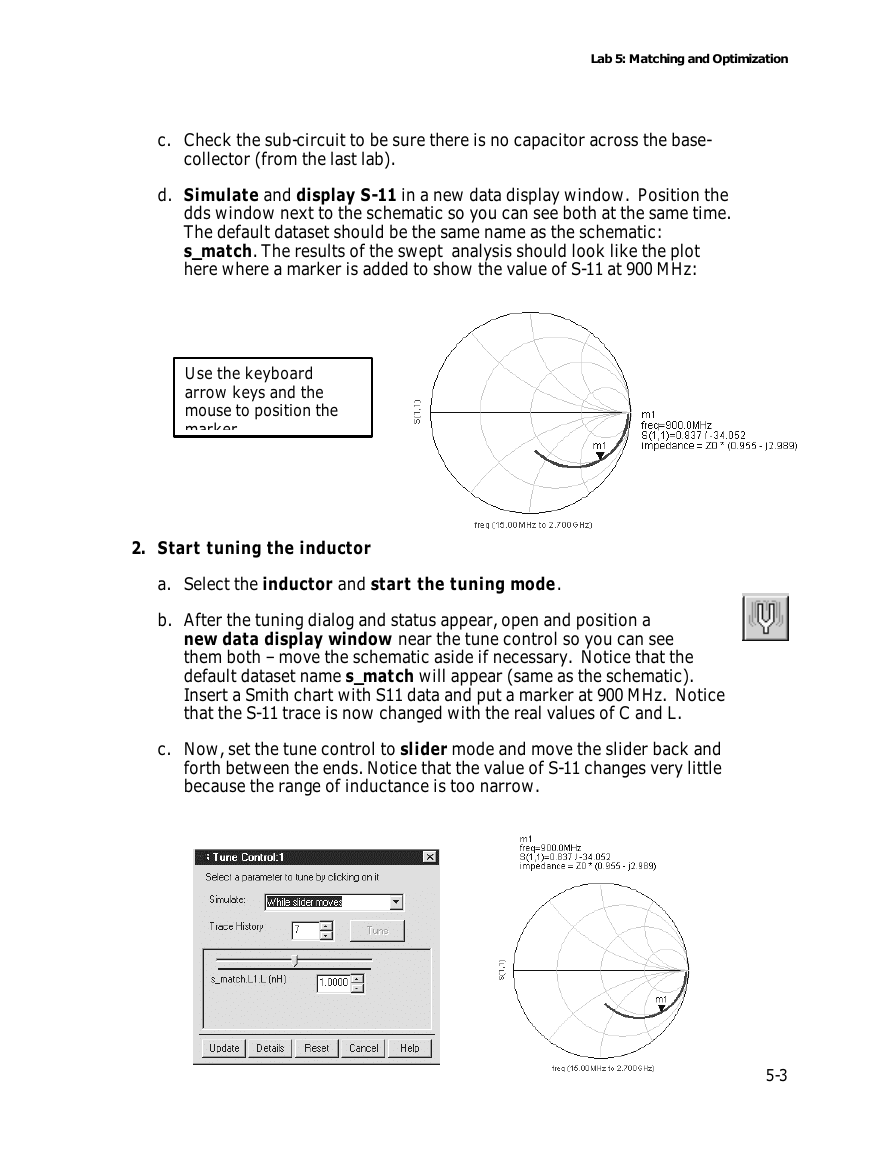
s_match. The results of the swept analysis should look like the plot
here where a marker is added to show the value of S-11 at 900 MHz:
Use the keyboard
arrow keys and the
mouse to position the
marker.
2. Start tuning the inductor
a. Select the inductor and start the tuning mode.
b. After the tuning dialog and status appear, open and position a
new data display window near the tune control so you can see
them both – move the schematic aside if necessary. Notice that the
default dataset name s_match will appear (same as the schematic).
Insert a Smith chart with S11 data and put a marker at 900 MHz. Notice
that the S-11 trace is now changed with the real values of C and L.
c. Now, set the tune control to slider mode and move the slider back and
forth between the ends. Notice that the value of S-11 changes very little
because the range of inductance is too narrow.
5-3
�
Lab 5: Matching and Optimization
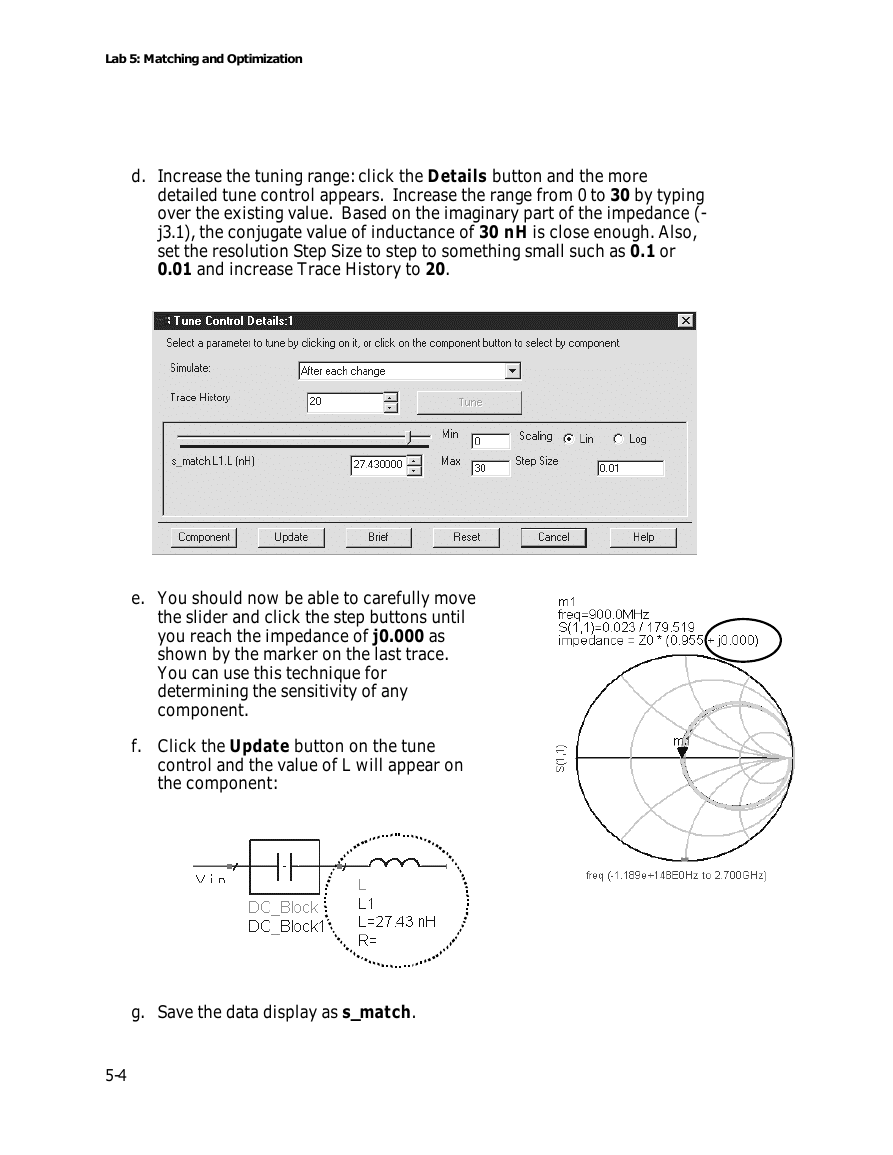
d. Increase the tuning range: click the Details button and the more
detailed tune control appears. Increase the range from 0 to 30 by typing
over the existing value. Based on the imaginary part of the impedance (-
j3.1), the conjugate value of inductance of 30 nH is close enough. Also,
set the resolution Step Size to step to something small such as 0.1 or
0.01 and increase Trace History to 20.
e. You should now be able to carefully move
the slider and click the step buttons until
you reach the impedance of j0.000 as
shown by the marker on the last trace.
You can use this technique for
determining the sensitivity of any
component.
f. Click the Update button on the tune
control and the value of L will appear on
the component:
g. Save the data display as s_match.
5-4
�
Lab 5: Matching and Optimization
3. Build a new input matching network (new configuration)
CIRCUIT DESIGN NOTE: At this point, the addition of the series inductor is only a
first approximation. The remaining ideal components ( DC feeds and blocks) must be
replaced by realistic values and this may require a completely different topology other
than just adding a series inductance. Also, a shunt capacitor needs to be added to the
input to remove the IF signal that may appear there. Therefore, instead of continuing
to add components in an attempt to create a match, you will use the following
configuration that will solve all the matching problems for the input. This will speed
up the lab exercise.
a. On the input, remove the series inductor you just tuned. It will be
replaced by a network which will achieve the desired RF match and also
provide the filtering.
b. Change the DC_Blocker to a real capacitor by highlighting the
component name (see drawing - DC_Block) and typing in the new
component name C and pressing Enter on the keyboard. The DC Block
will automatically become a lumped capacitor:
Highlight the name, type in
the new name, and press
Enter. omponent by typing
c. Continue modifying the
input topology: Insert
C=470 pF to shunt the IF
(470 pF is a short to 45
MHz). Also, change the
DC_Feed1 to L=16 nH to
allow the dc to flow but it
will block (choke) the RF.
Lastly, be sure the Z-ports
have been removed.
d. Simulate the new input
network with a new dataset
name: s_match_in.
5-5
�
Lab 5: Matching and Optimization
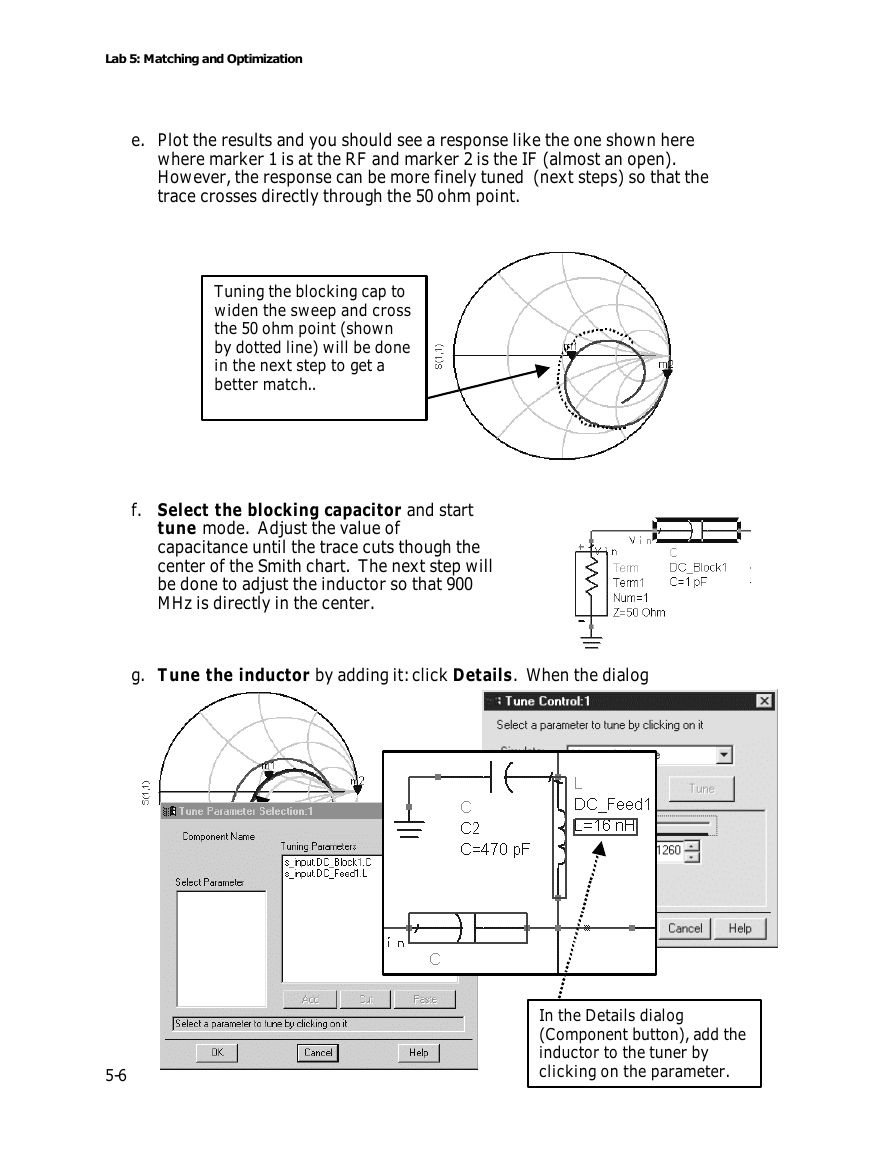
e. Plot the results and you should see a response like the one shown here
where marker 1 is at the RF and marker 2 is the IF (almost an open).
However, the response can be more finely tuned (next steps) so that the
trace crosses directly through the 50 ohm point.
Tuning the blocking cap to
widen the sweep and cross
the 50 ohm point (shown
by dotted line) will be done
in the next step to get a
better match..
f. Select the blocking capacitor and start
tune mode. Adjust the value of
capacitance until the trace cuts though the
center of the Smith chart. The next step will
be done to adjust the inductor so that 900
MHz is directly in the center.
g. Tune the inductor by adding it: click Details. When the dialog
Tuning produces trace cutting
through desired impedance. Next
step: tune L to decrease input
inductance and maker should be at
desired point.
5-6
In the Details dialog
(Component button), add the
inductor to the tuner by
clicking on the parameter.
�
Lab 5: Matching and Optimization
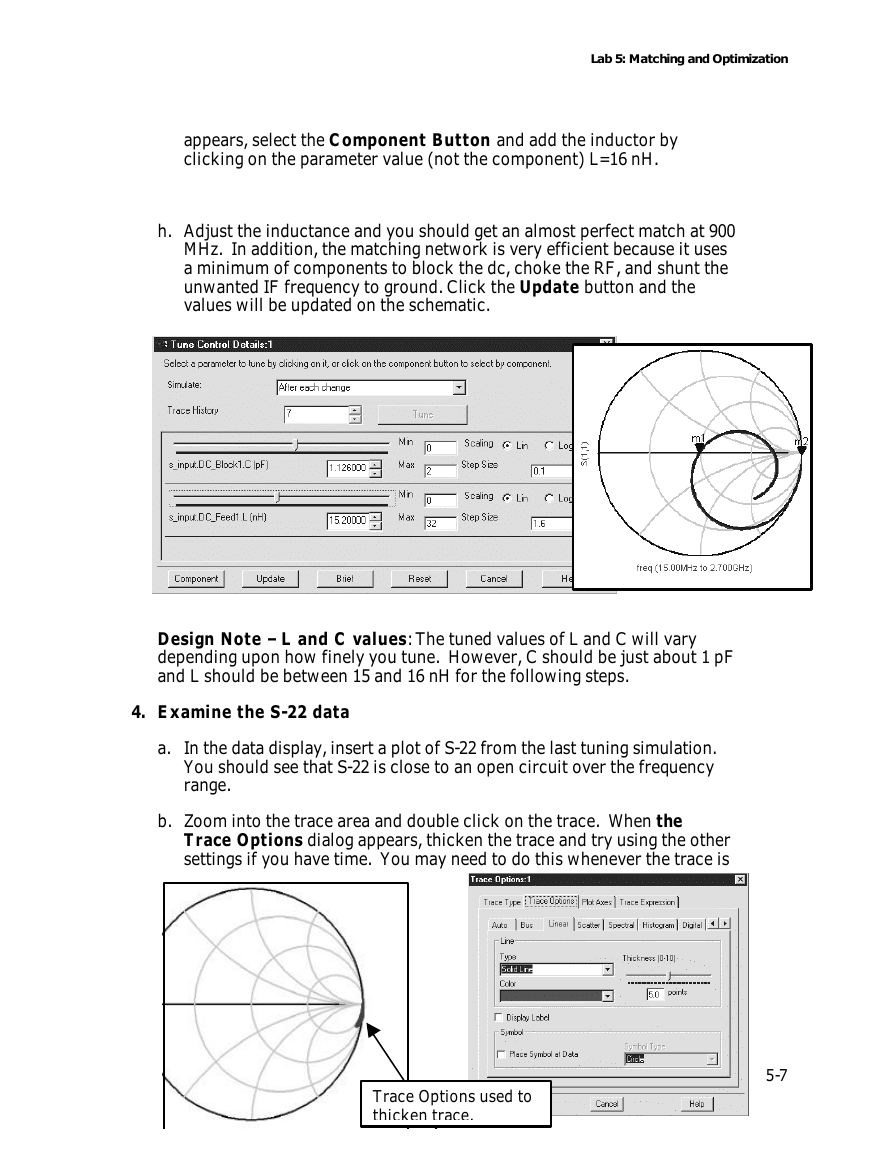
appears, select the Component Button and add the inductor by
clicking on the parameter value (not the component) L=16 nH.
h. Adjust the inductance and you should get an almost perfect match at 900
MHz. In addition, the matching network is very efficient because it uses
a minimum of components to block the dc, choke the RF, and shunt the
unwanted IF frequency to ground. Click the Update button and the
values will be updated on the schematic.
Design Note – L and C values: The tuned values of L and C will vary
depending upon how finely you tune. However, C should be just about 1 pF
and L should be between 15 and 16 nH for the following steps.
4. Examine the S-22 data
a. In the data display, insert a plot of S-22 from the last tuning simulation.
You should see that S-22 is close to an open circuit over the frequency
range.
b. Zoom into the trace area and double click on the trace. When the
Trace Options dialog appears, thicken the trace and try using the other
settings if you have time. You may need to do this whenever the trace is
Trace Options used to
thicken trace.
5-7
�
Lab 5: Matching and Optimization
difficult to see or when it is in a very narrow range. Build the output
circuit.
Output Match Design Note: For the next part of the lab exercise, you will use the
optimizer to achieve the output match with a given topology.
5. Build the IF output matching network
Build the output to look like the one shown here. The DC feed is a 100 nH inductor in
parallel with R_gain resistor (10K) which controls conversion gain. The capacitor
(RF_shunt = 1 pF) will help short higher frequencies. Looking into the transistor from
the 50 ohm load are two other capacitors for blocking (470 pF is a short to the IF) and
C_match for matching.
6. Simulate and plot the S-22 results
Simulate (dataset name= s_match_out) and
then note your results. The trace should be
similar to the one shown here. S-22 at 45 MHz
(shown by marker 3) is not matched to the
characteristic impedance of 50 ohms. While
you could use the tuner to try and achieve a
match, the optimizer can also achieve the
same goals.
Optimization NOTE: The following steps
show how to set up an optimization in three steps:
1) Enabling the components to be optimized, 2)
Defining the Goals, and 3) setting up the
Optimization control.
7. Enable the components to be optimized
a. Edit (double click) the DC_Feed2 inductor and click the
Optimization/Statistics Setup button.
5-8
�



 2023年江西萍乡中考道德与法治真题及答案.doc
 2012年重庆南川中考生物真题及答案.doc
 2013年江西师范大学地理学综合及文艺理论基础考研真题.doc
 2020年四川甘孜小升初语文真题及答案I卷.doc
 2020年注册岩土工程师专业基础考试真题及答案.doc
 2023-2024学年福建省厦门市九年级上学期数学月考试题及答案.doc
 2021-2022学年辽宁省沈阳市大东区九年级上学期语文期末试题及答案.doc
 2022-2023学年北京东城区初三第一学期物理期末试卷及答案.doc
 2018上半年江西教师资格初中地理学科知识与教学能力真题及答案.doc
 2012年河北国家公务员申论考试真题及答案-省级.doc
 2020-2021学年江苏省扬州市江都区邵樊片九年级上学期数学第一次质量检测试题及答案.doc
 2022下半年黑龙江教师资格证中学综合素质真题及答案.doc