第一章
1.1
Frequencies
x
N
S t a t i s t i c s
Valid
Missing
Mean
Median
Std. Deviation
Variance
Skewness
Std. Error of Skewness
Kurtosis
Std. Error of Kurtosis
Percentiles
25
50
75
60
0
139.0000
139.0000
7.06387
49.898
-.510
.309
-.126
.608
135.0000
139.0000
144.7500
x
Frequency
Percent
Valid Percent
Cumulative
Percent
1
1
1
1
2
1
2
3
2
3
1
5
4
5
1
2
6
2
2
2
3
4
1
3
1
1
60
1.7
1.7
1.7
1.7
3.3
1.7
3.3
5.0
3.3
5.0
1.7
8.3
6.7
8.3
1.7
3.3
10.0
3.3
3.3
3.3
5.0
6.7
1.7
5.0
1.7
1.7
100.0
1.7
1.7
1.7
1.7
3.3
1.7
3.3
5.0
3.3
5.0
1.7
8.3
6.7
8.3
1.7
3.3
10.0
3.3
3.3
3.3
5.0
6.7
1.7
5.0
1.7
1.7
100.0
1.7
3.3
5.0
6.7
10.0
11.7
15.0
20.0
23.3
28.3
30.0
38.3
45.0
53.3
55.0
58.3
68.3
71.7
75.0
78.3
83.3
90.0
91.7
96.7
98.3
100.0
Valid
120.00
123.00
126.00
127.00
128.00
129.00
131.00
132.00
134.00
135.00
136.00
137.00
138.00
139.00
140.00
141.00
142.00
143.00
144.00
145.00
146.00
147.00
148.00
149.00
150.00
151.00
Total
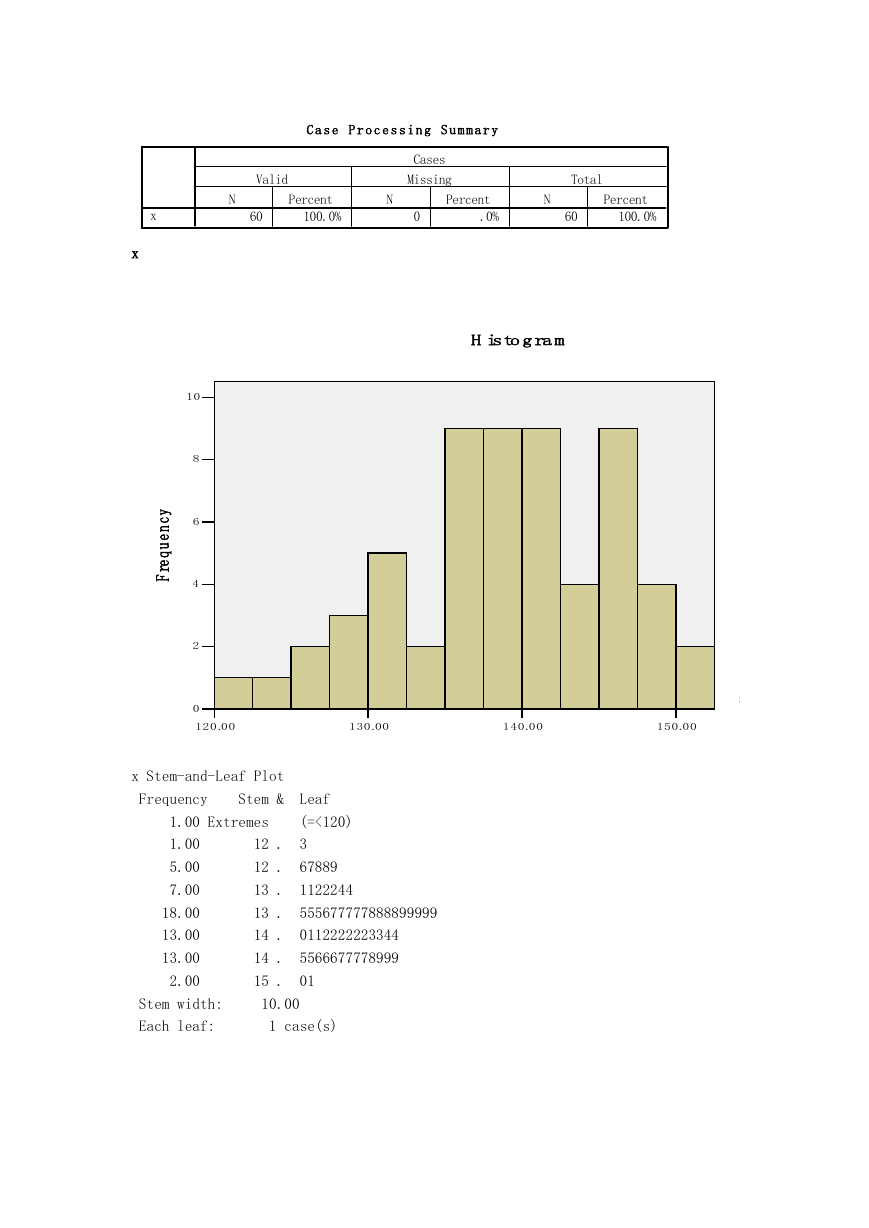
Explore
�
C a s e P r o c e s s i n g S u m m a r y
Valid
Cases
Missing
Total
N
60
Percent
100.0%
N
Percent
N
0
.0%
60
Percent
100.0%
H isto g ra m
x
x
y
c
n
e
u
q
e
r
F
10
8
6
4
2
0
120.00
130.00
140.00
150.00
x
x Stem-and-Leaf Plot
Stem &
Frequency
1.00 Extremes
1.00
5.00
7.00
18.00
13.00
13.00
2.00
12 .
12 .
13 .
13 .
14 .
14 .
15 .
Leaf
(=<120)
3
67889
1122244
555677777888899999
0112222223344
5566677778999
01
Stem width:
Each leaf:
10.00
1 case(s)
M ean = 139.00
S td. D ev. = 7.06387
N = 60
�
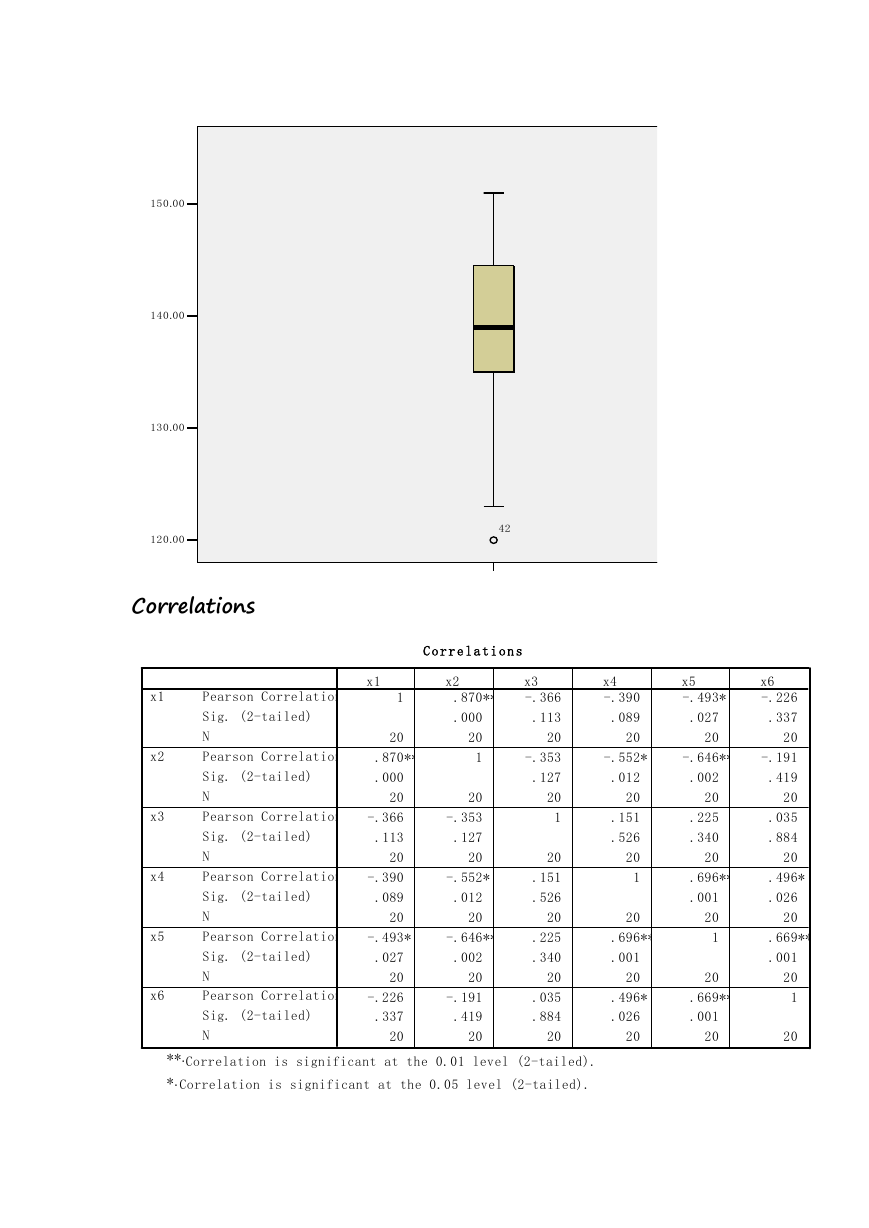
150.00
140.00
130.00
120.00
Correlations
42
x
C o r r e l a t i o n s
x1
x2
x1
x2
x3
x4
x5
x6
Pearson Correlation
Sig. (2-tailed)
N
Pearson Correlation
Sig. (2-tailed)
N
Pearson Correlation
Sig. (2-tailed)
N
Pearson Correlation
Sig. (2-tailed)
N
Pearson Correlation
Sig. (2-tailed)
N
Pearson Correlation
Sig. (2-tailed)
N
1
20
.870**
.000
20
-.366
.113
20
-.390
.089
20
-.493*
.027
20
-.226
.337
20
.870**
.000
20
1
20
-.353
.127
20
-.552*
.012
20
-.646**
.002
20
-.191
.419
20
x3
-.366
.113
20
-.353
.127
20
1
20
.151
.526
20
.225
.340
20
.035
.884
20
x4
-.390
.089
20
x5
-.493*
.027
20
-.552*
-.646**
.012
20
.151
.526
20
1
20
.696**
.001
20
.496*
.026
20
.002
20
.225
.340
20
.696**
.001
20
1
20
.669**
.001
20
x6
-.226
.337
20
-.191
.419
20
.035
.884
20
.496*
.026
20
.669**
.001
20
1
20
**.
Correlation is significant at the 0.01 level (2-tailed).
*.
Correlation is significant at the 0.05 level (2-tailed).
�
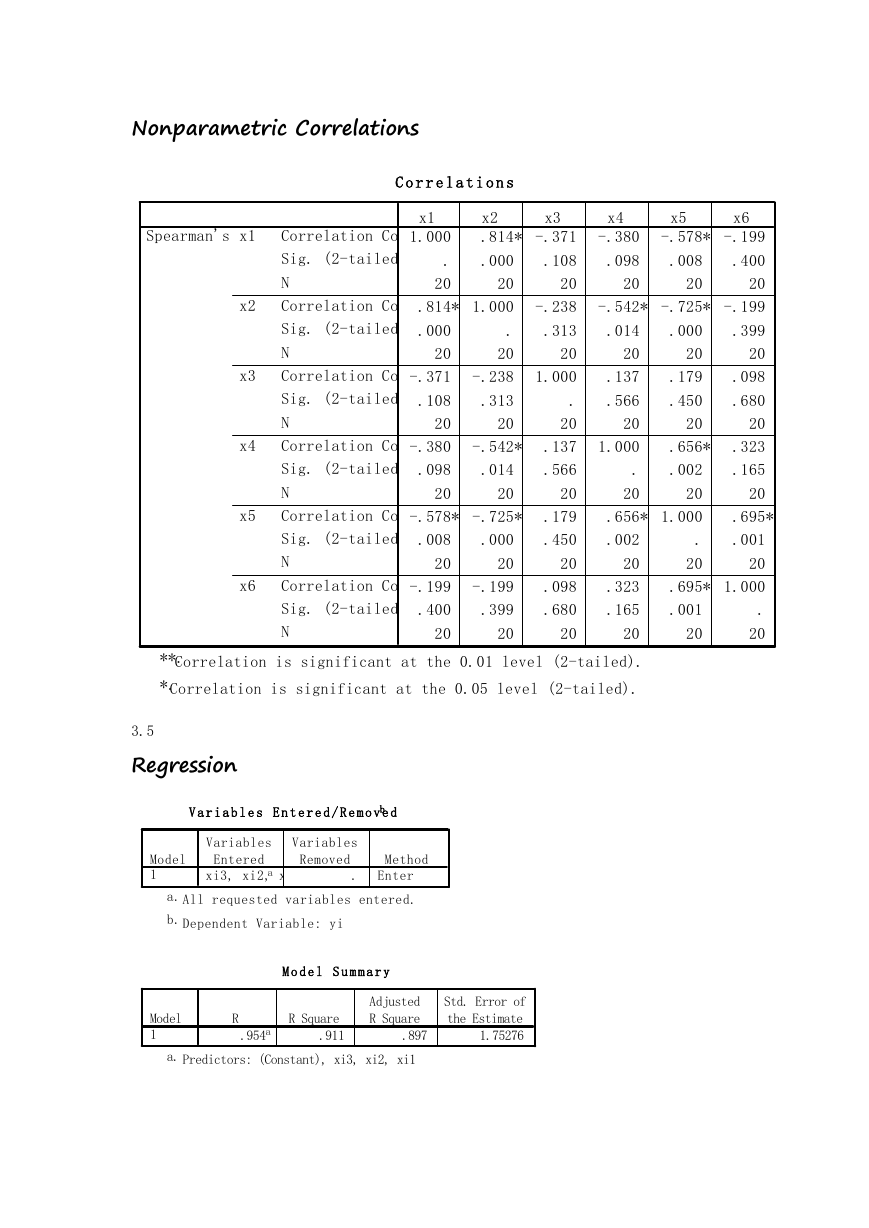
Nonparametric Correlations
C o r r e l a t i o n s
Spearman's rho
x1
x2
x3
x4
x5
x6
x1
x3
1.000
.
20
Correlation Coefficient
Sig. (2-tailed)
N
Correlation Coefficient
Sig. (2-tailed)
N
Correlation Coefficient
Sig. (2-tailed)
N
Correlation Coefficient
Sig. (2-tailed)
N
Correlation Coefficient
Sig. (2-tailed)
N
Correlation Coefficient
Sig. (2-tailed)
N
x2
.814** -.371
.000
.108
20
20
-.238
.814** 1.000
.000
.
.313
20
20
20
1.000
-.238
-.371
.108
.313
.
20
20
20
.137
-.380
.098
.566
20
20
-.578** -.725** .179
.450
20
.098
.680
20
.008
20
-.199
.400
20
.000
20
-.199
.399
20
.014
20
-.542*
x4
x5
x6
.008
20
-.380
.098
20
.000
20
.179
.450
20
.014
20
.137
.566
20
1.000
.
20
-.578** -.199
.400
20
-.542* -.725** -.199
.399
20
.098
.680
20
.656** .323
.002
.165
20
20
.656** 1.000
.
.002
20
20
.323
.165
20
.695**
.001
20
.695** 1.000
.
.001
20
20
**.
Correlation is significant at the 0.01 level (2-tailed).
*.
Correlation is significant at the 0.05 level (2-tailed).
3.5
Regression
V a r i a b l e s E n t e r e d / R e m o v e db
Variables
Variables
Model
1
Entered
Removed
Method
xi3, xi2, xi1
a
.
Enter
a.
All requested variables entered.
b.
Dependent Variable: yi
M o d e l S u m m a r y
Model
1
R
.954a
R Square
.911
Adjusted
R Square
.897
Std. Error of
the Estimate
1.75276
a.
Predictors: (Constant), xi3, xi2, xi1
�
Model
1
Regression
Residual
Total
Sum of
Squares
627.817
61.443
689.260
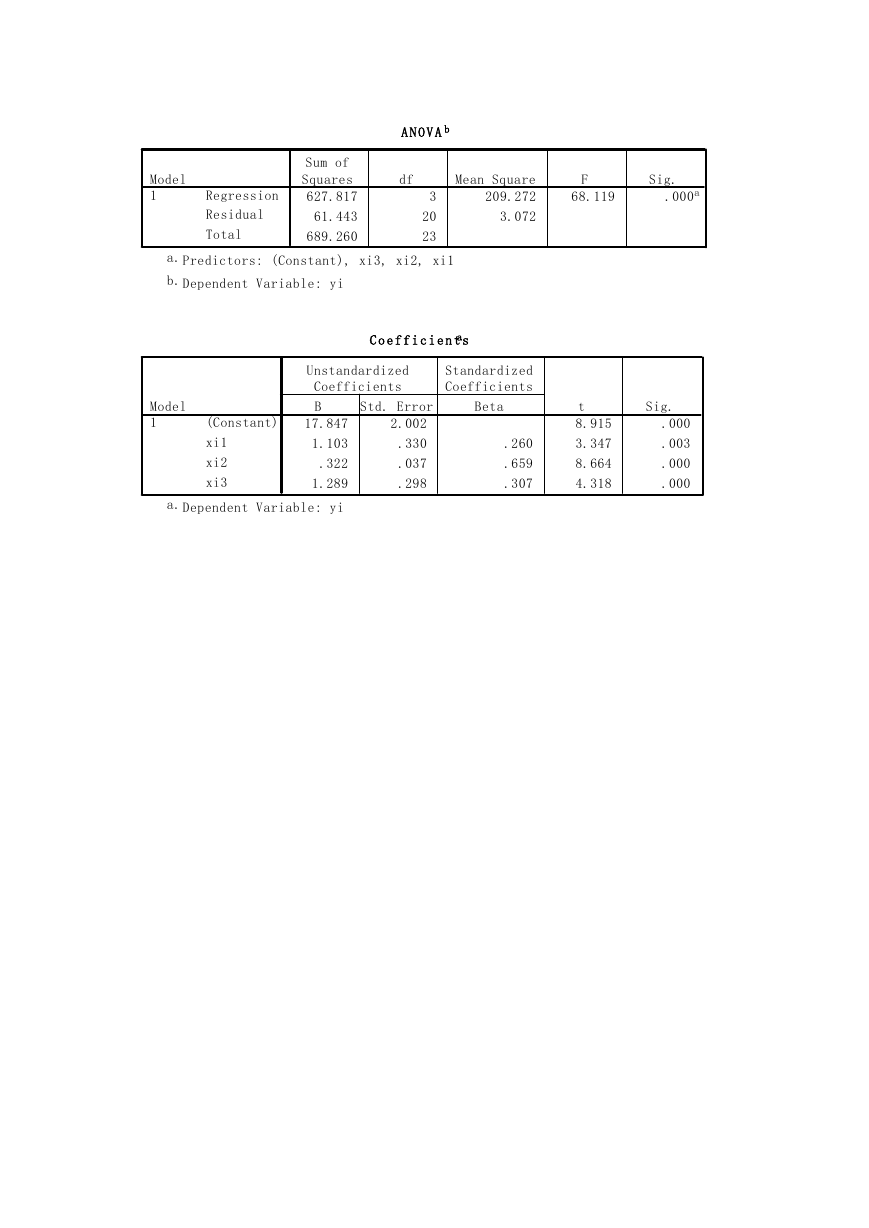
A N O V A b
df
3
20
23
a.
Predictors: (Constant), xi3, xi2, xi1
b.
Dependent Variable: yi
Mean Square
209.272
3.072
F
68.119
Sig.
.000a
C o e f f i c i e n t sa
Model
1
Unstandardized
Coefficients
B
(Constant)
xi1
xi2
xi3
17.847
1.103
.322
1.289
Std. Error
2.002
.330
.037
.298
Standardized
Coefficients
Beta
.260
.659
.307
t
8.915
3.347
8.664
4.318
Sig.
.000
.003
.000
.000
a.
Dependent Variable: yi
�


 2023年江西萍乡中考道德与法治真题及答案.doc
 2012年重庆南川中考生物真题及答案.doc
 2013年江西师范大学地理学综合及文艺理论基础考研真题.doc
 2020年四川甘孜小升初语文真题及答案I卷.doc
 2020年注册岩土工程师专业基础考试真题及答案.doc
 2023-2024学年福建省厦门市九年级上学期数学月考试题及答案.doc
 2021-2022学年辽宁省沈阳市大东区九年级上学期语文期末试题及答案.doc
 2022-2023学年北京东城区初三第一学期物理期末试卷及答案.doc
 2018上半年江西教师资格初中地理学科知识与教学能力真题及答案.doc
 2012年河北国家公务员申论考试真题及答案-省级.doc
 2020-2021学年江苏省扬州市江都区邵樊片九年级上学期数学第一次质量检测试题及答案.doc
 2022下半年黑龙江教师资格证中学综合素质真题及答案.doc