R
XAPP1033 (v1.0) December 5, 2007
Peak Cancellation Crest Factor Reduction
Reference Design
Authors: Ed Hemphill, Steve Summerfield, George Wang, and Dave Hawke
Application Note: Virtex-5 and Virtex-4 Family
Summary
Introduction
This application note provides designers with a highly optimized solution for Crest Factor
Reduction (CFR) that can be adapted to meet the needs of multiple air interfaces with minimum
effort. The system-level performance of the Peak Cancellation method of CFR is shown to be
better than other methods such as Peak Windowing and Noise Shaping. In addition, the Peak
Cancellation method can be implemented more efficiently than the other methods, resulting in
reduced overall cost.
Accompanying this application note are design files and test vectors for quickly evaluating the
performance of the reference design within MATLAB®. Instructions on how to integrate the
reference design into a larger system design are included. Design files are available for both
Virtex™-4 and Virtex-5 device architectures.
The wireless industry is currently following an aggressive drive to reduce Capital Expenditure
(CapEx) and Operating Expenditure (OpEx). Different dynamics can affect both of these to a
lesser or greater extent. If a typical base station is broken down into its constituent components,
it is estimated that an average of 40 to 60 percent of the overall CapEx cost is incurred with the
radio cards. Since the radio shelf contains the power amplifiers, the radio portion of the design
is also responsible for much of the OpEx incurred during the lifetime of the site. This is largely
due to the low efficiency of the power amplifiers when operating in a highly linear region.
The OpEx cost is directly related to the power amplifier efficiency in the base station. Currently,
a very small proportion of the DC power consumed by the base station is converted to radiated
energy. The efficiency at which a power amplifier may be operated is a function of the
transmitted signal. 3G signals have a high Peak to Average Power Ratio (PAPR) or Crest
Factor. This imposes significant operating restrictions on the power amplifier. In order to handle
the peaks, it is heavily backed off from its most efficient operating point. To increase efficiency,
CFR algorithms can be used to decrease the PAPR of the transmitted signal prior to it entering
the power amplifier. By doing so, the power amplifier can operate with less back off, and thus
increased efficiency. Another method of improving the efficiency of the power amplifier is to use
Digital Pre-Distortion (DPD). Rather than use digital signal processing to reduce the dynamic
range of the transmitted signal (CFR), DPD is used to linearize the power amplifier itself. DPD
is outside the scope of this document, but its reference is included as a widely used method of
amplifier efficiency improvement.
In multi-carrier systems, such as WCDMA, TD-SCDMA and CDMA2000, the PAPR of the
signal can be higher than in single carrier systems. In addition, the implementation of some
CFR methods, such as Noise Shaping, are costly for multi-carrier systems. The peak
cancellation CFR (PC-CFR) technique outlined in this application note is very well suited to
multi-carrier systems, and can even be applied to radios where multiple standards may be
required in the same radio transmission spectrum.
This application note also illustrates the dramatic reduction in dynamic power between
generations of FPGAs. This allows designers the ability to determine how much additional cost
savings can be made when evaluating both Power Supply and Heatsinking needs of traditional
chassis-mounted equipment and Remote Radio Head (RRH) applications.
© 2007 Xilinx, Inc. All rights reserved. XILINX, the Xilinx logo, and other designated brands included herein are trademarks of Xilinx, Inc. All other trademarks are the property
of their respective owners.
XAPP1033 (v1.0) December 5, 2007
www.xilinx.com
1
�
Description of Algorithm
Description of
Algorithm
R
This section gives an overview of the PC-CFR algorithm followed by detailed descriptions of
each main step in the algorithm. See OFDM for Wireless Multimedia Communications for an
overview of PAPR reduction techniques, including peak cancellation [Ref 1].
Algorithm Overview
The peak cancellation method of CFR reduces the peak to average power ratio (PAPR) of a
signal by subtracting spectrally shaped pulses from signal peaks that exceed a specified
threshold. The cancellation pulses are designed to have a spectrum that matches that of the
CFR input signal and therefore introduce negligible out-of-band interference. In general, the
CFR input signal and cancellation pulses are complex, and the peak search (described in
“Peak Detection,” page 4) is carried out on the signal magnitude.
Because the signals are complex, each cancellation pulse must be rotated to match the phase
of the corresponding signal peak. The peak magnitude of a given cancellation pulse is set
equal to the difference between the corresponding signal peak magnitude and the desired
clipping threshold. This method reduces the signal peak magnitudes to the threshold value
while preserving the signal phase.
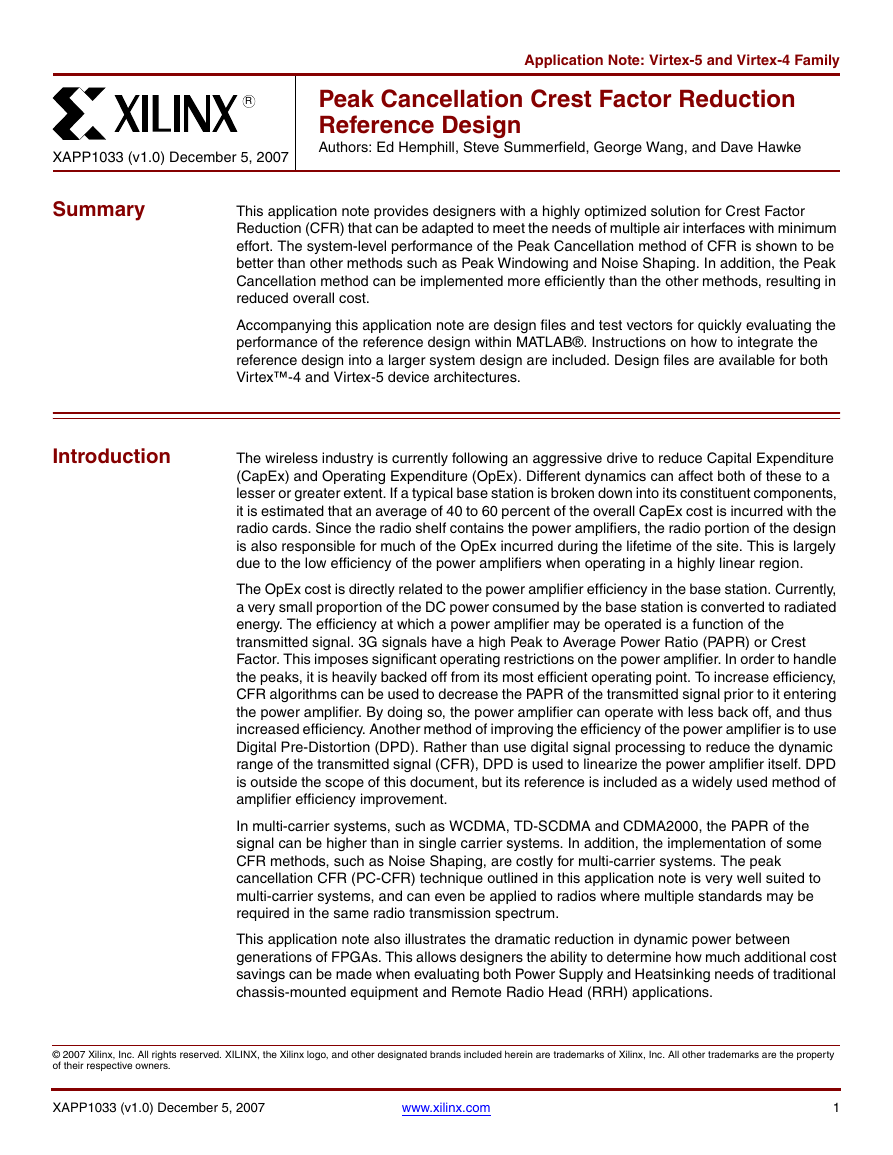
Figure 1 illustrates the peak cancellation process in the time domain. The top plot shows a
section of the input signal magnitude. The horizontal line overlaid on the plot indicates the
clipping threshold. Any peak that exceeds this threshold is a candidate for cancellation. The
middle plot shows the magnitude of the cancellation pulse that is to be subtracted from the
input signal. The bottom plot shows the magnitude of the output signal after subtracting the
cancellation pulse from the input signal.
X-Ref Target - Figure 1
x 104
CFR Input Signal Magnitude
e
d
u
t
i
n
g
a
M
e
d
u
t
i
n
g
a
M
e
d
u
t
i
n
g
a
M
2
1
0
2
1
0
2
1
0
0
x 104
0
x 104
100
200
300
400
500
600
700
800
900
1000
Cancellation Pulse Magnitude
100
200
300
400
500
600
700
800
900
1000
CFR Output Signal Magnitude
0
100
200
300
500
400
Time (Samples)
600
700
800
900
1000
Figure 1: Time Domain View of Peak Cancellation
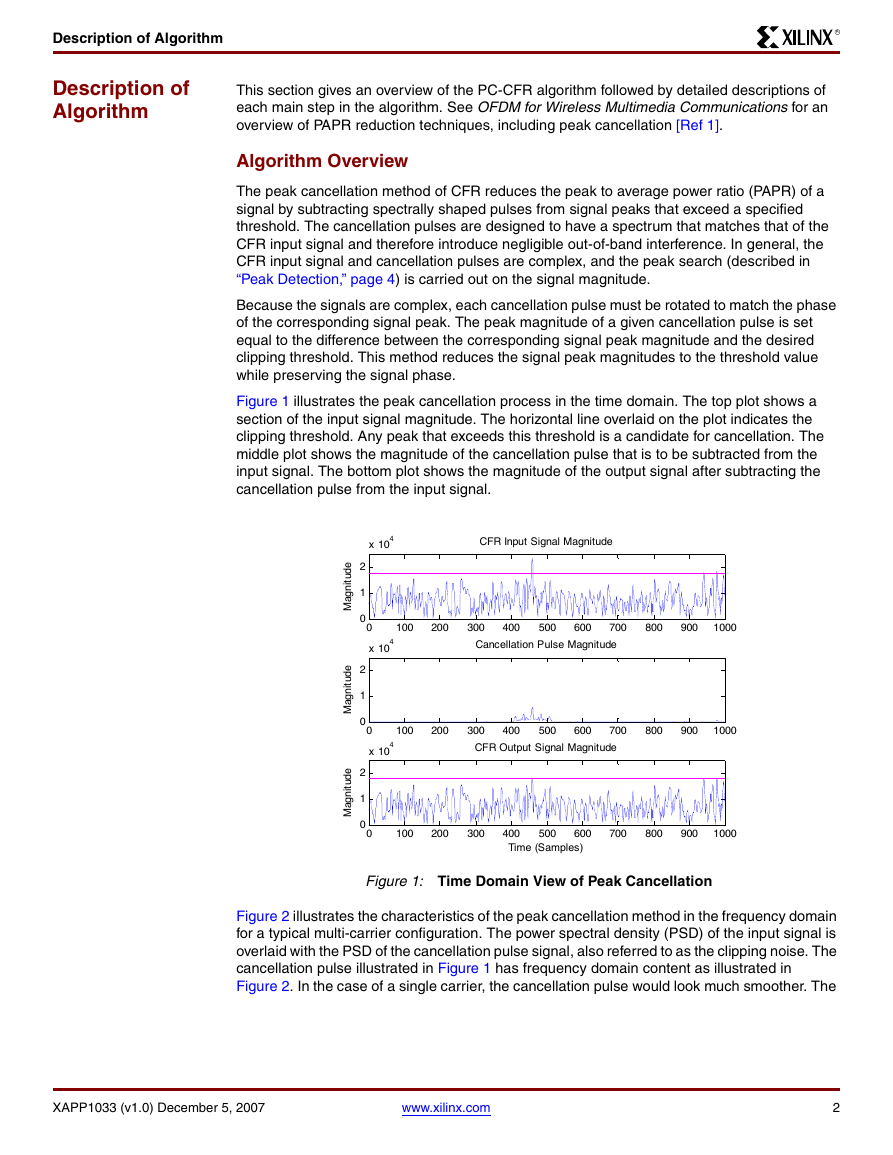
Figure 2 illustrates the characteristics of the peak cancellation method in the frequency domain
for a typical multi-carrier configuration. The power spectral density (PSD) of the input signal is
overlaid with the PSD of the cancellation pulse signal, also referred to as the clipping noise. The
cancellation pulse illustrated in Figure 1 has frequency domain content as illustrated in
Figure 2. In the case of a single carrier, the cancellation pulse would look much smoother. The
XAPP1033 (v1.0) December 5, 2007
www.xilinx.com
2
�
Description of Algorithm
R
somewhat noisy appearance of the cancellation pulse in the time domain is consistent with the
non-symmetric multi-carrier spectrum in the frequency domain.
X-Ref Target - Figure 2
100
80
60
B
d
40
20
0
-20
PSD of Clipping Noise
Signal
Noise
-15
-10
-5
0
5
10
15
Frequency (MHz)
Figure 2: Frequency Domain View of Peak Cancellation
The peak cancellation method is similar to the noise shaping method of CFR that is described
in XAPP921c, High Density WCDMA Digital Front End Reference Design [Ref 3]. In noise
shaping, the signal is clipped and then subtracted from the original to produce a clipping noise.
The clipping noise is filtered to confine its spectrum to that of the input signal. The spectrally
shaped clipping noise is then subtracted from the original input signal to produce a PAPR
reduced signal with minimal out-of-band degradation.
Whereas the noise shaping method filters all samples of the clipping noise, the peak
cancellation method filters only the peak samples of the clipping noise. Treating the peak
samples as discrete delta functions allows the convolution to be replaced by a simple scaling of
the filter impulse response. This results in less signal distortion because the time domain
spread at the filter output is smaller compared to the noise shaping method. Because the
filtering of the signal peaks is implemented via simple scaling of the filter impulse response, the
computational burden is greatly reduced.
Algorithm Details
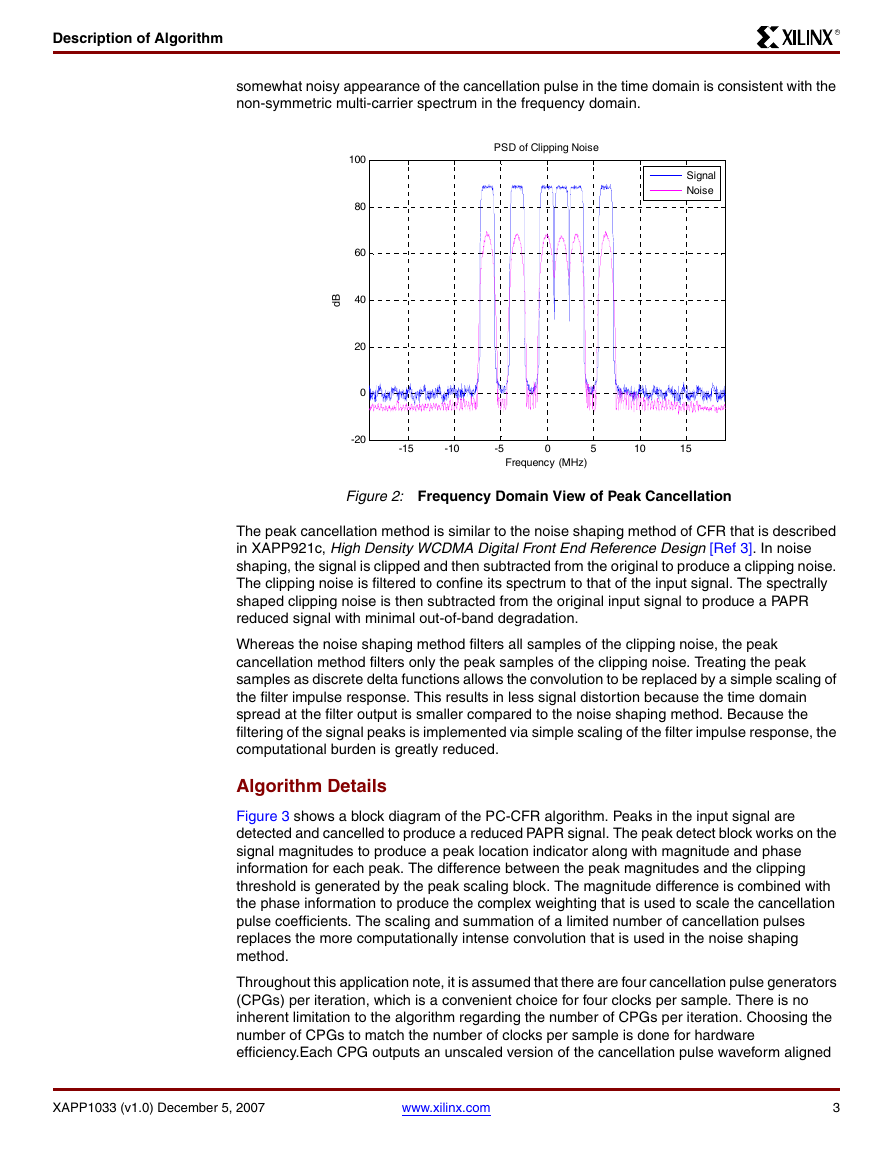
Figure 3 shows a block diagram of the PC-CFR algorithm. Peaks in the input signal are
detected and cancelled to produce a reduced PAPR signal. The peak detect block works on the
signal magnitudes to produce a peak location indicator along with magnitude and phase
information for each peak. The difference between the peak magnitudes and the clipping
threshold is generated by the peak scaling block. The magnitude difference is combined with
the phase information to produce the complex weighting that is used to scale the cancellation
pulse coefficients. The scaling and summation of a limited number of cancellation pulses
replaces the more computationally intense convolution that is used in the noise shaping
method.
Throughout this application note, it is assumed that there are four cancellation pulse generators
(CPGs) per iteration, which is a convenient choice for four clocks per sample. There is no
inherent limitation to the algorithm regarding the number of CPGs per iteration. Choosing the
number of CPGs to match the number of clocks per sample is done for hardware
efficiency.Each CPG outputs an unscaled version of the cancellation pulse waveform aligned
XAPP1033 (v1.0) December 5, 2007
www.xilinx.com
3
�
Description of Algorithm
R
X-Ref Target - Figure 3
High
PAPR
Signal
with a peak location. Each CPG can cancel only one peak at a time. The length of the
cancellation pulse combined with the number of CPGs determines the rate at which signal
peaks can be cancelled. The allocator block controls the distribution of CPGs to incoming
peaks. When a new peak is detected, the allocator assigns an available CPG to the
cancellation of that peak. If all CPGs are busy when a new peak is detected, it will not be
cancelled. Multiple iterations of the algorithm are necessary to eliminate the peaks that were
not cancelled during an earlier pass of the algorithm. The final step in the algorithm is to
subtract the summation of the CPG outputs from a delayed version of the input signal.
Peak
Detect
Peak
Locations
Allocator
Delay
Mag
Phase
Peak
Scaling
Reduced
PAPR
Signal
×
×
CPG #1
CPG #2
CPG #3
CPG #4
Sum
×
×
Figure 3: Block Diagram of PC-CFR Algorithm
Peak Detection
There are multiple ways to define a signal peak. One common method defines a peak as any
sample that has magnitude greater than its neighboring samples. This method has the
advantage that it is simple to implement and results in a fixed delay from the detection of the
peak to the peak location. However, it has the disadvantage that it may result in the detection of
many local peaks in a single over-threshold region. Attempting to cancel many closely spaced
peaks at once can lead to constructive interference of the cancellation pulses and leads to peak
regrowth. Moreover, the allocation of CPGs will be less than optimal because a cluster of peaks
may consume all the CPG resources.
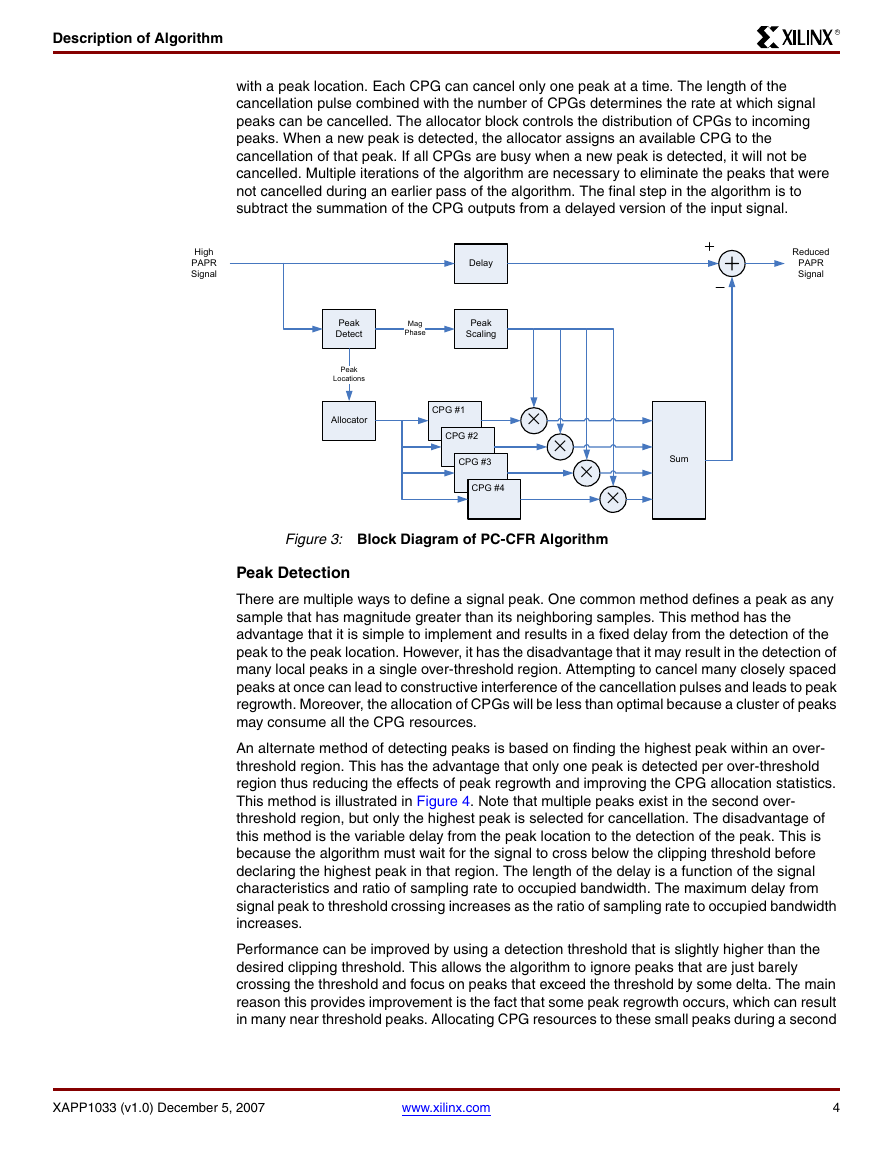
An alternate method of detecting peaks is based on finding the highest peak within an over-
threshold region. This has the advantage that only one peak is detected per over-threshold
region thus reducing the effects of peak regrowth and improving the CPG allocation statistics.
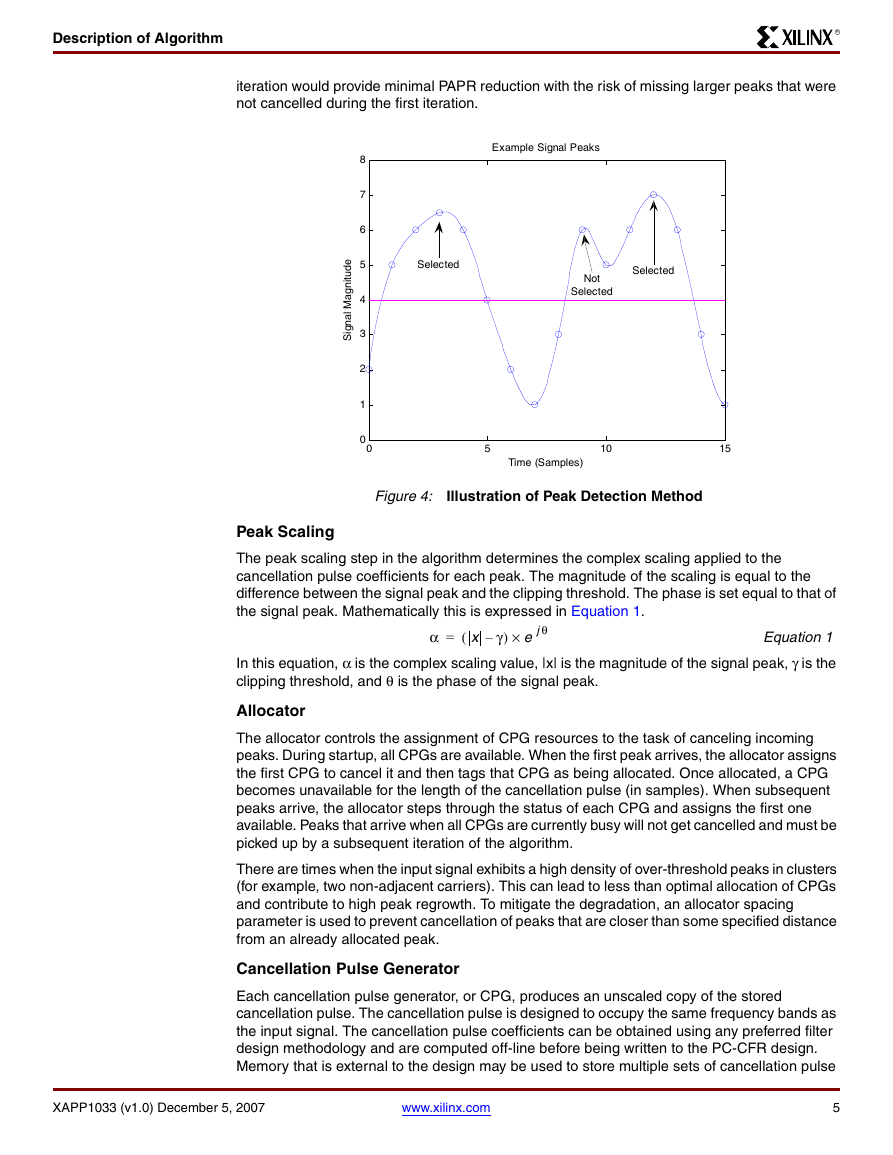
This method is illustrated in Figure 4. Note that multiple peaks exist in the second over-
threshold region, but only the highest peak is selected for cancellation. The disadvantage of
this method is the variable delay from the peak location to the detection of the peak. This is
because the algorithm must wait for the signal to cross below the clipping threshold before
declaring the highest peak in that region. The length of the delay is a function of the signal
characteristics and ratio of sampling rate to occupied bandwidth. The maximum delay from
signal peak to threshold crossing increases as the ratio of sampling rate to occupied bandwidth
increases.
Performance can be improved by using a detection threshold that is slightly higher than the
desired clipping threshold. This allows the algorithm to ignore peaks that are just barely
crossing the threshold and focus on peaks that exceed the threshold by some delta. The main
reason this provides improvement is the fact that some peak regrowth occurs, which can result
in many near threshold peaks. Allocating CPG resources to these small peaks during a second
XAPP1033 (v1.0) December 5, 2007
www.xilinx.com
4
�
Description of Algorithm
R
iteration would provide minimal PAPR reduction with the risk of missing larger peaks that were
not cancelled during the first iteration.
X-Ref Target - Figure 4
e
d
u
t
i
n
g
a
M
l
a
n
g
S
i
Peak Scaling
8
7
6
5
4
3
2
1
0
0
Example Signal Peaks
Selected
Selected
Not
Selected
5
10
15
Time (Samples)
Figure 4: Illustration of Peak Detection Method
The peak scaling step in the algorithm determines the complex scaling applied to the
cancellation pulse coefficients for each peak. The magnitude of the scaling is equal to the
difference between the signal peak and the clipping threshold. The phase is set equal to that of
the signal peak. Mathematically this is expressed in Equation 1.
(
x γ–
) e jθ
×
Equation1
In this equation, α is the complex scaling value, |x| is the magnitude of the signal peak, γ is the
clipping threshold, and θ is the phase of the signal peak.
α
=
Allocator
The allocator controls the assignment of CPG resources to the task of canceling incoming
peaks. During startup, all CPGs are available. When the first peak arrives, the allocator assigns
the first CPG to cancel it and then tags that CPG as being allocated. Once allocated, a CPG
becomes unavailable for the length of the cancellation pulse (in samples). When subsequent
peaks arrive, the allocator steps through the status of each CPG and assigns the first one
available. Peaks that arrive when all CPGs are currently busy will not get cancelled and must be
picked up by a subsequent iteration of the algorithm.
There are times when the input signal exhibits a high density of over-threshold peaks in clusters
(for example, two non-adjacent carriers). This can lead to less than optimal allocation of CPGs
and contribute to high peak regrowth. To mitigate the degradation, an allocator spacing
parameter is used to prevent cancellation of peaks that are closer than some specified distance
from an already allocated peak.
Cancellation Pulse Generator
Each cancellation pulse generator, or CPG, produces an unscaled copy of the stored
cancellation pulse. The cancellation pulse is designed to occupy the same frequency bands as
the input signal. The cancellation pulse coefficients can be obtained using any preferred filter
design methodology and are computed off-line before being written to the PC-CFR design.
Memory that is external to the design may be used to store multiple sets of cancellation pulse
XAPP1033 (v1.0) December 5, 2007
www.xilinx.com
5
�
Description of Algorithm
R
coefficients corresponding to pre-determined carrier configurations. Transferring a selected set
of coefficients into the PC-CFR memory can be handled with some simple multiplexing
circuitry. Handling configurations that are not pre-determined requires additional processing as
outlined in the remainder of this section.
For multi-carrier configurations, it is useful to first design a prototype filter that is matched to the
spectrum of a single carrier. Frequency shifted replicas of the prototype filter are then placed at
each carrier center frequency before being summed to create a composite multi-band filter. An
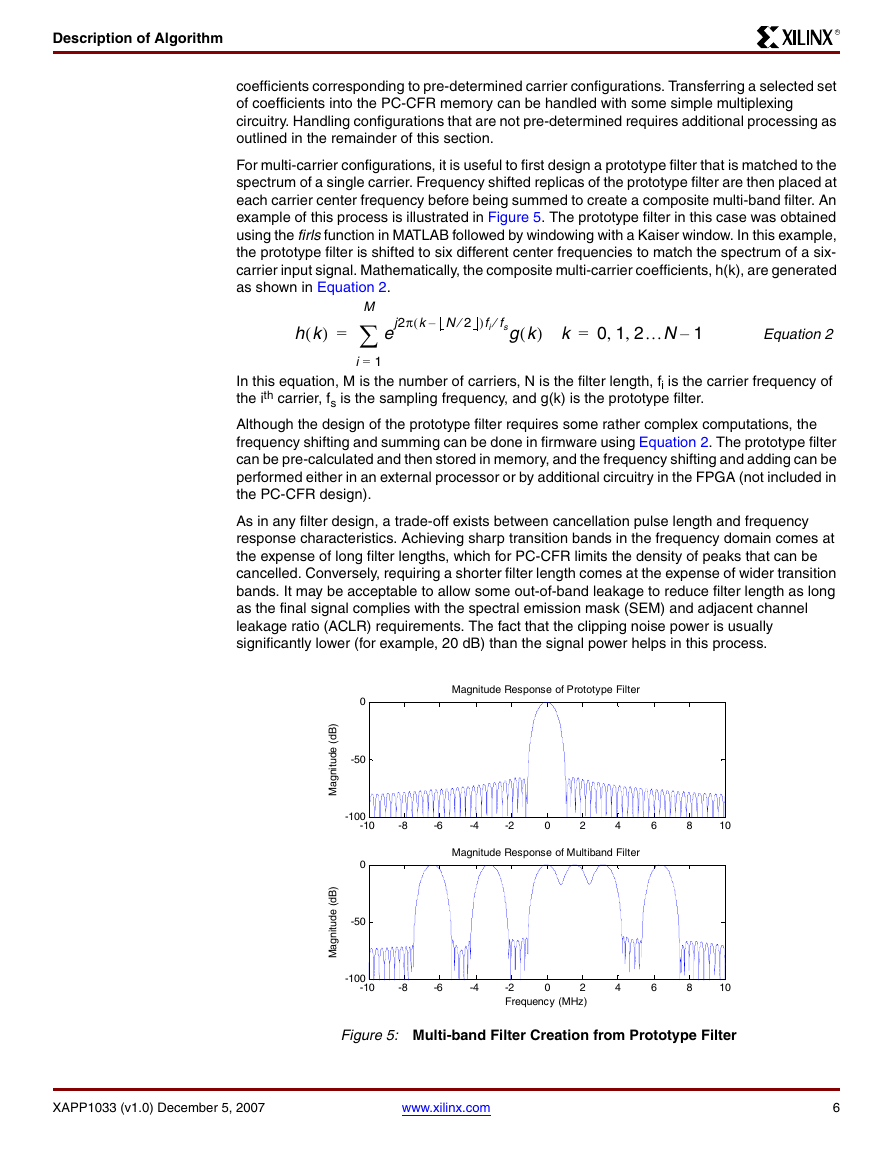
example of this process is illustrated in Figure 5. The prototype filter in this case was obtained
using the firls function in MATLAB followed by windowing with a Kaiser window. In this example,
the prototype filter is shifted to six different center frequencies to match the spectrum of a six-
carrier input signal. Mathematically, the composite multi-carrier coefficients, h(k), are generated
as shown in Equation 2.
h k( )
=
M
∑
i 1=
j2π k N 2⁄
–(
e
)fi fs⁄
g k( ) k
=
0 1 2…N 1–
,
,
Equation2
In this equation, M is the number of carriers, N is the filter length, fi is the carrier frequency of
the ith carrier, fs is the sampling frequency, and g(k) is the prototype filter.
Although the design of the prototype filter requires some rather complex computations, the
frequency shifting and summing can be done in firmware using Equation 2. The prototype filter
can be pre-calculated and then stored in memory, and the frequency shifting and adding can be
performed either in an external processor or by additional circuitry in the FPGA (not included in
the PC-CFR design).
As in any filter design, a trade-off exists between cancellation pulse length and frequency
response characteristics. Achieving sharp transition bands in the frequency domain comes at
the expense of long filter lengths, which for PC-CFR limits the density of peaks that can be
cancelled. Conversely, requiring a shorter filter length comes at the expense of wider transition
bands. It may be acceptable to allow some out-of-band leakage to reduce filter length as long
as the final signal complies with the spectral emission mask (SEM) and adjacent channel
leakage ratio (ACLR) requirements. The fact that the clipping noise power is usually
significantly lower (for example, 20 dB) than the signal power helps in this process.
Magnitude Response of Prototype Filter
-8
-6
-4
-2
0
2
4
6
8
10
Magnitude Response of Multiband Filter
X-Ref Target - Figure 5
0
-50
-100
-10
0
-50
)
B
d
(
e
d
u
t
i
n
g
a
M
)
B
d
(
e
d
u
t
i
n
g
a
M
-100
-10
-8
-6
-4
0
-2
2
Frequency (MHz)
4
6
8
10
Figure 5: Multi-band Filter Creation from Prototype Filter
XAPP1033 (v1.0) December 5, 2007
www.xilinx.com
6
�
CFR Performance
R
CFR
Performance
One of the key features of the PC-CFR algorithm is its ability to support multiple air interface
standards simply by changing the prototype filter. In fact, multiple prototype filters could be
combined to support multiple air interfaces simultaneously. For example, a 5 MHz WCDMA
carrier could coexist with a 10 MHz WiMAX carrier by shifting the individual prototype filters to
the corresponding center frequencies of each carrier.
This section summarizes the performance of the PC-CFR algorithm using TD-SCDMA as an
example. The methodology and assumptions are included, as well as detailed performance
results. “Comparison to Other Methods,” page 11, compares the performance of the PC-CFR
method with two other popular methods: peak windowing CFR (PW-CFR) and noise shaping
CFR (NS-CFR). Although the results shown are for TD-SCDMA, the general conclusions are
expected to hold for other air interface standards such as WCDMA, WiMAX, and 3GPP LTE.
Methodology and Assumptions
The results presented in this section were obtained using Gaussian baseband data per TD-
SCDMA time slot. Each time slot contains 864 chips worth of data; the last 16 of which are
zeroed to model the TD-SCDMA guard period. The chip rate is 1.28 Mcps, and the CFR output
sample rate is 76.8 Msps for an interpolation factor of 60 samples per chip. Up to six active
carriers may be present and each carrier occupies a bandwidth of 1.6 MHz. A total bandwidth
of 10 MHz is allocated for six adjacent carriers and 15 MHz for six non-adjacent carriers. The
baseband data for each carrier is interpolated by 60 and pulse shaped using a square-root
raised-cosine (RRC) filter with roll-off parameter equaling 0.22 as defined in 3GPP TS 25.105
[Ref 2].
The 3GPP TS 25.105 specification defines the EVM measurement interval to be one time slot.
The results presented here are based on 10 time slots worth of data, where each time slot has
equal average power. The reason for doing this is that 864 chips worth of data are not sufficient
to provide statistically significant PAPR results at the 0.01% probability of clip point. In order to
obtain reasonably accurate complementary cumulative distribution function (CCDF) curves, it
is necessary to run the simulations for 8640 chips.
The baseline requirements for the CFR performance are listed in Table 1. The spectral
emission mask (SEM) is modified from the one defined in 3GPP TS 25.105 to be consistent
with a more stringent ACLR requirement of 60 dB.
In this document, the following definition of EVM is used:
EVM 100
=
×
σ
x αy–
----------------
σ
x
Equation3
In this equation, σx is the standard deviation of the CFR input signal and σx-αy is the standard
deviation of the error between the CFR input signal and a scaled version of the CFR output
signal. The scaling term α is obtained by performing a least-squares fit between the CFR input
and output signals. This definition results in a single measure of EVM for the composite multi-
carrier waveform. There may be some variation between carriers when measuring EVM after
RRC matched filtering, but the variations are typically within a few tenths of a percent of the
composite multi-carrier EVM.
Table 1: CFR Performance Requirements
Parameter
PAPR Reduction
EVM
Requirement
Comments
> 3.0 dB @ 0.01% in 10 MHz bandwidth
> 2.8 dB @ 0.01% in 15 MHz bandwidth
≤ 7%
XAPP1033 (v1.0) December 5, 2007
www.xilinx.com
7
�
CFR Performance
R
Table 1: CFR Performance Requirements
Parameter
Requirement
Comments
ACLR
SEM
> 60 dB
> 40 dB attenuation at 0.8 MHz offset
> 60 dB attenuation beyond 1.0 MHz offset
Exceeds the 3 GPP TS
25.105 requirements
Results for four different carrier configurations are presented. The definition of each
configuration is listed in Table 2. An emphasis is placed on the six non-adjacent carrier case
because it covers what is believed to be a challenging yet realistic carrier configuration. The two
non-adjacent carriers case is typically the worst case scenario in terms of stressing a CFR
algorithm, but this case may not be very common in a TD-SCDMA system. The three adjacent
and six adjacent carrier cases are expected to be more common, and typically result in better
CFR performance than when the carriers are not adjacent.
Table 2: Carrier Configurations
Description
Carrier Center Frequencies (MHz)
Six non-adjacent carriers
Two non-adjacent carriers
Three adjacent carriers
Six adjacent carriers
PC-CFR Performance
[-6.4, -3.2, 0, 1.6, 3.2, 6.4]
[-4.0, 4.0]
[-1.6, 0, 1.6]
[-4.0, -2.4, -0.8, 0.8, 2.4, 4.0]
This section summarizes the performance of the PC-CFR method. In all cases, the number of
cancellation pulse generators is four and the length of the cancellation pulse is 255. Although
not shown, good results can also be obtained using a different number of CPGs per iteration.
Tradeoffs between the number of CPGs per iteration, filter length, and the number of iterations
can be made to tune performance. The cancellation pulse was designed using the firls function
in MATLAB with Fpass=0.9/Fs and Fstop=1.3×Fpass followed by windowing with a Kaiser window
(β=5). Results are presented based on using either two or three iterations of the algorithm.
Table 3 shows the PAPR reduction (dPAPR) versus EVM performance of the PC-CFR
algorithm when using only two iterations for the six non-adjacent carrier case. All dPAPR results
are referenced at the 0.01% probability of clip point. The PAPR of the CFR input signal is 9.91
dB. The clipping ratio is defined as the ratio of the clipping threshold to the standard deviation
of the CFR input signal expressed in dB. The performance when using three iterations is shown
in Table 4. With the exception of the highest EVM, there is no improvement in going from two
iterations to three iterations for this case.
The upper and lower ACLR values are calculated as described in 3GPP TS 25.105 [Ref 2]. The
upper ACLR is measured using the first adjacent channel to the right of the highest active
carrier. The lower ACLR is measured using the first adjacent channel to the left of the highest
active carrier. For cases where the highest active carrier is adjacent to another active carrier,
and assuming the carriers have equal power, the lower ACLR should be close to 0 dB.
As was mentioned in “Cancellation Pulse Generator,” page 5, a trade-off exists between
cancellation pulse length and frequency response characteristics. Longer pulse lengths can
provide better spectral performance at the expense of increased EVM. Even when the filter
length is held constant, a tradeoff exists between frequency-domain performance and time-
domain performance. For example, if Fpass = 0.6/Fs and Fstop = 1.0/Fs, then the upper ACLR in
XAPP1033 (v1.0) December 5, 2007
www.xilinx.com
8
�


 2023年江西萍乡中考道德与法治真题及答案.doc
 2012年重庆南川中考生物真题及答案.doc
 2013年江西师范大学地理学综合及文艺理论基础考研真题.doc
 2020年四川甘孜小升初语文真题及答案I卷.doc
 2020年注册岩土工程师专业基础考试真题及答案.doc
 2023-2024学年福建省厦门市九年级上学期数学月考试题及答案.doc
 2021-2022学年辽宁省沈阳市大东区九年级上学期语文期末试题及答案.doc
 2022-2023学年北京东城区初三第一学期物理期末试卷及答案.doc
 2018上半年江西教师资格初中地理学科知识与教学能力真题及答案.doc
 2012年河北国家公务员申论考试真题及答案-省级.doc
 2020-2021学年江苏省扬州市江都区邵樊片九年级上学期数学第一次质量检测试题及答案.doc
 2022下半年黑龙江教师资格证中学综合素质真题及答案.doc