logo资料库

SaTScan-User-Guide.pdf

第1页 / 共109页
第2页 / 共109页
第3页 / 共109页
第4页 / 共109页
第5页 / 共109页
第6页 / 共109页
第7页 / 共109页
第8页 / 共109页
资料共109页,剩余部分请下载后查看
Introduction
The SaTScan Software
Purpose
Data Types and Methods
Developers and Funders
Download and Installation
Test Run
Sample Data Sets
Discrete Poisson Model, Space-Time and Spatial Variation in Temporal Trends: Brain Cancer Incidence in New Mexico
Bernoulli Model, Purely Spatial : Childhood Leukemia and Lymphoma Incidence in North Humberside
Space-Time Permutation Model: Hospital Emergency Room Admissions Due to Fever at New York City Hospitals
Multinomial and Ordinal Model, Purely Spatial: Education Attainment Levels in Maryland
Exponential Model, Space-Time : Artificially Created Survival Data
Normal Model, Purely Spatial : Artificially Created Continuous Data
Statistical Methodology
Spatial, Temporal and Space-Time Scan Statistics
Spatial Scan Statistic
Space-Time Scan Statistic
Temporal Scan Statistic
Bernoulli Model
Discrete Poisson Model
Space-Time Permutation Model
Multinomial Model
Ordinal Model
Exponential Model
Normal Model
Continuous Poisson Model
Probability Model Comparison
Few Cases Compared to Controls
Bernoulli versus Ordinal Model
Normal versus Exponential Model
Normal versus Ordinal Model
Discrete versus Homogeneous Poisson Model
Temporal Data
Likelihood Ratio Test
Non-Compactness Penalty Function
Secondary Clusters
Adjusting for More Likely Clusters
Covariate Adjustments
Covariate Adjustment Using the Input Files
E[c] = p*C/P
Covariate Adjustment Using Statistical Regression Software
Covariate Adjustment Using Multiple Data Sets
Spatial and Temporal Adjustments
Adjusting for Temporal Trends
Adjusting for Purely Spatial Clusters
Adjusting for Known Relative Risks
Missing Data
Bernoulli Model
Multinomial and Ordinal Models
Discrete Poisson Model
Continuous Poisson Model
Space-Time Permutation Model
Multivariate Scan with Multiple Data Sets
Comparison with Other Methods
Scan Statistics
Spatial and Space-Time Clustering
Descriptive Cluster Detection Methods
Cluster Detection Tests
Focused Cluster Tests
Global Clustering Tests
Global Space-Time Interaction Tests
Input Data
Data Requirements
Case File
Control File
Population File
Coordinates File
Cartesian Coordinates
Latitude and Longitude
Grid File
Non-Euclidian Neighbors File
Meta Location File
Max Circle Size File
Adjustments File
SaTScan Import Wizard
Step 1 – Selecting the Source File
Step 2: Specifying the File Format
Step 3: Matching Source File Variables with SaTScan Variables
Step 4: Saving the Imported File
SaTScan ASCII File Format
Time Formats
Basic SaTScan Features
Input Tab
Case File Name
Control File Name
Time Precision
Study Period
Population File Name
Coordinates File Name
Grid File Name
Coordinates
Analysis Tab
Type of Analysis
Probability Model
Discrete Poisson Model: The discrete Poisson model should be used when the background population reflects a certain risk mass such as total person years lived in an area. The cases are then included as part of the population count.
Continuous Poisson Model: The continuous Poisson model should be used when the null hypothesis is that observations are distributed randomly with constant intensity according to a homogeneous Poisson process over a user defined study area.
Polygons for the Continuous Poisson Model
Scan for High or Low Rates
Time Aggregation
Output Tab
Results File Name
Additional Output Files
Advanced Features
Multiple Data Sets Tab
Data Checking Tab
Temporal Data Check
Geographical Data Check
Neighbors Tab
Non-Euclidian Neighbors File
Meta Location File
Multiple Coordinates per Location
Spatial Window Tab
Maximum Spatial Cluster Size
Include Purely Temporal Clusters
Elliptic Scanning Window
Isotonic Spatial Scan Statistic
Temporal Window Tab
Maximum Temporal Cluster Size
Include Purely Spatial Clusters
Flexible Temporal Window Definition
Spatial and Temporal Adjustments Tab
Temporal Trend Adjustment
Spatial Adjustment
Adjustment with Known Relative Risks
Inference Tab
P-Value
Adjust for Earlier Analyses in Prospective Surveillance
Iterative Scan Statistic
Clusters Reported Tab
Criteria for Reporting Secondary Clusters
Maximum Reported Spatial Cluster Size
Additional Output Tab
Critical Values
Monte Carlo Rank
Column Headers
Running SaTScan
Specifying Analysis and Data Options
Launching the Analysis
Status Messages
Warnings and Errors
Warning Messages
Error Messages
Saving Analysis Parameters
To save analysis parameters
To open a saved parameter file
Parallel Processors
Batch Mode
Computing Time
Single Data Set
Multiple Data Sets
Memory Requirements
Standard Memory Allocation
Special Memory Allocation
Insufficient Memory
Results of Analysis
Standard Results File (*.out.*)
Cluster Information File (*.col.*)
Stratified Cluster Information File (*.sci.*)
Location Information File (*.gis.*)
Risk Estimates for Each Location File (*.rr.*)
Simulated Log Likelihood Ratios File (*.llr.*)
Miscellaneous
New Versions
Analysis History File
Random Number Generator
Contact Us
Acknowledgements
Financial Support
Comments and Suggestions
Frequently Asked Questions
Input Data
Analysis
Results
Interpretation
Operating Systems
SaTScan Bibliography
Suggested Citations
SaTScan Methodology Papers
Statistical Methodology
Normal Model
Adjustments
Adjusting for Covariates
Iterative Scan Statistics, Adjusting for More Likely Clusters
Computational Aspects
Algorithms
Random Number Generator
Macros
Visualization and Mapping
Methods Evaluations and Comparisons
Selected SaTScan Applications by Field of Study
Infectious Diseases
Parasitology
Syndromic Surveillance
Cancer
Cardiology
Rheumatology / Auto-Immune Diseases
Liver Diseases
Diabetes
Allergy and Asthma
Birth Defects and Other Congenital Outcomes
Pediatrics
Geriatrics
Neurological Diseases
Psychology
Brain Imaging
Alcohol and Drugs
Accidents and Suicide
Demography
Veterinary Medicine, Domestic Animals
Veterinary Medicine, Wildlife
Entomology
Ichthyology
Botany
Forestry
Ecology and the Environment
Natural and Human Disasters
Criminology
Transportation
History
Astronomy
Other References Mentioned in the User Guide
SaTScan TM User Guide for version 9.0 By Martin Kulldorff July, 2010 http://www.satscan.org/
Contents Introduction .................................................................................................................................................. 4 The SaTScan Software ..................................................................................................................... 4 Download and Installation ................................................................................................................ 5 Test Run ........................................................................................................................................... 5 Sample Data Sets .............................................................................................................................. 6 Statistical Methodology ................................................................................................................................ 9 Spatial, Temporal and Space-Time Scan Statistics ........................................................................ 10 Bernoulli Model ............................................................................................................................. 11 Discrete Poisson Model .................................................................................................................. 12 Space-Time Permutation Model ..................................................................................................... 12 Multinomial Model ........................................................................................................................ 13 Ordinal Model ................................................................................................................................ 14 Exponential Model ......................................................................................................................... 14 Normal Model ................................................................................................................................ 15 Continuous Poisson Model ............................................................................................................. 16 Probability Model Comparison ...................................................................................................... 17 Likelihood Ratio Test ..................................................................................................................... 18 Secondary Clusters ......................................................................................................................... 20 Adjusting for More Likely Clusters ................................................................................................ 20 Covariate Adjustments ................................................................................................................... 21 Spatial and Temporal Adjustments................................................................................................. 24 Missing Data .................................................................................................................................. 25 Multivariate Scan with Multiple Data Sets ..................................................................................... 27 Comparison with Other Methods.............................................................................................................. 28 Scan Statistics ................................................................................................................................. 28 Spatial and Space-Time Clustering ................................................................................................ 28 Input Data ................................................................................................................................................... 30 Data Requirements ......................................................................................................................... 30 Case File ......................................................................................................................................... 31 Control File .................................................................................................................................... 32 Population File ............................................................................................................................... 33 Coordinates File ............................................................................................................................. 33 Grid File ......................................................................................................................................... 35 Non-Euclidian Neighbors File ........................................................................................................ 35 Meta Location File ......................................................................................................................... 36 Max Circle Size File ....................................................................................................................... 36 Adjustments File............................................................................................................................. 37 SaTScan Import Wizard ................................................................................................................. 37 SaTScan ASCII File Format ........................................................................................................... 39 Basic SaTScan Features ............................................................................................................................. 41 Input Tab ........................................................................................................................................ 41 Analysis Tab ................................................................................................................................... 44 Output Tab ..................................................................................................................................... 48 Advanced Features ..................................................................................................................................... 50 Multiple Data Sets Tab ................................................................................................................... 50 Data Checking Tab ......................................................................................................................... 52 Neighbors Tab ................................................................................................................................ 53 Spatial Window Tab ....................................................................................................................... 54 Temporal Window Tab .................................................................................................................. 57 Spatial and Temporal Adjustments Tab ......................................................................................... 59 Inference Tab ................................................................................................................................. 61 SaTScan User Guide v9.0
Clusters Reported Tab .................................................................................................................... 64 Additional Output Tab ................................................................................................................... 66 Running SaTScan ....................................................................................................................................... 68 Specifying Analysis and Data Options ........................................................................................... 68 Launching the Analysis .................................................................................................................. 68 Status Messages .............................................................................................................................. 69 Warnings and Errors....................................................................................................................... 69 Saving Analysis Parameters ........................................................................................................... 70 Parallel Processors ......................................................................................................................... 71 Batch Mode .................................................................................................................................... 71 Computing Time............................................................................................................................. 72 Memory Requirements ................................................................................................................... 73 Results of Analysis ...................................................................................................................................... 76 Standard Results File (*.out.*) ....................................................................................................... 76 Cluster Information File (*.col.*) ................................................................................................... 78 Stratified Cluster Information File (*.sci.*) .................................................................................... 80 Location Information File (*.gis.*) ................................................................................................ 80 Risk Estimates for Each Location File (*.rr.*) ............................................................................... 81 Simulated Log Likelihood Ratios File (*.llr.*) ............................................................................... 81 Miscellaneous .............................................................................................................................................. 82 New Versions ................................................................................................................................. 82 Analysis History File ...................................................................................................................... 82 Random Number Generator ........................................................................................................... 82 Contact Us ...................................................................................................................................... 82 Acknowledgements ........................................................................................................................ 83 Frequently Asked Questions ...................................................................................................................... 85 Input Data ....................................................................................................................................... 85 Analysis .......................................................................................................................................... 86 Results ............................................................................................................................................ 86 Interpretation .................................................................................................................................. 87 Operating Systems .......................................................................................................................... 89 SaTScan Bibliography ................................................................................................................................ 90 Suggested Citations ........................................................................................................................ 90 SaTScan Methodology Papers........................................................................................................ 91 Selected SaTScan Applications by Field of Study ......................................................................... 95 Other References Mentioned in the User Guide ........................................................................... 107 SaTScan User Guide v9.0
Introduction The SaTScan Software Purpose SaTScan is a free software that analyzes spatial, temporal and space-time data using the spatial, temporal, or space-time scan statistics. It is designed for any of the following interrelated purposes: • Perform geographical surveillance of disease, to detect spatial or space-time disease clusters, and to see if they are statistically significant. • Test whether a disease is randomly distributed over space, over time or over space and time. • Evaluate the statistical significance of disease cluster alarms. • Perform prospective real-time or time-periodic disease surveillance for the early detection of disease outbreaks. The software may also be used for similar problems in other fields such as archaeology, astronomy, botany, criminology, ecology, economics, engineering, forestry, genetics, geography, geology, history, neurology or zoology. Data Types and Methods SaTScan can be used for discrete as well as continuous scan statistics. For discrete scan statistics the geographical locations where data are observed are non-random and fixed by the user. These locations may be the actual locations of the observations, such as houses, schools or ant nests, or it could be a central location representing a larger area, such as the geographical or population weighted centroids of postal areas, counties or provinces. For continuous scan statistics, the locations of the observations are random and can occur anywhere within a predefined study area defined by the user, such as a rectangle. For discrete scan statistics, SaTScan uses either a discrete Poisson-based model, where the number of events in a geographical location is Poisson-distributed, according to a known underlying population at risk; a Bernoulli model, with 0/1 event data such as cases and controls; a space-time permutation model, using only case data; a multinomial model for categorical data; an ordinal model, for ordered categorical data; an exponential model for survival time data with or without censored variables; a normal model for other types of continuous data; or a spatial variation in temporal trends model, looking for geographical areas with unusually high or low temporal trends. A common feature of all these discrete scan statistics is that the geographical locations where data can be observed are non-random and fixed by the user. For the discrete scan statistics, the data may be either aggregated at the census tract, zip code, county or other geographical level, or there may be unique coordinates for each observation. SaTScan adjusts for the underlying spatial inhomogeneity of a background population. It can also adjust for any number of categorical covariates provided by the user, as well as for temporal trends, known space-time clusters and missing data. It is possible to scan multiple data sets simultaneously to look for clusters that occur in one or more of them. For continuous scan statistics, SaTScan uses a continuous Poisson model. SaTScan User Guide v9.0 4
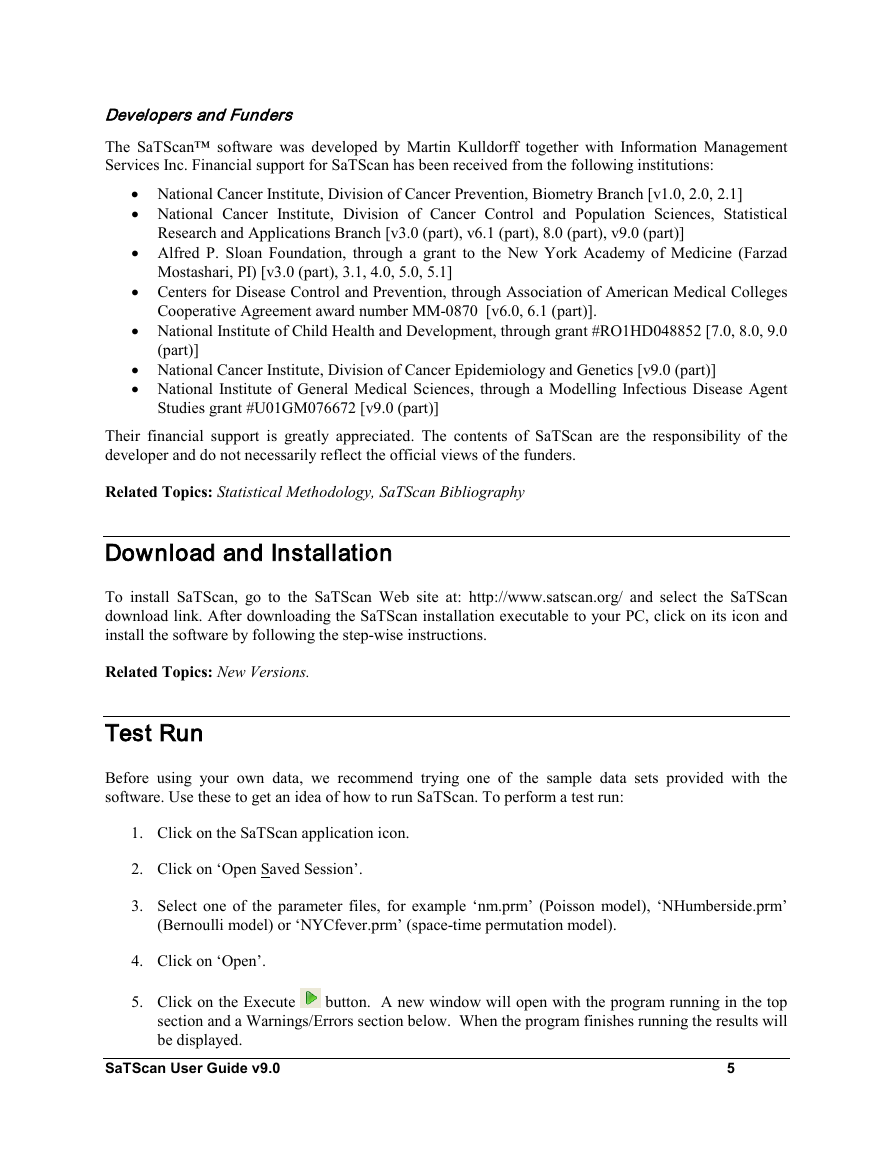
Developers and Funders The SaTScan™ software was developed by Martin Kulldorff together with Information Management Services Inc. Financial support for SaTScan has been received from the following institutions: • National Cancer Institute, Division of Cancer Prevention, Biometry Branch [v1.0, 2.0, 2.1] • National Cancer Institute, Division of Cancer Control and Population Sciences, Statistical Research and Applications Branch [v3.0 (part), v6.1 (part), 8.0 (part), v9.0 (part)] • Alfred P. Sloan Foundation, through a grant to the New York Academy of Medicine (Farzad Mostashari, PI) [v3.0 (part), 3.1, 4.0, 5.0, 5.1] • Centers for Disease Control and Prevention, through Association of American Medical Colleges Cooperative Agreement award number MM-0870 [v6.0, 6.1 (part)]. • National Institute of Child Health and Development, through grant #RO1HD048852 [7.0, 8.0, 9.0 (part)] • National Cancer Institute, Division of Cancer Epidemiology and Genetics [v9.0 (part)] • National Institute of General Medical Sciences, through a Modelling Infectious Disease Agent Studies grant #U01GM076672 [v9.0 (part)] Their financial support is greatly appreciated. The contents of SaTScan are the responsibility of the developer and do not necessarily reflect the official views of the funders. Related Topics: Statistical Methodology, SaTScan Bibliography Download and Installation To install SaTScan, go to the SaTScan Web site at: http://www.satscan.org/ and select the SaTScan download link. After downloading the SaTScan installation executable to your PC, click on its icon and install the software by following the step-wise instructions. Related Topics: New Versions. Test Run Before using your own data, we recommend trying one of the sample data sets provided with the software. Use these to get an idea of how to run SaTScan. To perform a test run: 1. Click on the SaTScan application icon. 2. Click on ‘Open Saved Session’. 3. Select one of the parameter files, for example ‘nm.prm’ (Poisson model), ‘NHumberside.prm’ (Bernoulli model) or ‘NYCfever.prm’ (space-time permutation model). 4. Click on ‘Open’. 5. Click on the Execute button. A new window will open with the program running in the top section and a Warnings/Errors section below. When the program finishes running the results will be displayed. SaTScan User Guide v9.0 5
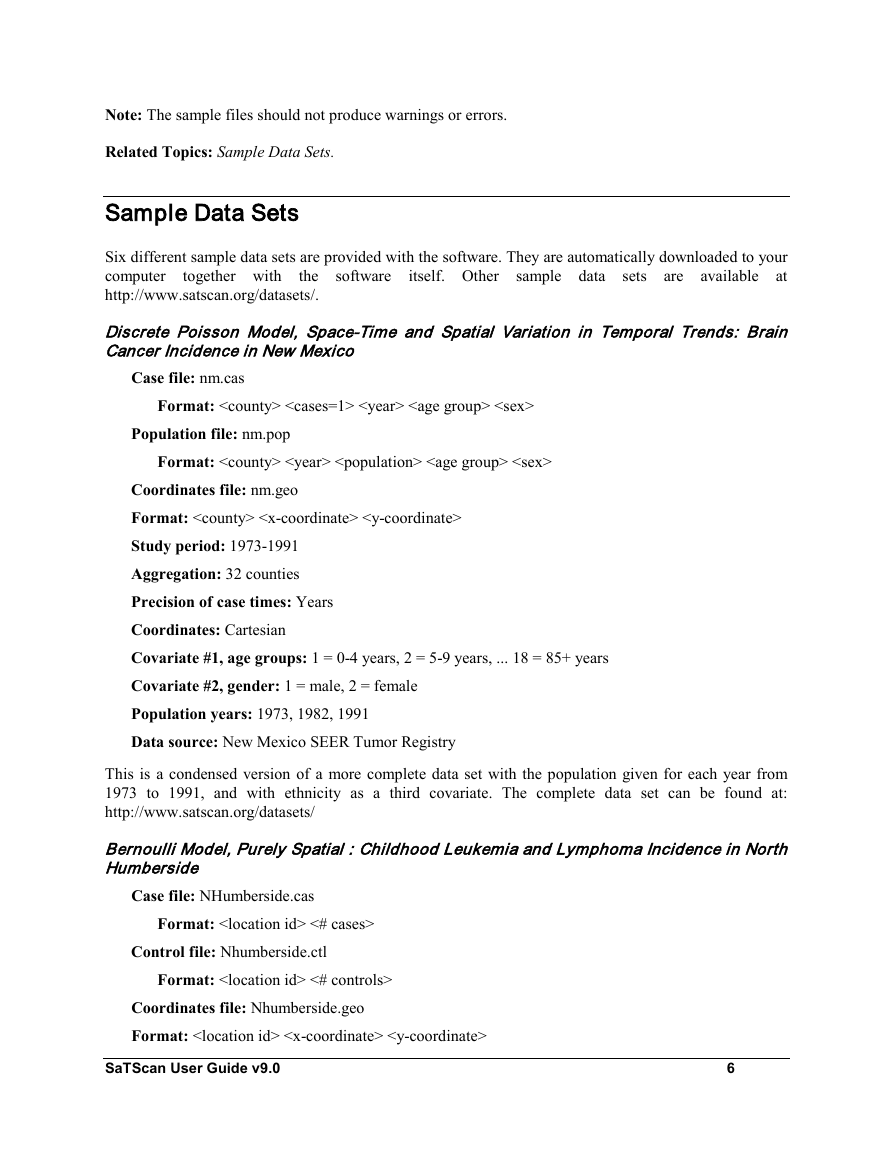
Note: The sample files should not produce warnings or errors. Related Topics: Sample Data Sets. Sample Data Sets Six different sample data sets are provided with the software. They are automatically downloaded to your computer sets are available at the http://www.satscan.org/datasets/. together with sample data software itself. Other Discrete Poisson Model, Space-Time and Spatial Variation in Temporal Trends: Brain Cancer Incidence in New Mexico Case file: nm.cas Format: Population file: nm.pop Format: Coordinates file: nm.geo Format: Study period: 1973-1991 Aggregation: 32 counties Precision of case times: Years Coordinates: Cartesian Covariate #1, age groups: 1 = 0-4 years, 2 = 5-9 years, ... 18 = 85+ years Covariate #2, gender: 1 = male, 2 = female Population years: 1973, 1982, 1991 Data source: New Mexico SEER Tumor Registry This is a condensed version of a more complete data set with the population given for each year from 1973 to 1991, and with ethnicity as a third covariate. The complete data set can be found at: http://www.satscan.org/datasets/ Bernoulli Model, Purely Spatial : Childhood Leukemia and Lymphoma Incidence in North Humberside Case file: NHumberside.cas Format: <# cases> Control file: Nhumberside.ctl Format: <# controls> Coordinates file: Nhumberside.geo Format: SaTScan User Guide v9.0 6
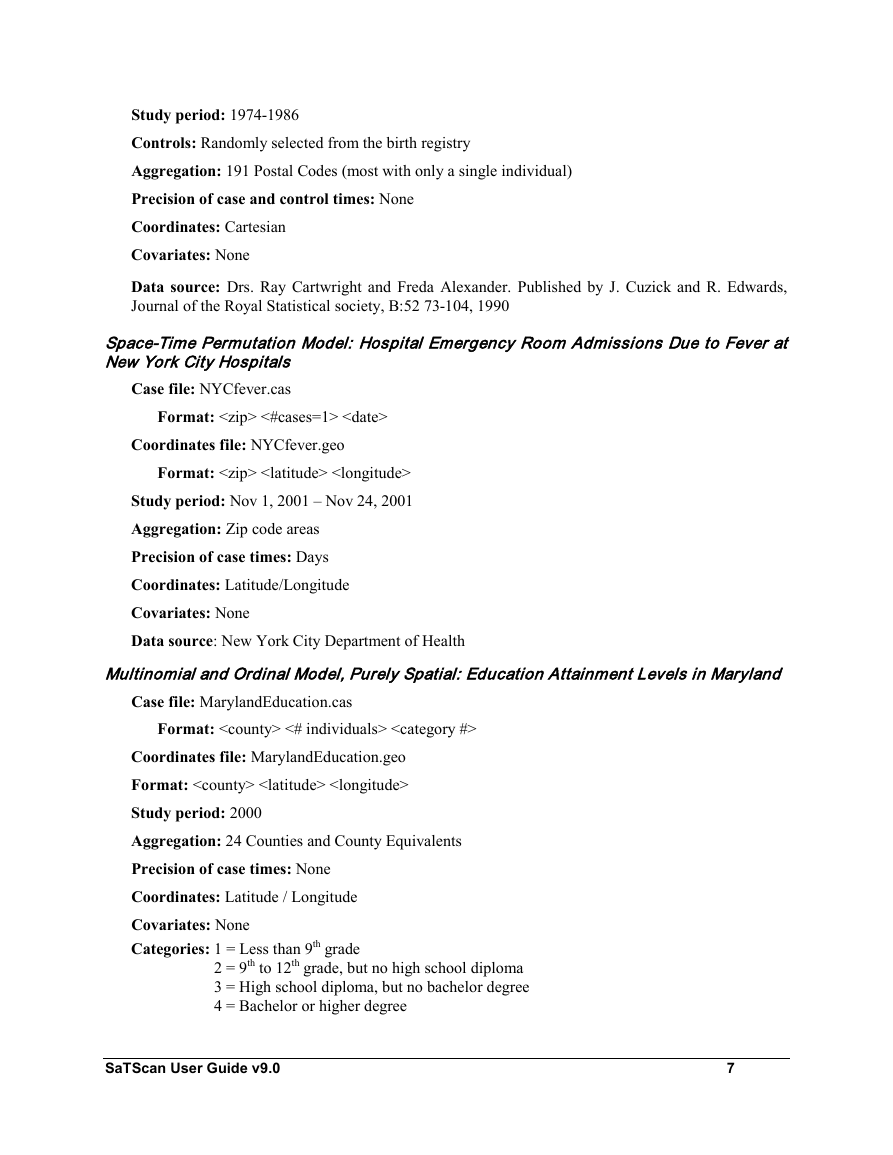
Study period: 1974-1986 Controls: Randomly selected from the birth registry Aggregation: 191 Postal Codes (most with only a single individual) Precision of case and control times: None Coordinates: Cartesian Covariates: None Data source: Drs. Ray Cartwright and Freda Alexander. Published by J. Cuzick and R. Edwards, Journal of the Royal Statistical society, B:52 73-104, 1990 Space-Time Permutation Model: Hospital Emergency Room Admissions Due to Fever at New York City Hospitals Case file: NYCfever.cas Format: <#cases=1> Coordinates file: NYCfever.geo Format: Study period: Nov 1, 2001 – Nov 24, 2001 Aggregation: Zip code areas Precision of case times: Days Coordinates: Latitude/Longitude Covariates: None Data source: New York City Department of Health Multinomial and Ordinal Model, Purely Spatial: Education Attainment Levels in Maryland Case file: MarylandEducation.cas Format: <# individuals> Coordinates file: MarylandEducation.geo Format: Study period: 2000 Aggregation: 24 Counties and County Equivalents Precision of case times: None Coordinates: Latitude / Longitude Covariates: None Categories: 1 = Less than 9th grade 2 = 9th to 12th grade, but no high school diploma 3 = High school diploma, but no bachelor degree 4 = Bachelor or higher degree SaTScan User Guide v9.0 7
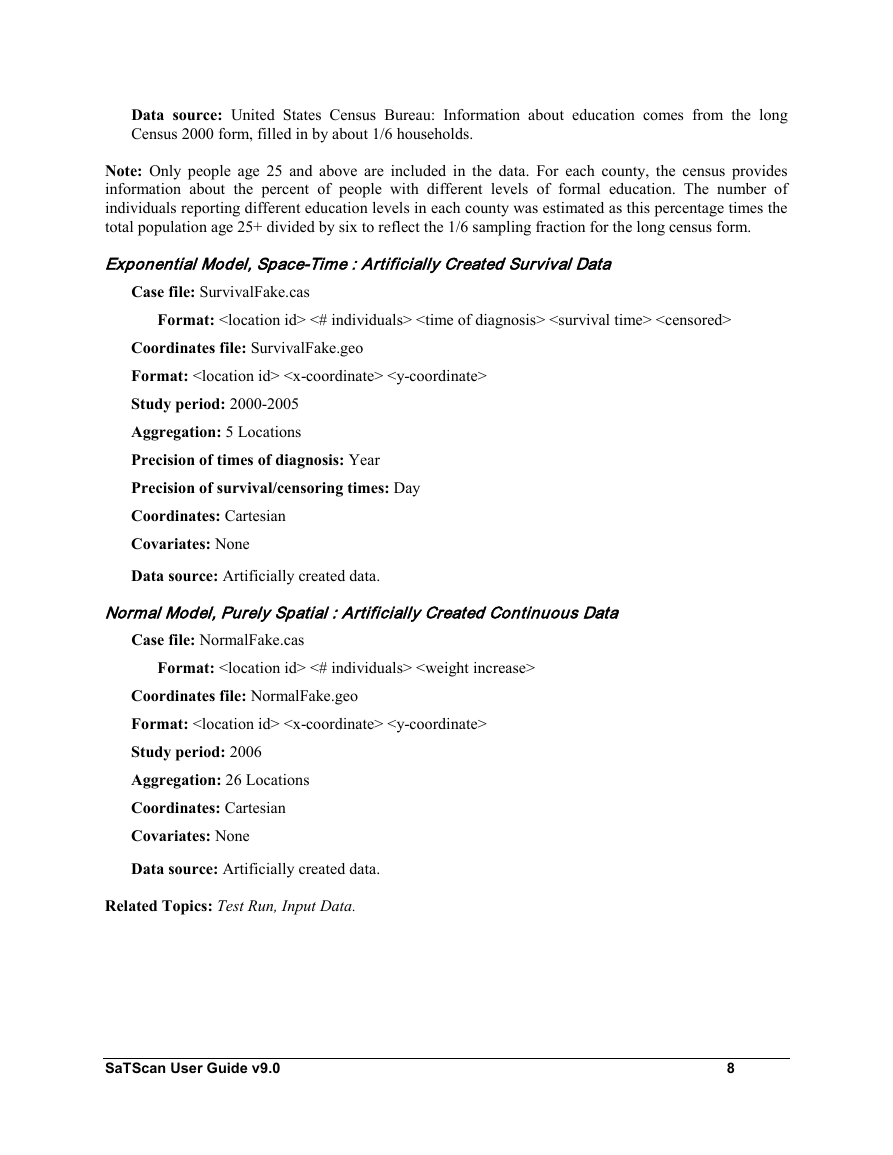
Data source: United States Census Bureau: Information about education comes from the long Census 2000 form, filled in by about 1/6 households. Note: Only people age 25 and above are included in the data. For each county, the census provides information about the percent of people with different levels of formal education. The number of individuals reporting different education levels in each county was estimated as this percentage times the total population age 25+ divided by six to reflect the 1/6 sampling fraction for the long census form. Exponential Model, Space-Time : Artificially Created Survival Data Case file: SurvivalFake.cas Format: <# individuals>
分享到:
收藏